

Briefly: In our opinion, full (150% of the regular full position) speculative short positions in gold, silver and mining stocks are justified from the risk/reward perspective. This position was originally featured on Jan. 12, 2017 at 3:49PM.
Quite a lot has been written about the link between the Japanese yen and the price of gold, but there’s another important part of the connection between Japan and gold – the relationship between the Nikkei 225 Index and the price of gold can also tell us quite a lot about the big changes in the price of gold. What can it tell us right now?
In short, it tells us that we should prepare ourselves for another big drop in the price of gold. Here’s why (charts courtesy of http://stockcharts.com).
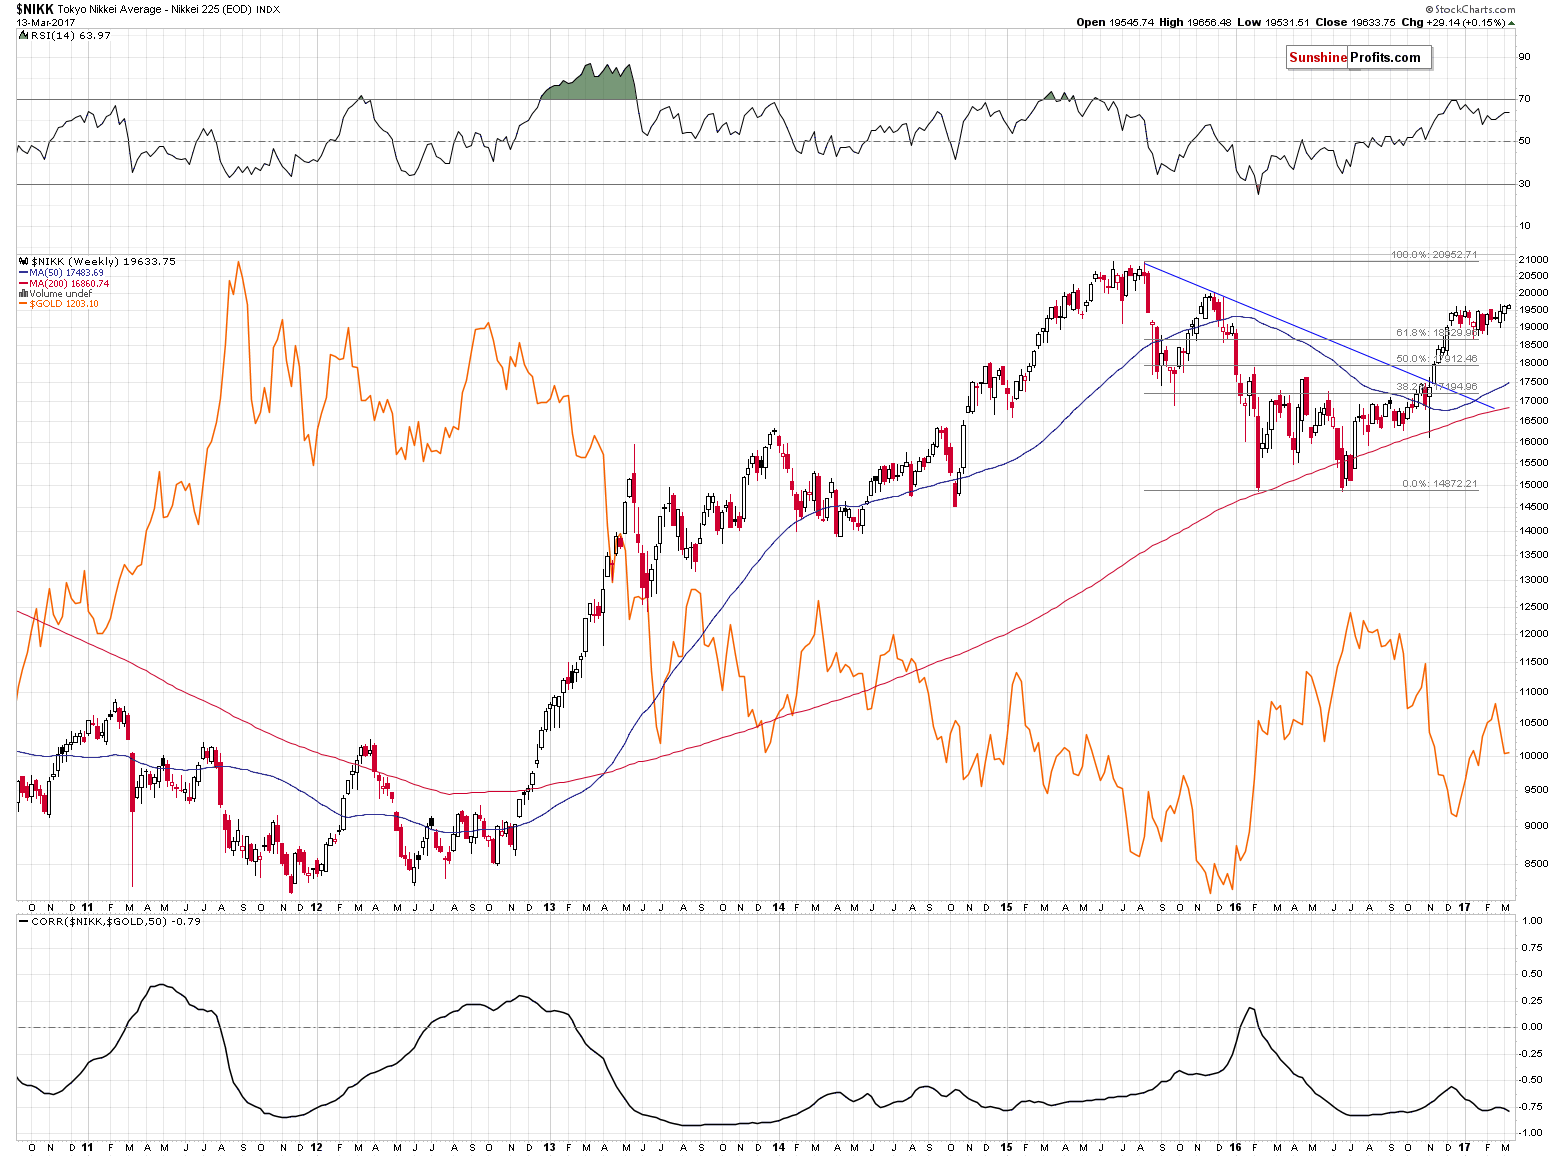
The link between the Japanese stocks and the price of gold is not as simple to follow as the one between gold and the USD Index as it does not necessarily work on a short-term basis. The important thing is that major changes and major moves in the Nikkei correspond to major changes and major moves in gold.
What’s so interesting about this link right now is that we just saw a major development in the Nikkei based on last week’s closing prices. Namely, we saw a breakout and a weekly close above the 19,500 level – something that stopped the huge rally in December 2016. The breakout may not be huge (and thus not many gold investors noticed it), but weekly closing prices are definitely significant (there was no invalidation yesterday either). What are the implications of the breakout that one sees after a quite large (3 months) consolidation? It suggests that we are about to see another rally that will be similar to the rally that preceded the consolidation. The decline in the Nikkei that preceded it (as well as the rally in gold that preceded) was huge – it rallied from about 15,000. In other words, the implications are very bullish for Japanese stocks.
Now, the big deal for gold investors is that such a big rally in the Nikkei would be a major event – something that is likely to correspond to a major event in gold. Based on gold’s negative correlation with the Nikkei, one can expect a major decline in gold in the following weeks and months.
But is gold really on a verge of another big slide? Comparing the price of gold with the value of the S&P 500 Index makes it quite clear.
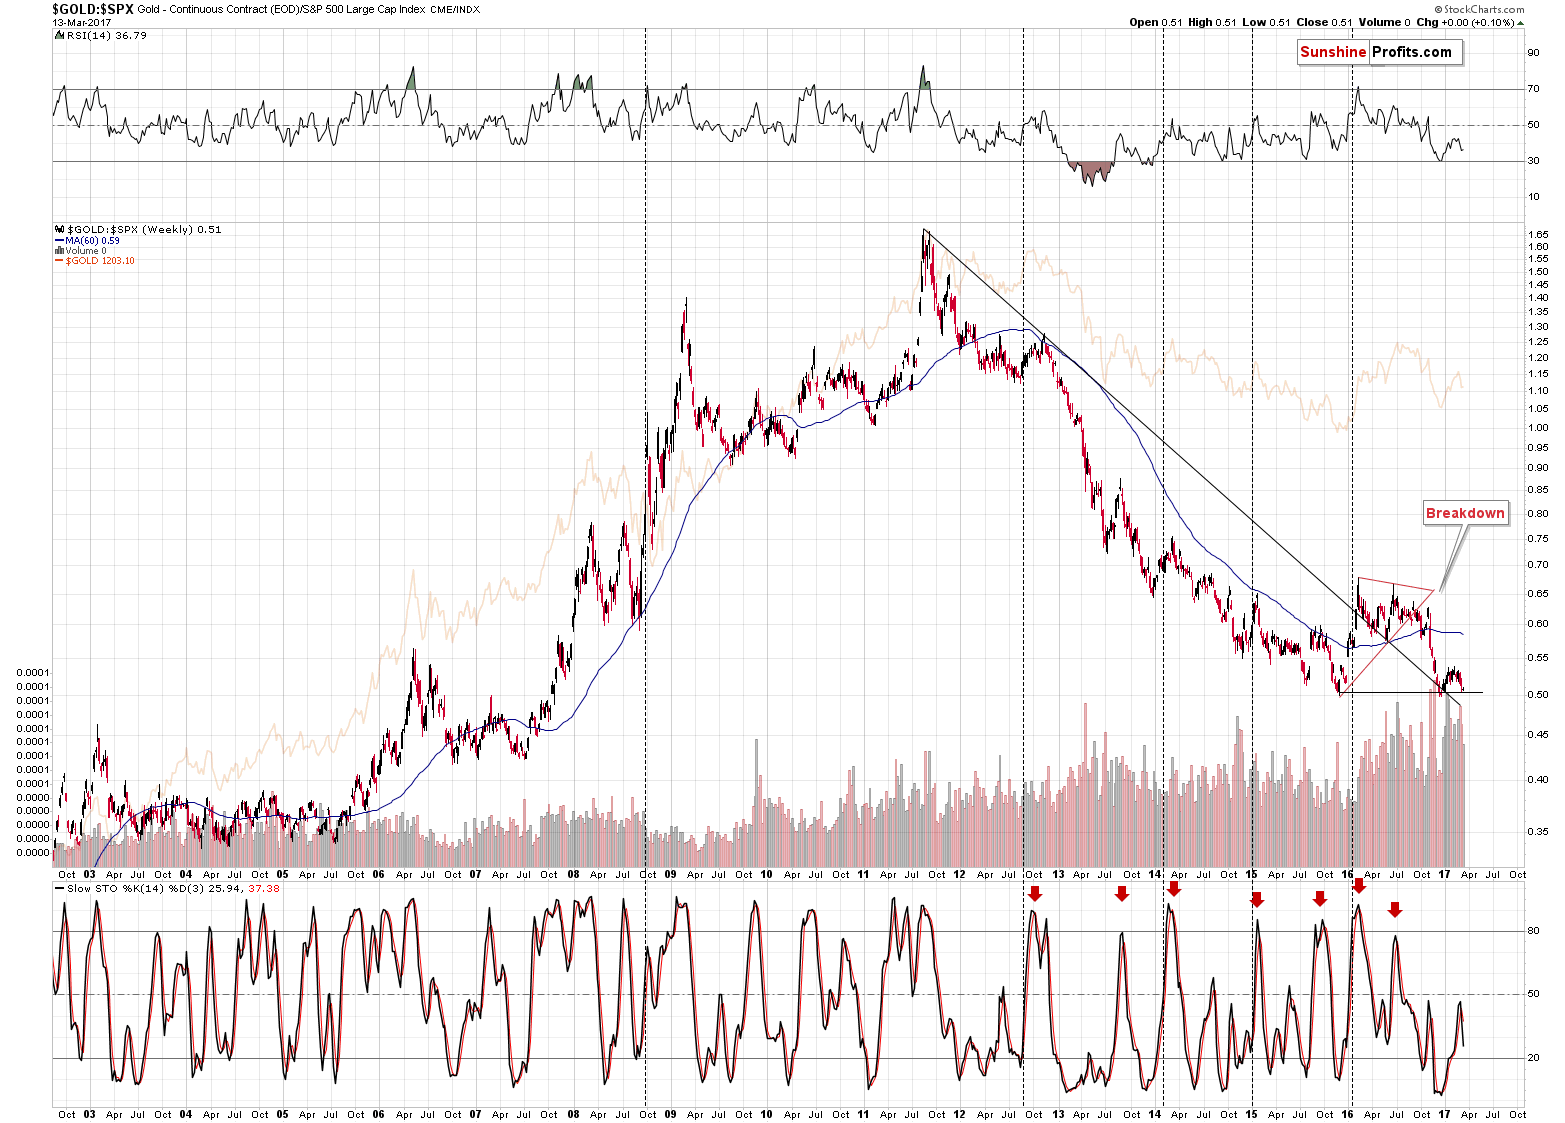
Gold’s ratio to the S&P is once again at its 2015 low. It’s already after one corrective upswing and it appears to be ready to break lower. What’s important here is that there is no meaningful support until the 2006 and 2007 lows and then until the 2003, 2004 and 2005 lows. Consequently, once the gold vs. stocks ratio breaks below the 2015 low, it’s likely to fall hard.
What about gold itself?
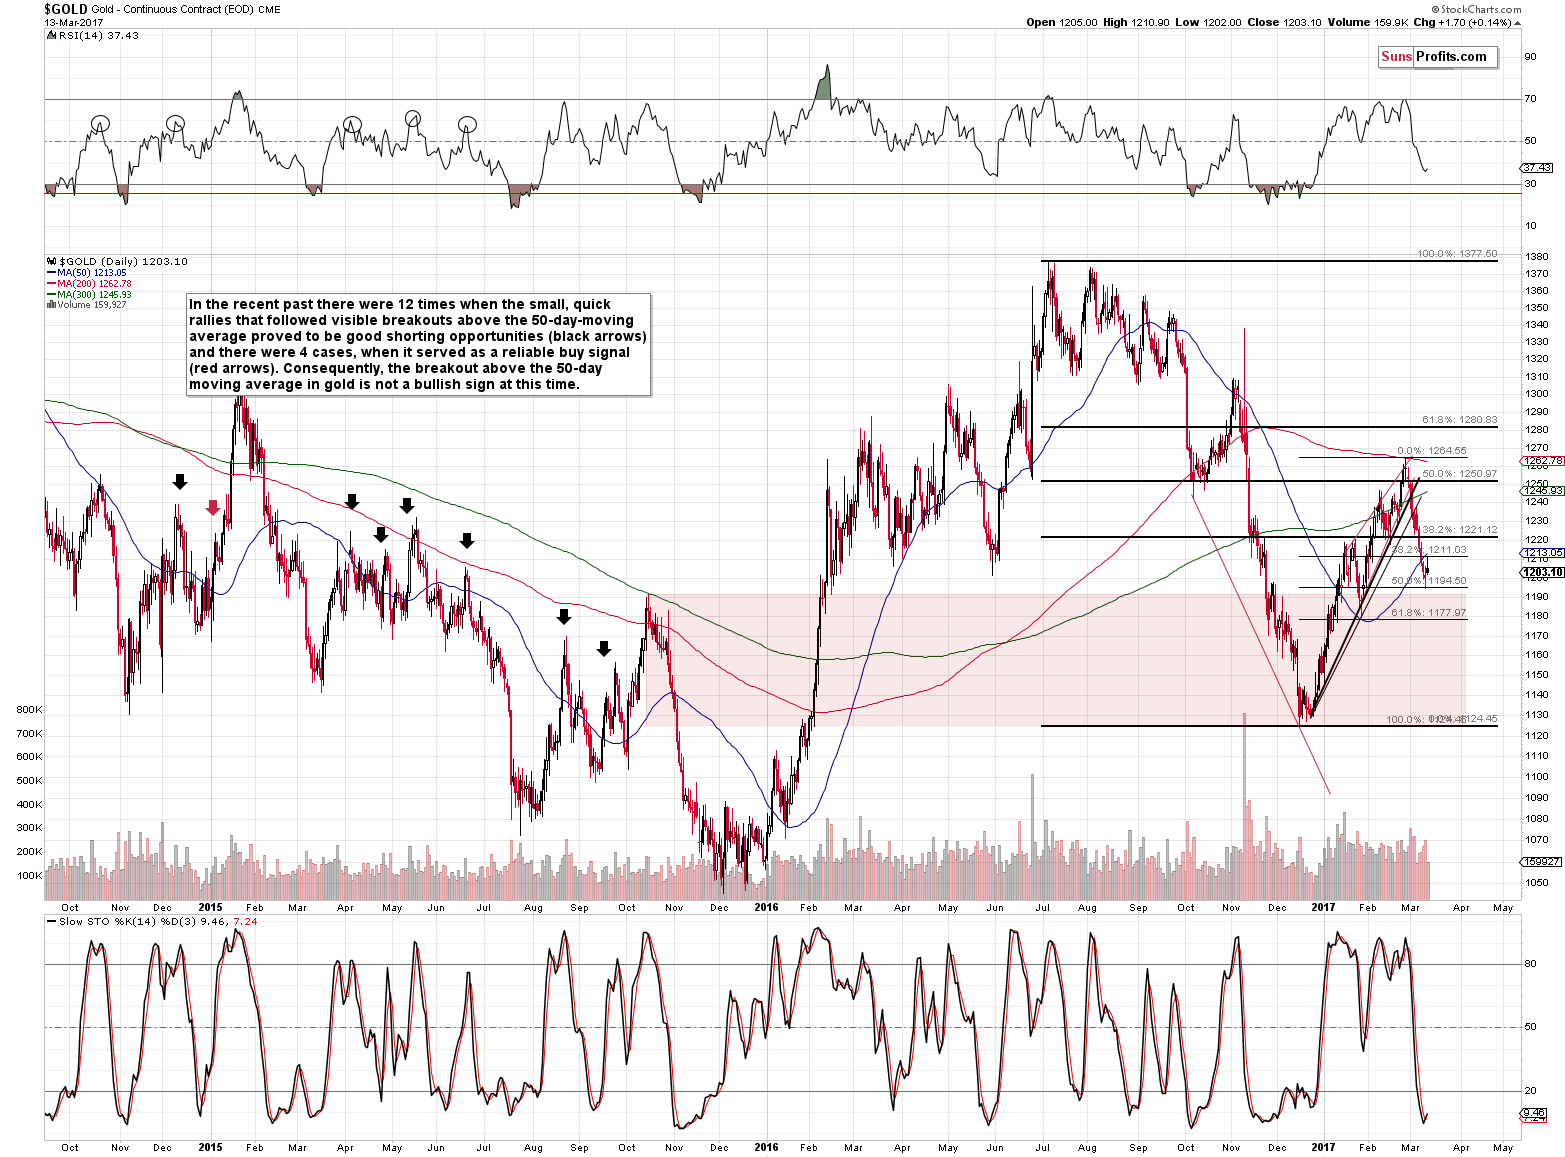
Gold broke back below the 50-day moving average and it seems to have verified this breakdown by moving back to it and then declining again. Please note that the volume that accompanied this small daily upswing was relatively small, which confirms that the outlook is currently bearish, also from the short-term point of view.
Moving back to the issues of gold being on the verge of another big drop – even the short-term gold chart features this phenomenon (to a small extent, though, but still). As we emphasized in the previous alerts, the area marked in red is where gold moved either up or down without looking back (with the small exception of the late January 2017 low). Consequently, once gold declines visibly below $1,190, we might not see a bigger turnaround until $1,130.
The situation in the USD Index seems to confirm the above.
In yesterday’s alert, we wrote the following:
One of the bigger factors at this time is the current (alleged) head-and-shoulder pattern in the USD Index (the late December 2016 top being the head and the November top and the current being the shoulders) and in particular, its similarity to the previous (fake) head-and-shoulders pattern (the July 2016 top being the head and May 2016 and August-September tops being the shoulders).
Why “alleged” and “fake”? Because in both cases, the patterns were not completed and yet it appeared that they would be completed “shortly”. The head-and-shoulders patterns in the USD Index are quite often misleading (and as Nadia Simmons says regarding these patterns in case of USD Index’s biggest component – the EUR/USD pair – are anti-reliable as so many of them have the effect that is opposite to the expected one) and thus we can actually expect a rally in the following weeks instead of a decline – just like what we saw in October 2016 and the following months.
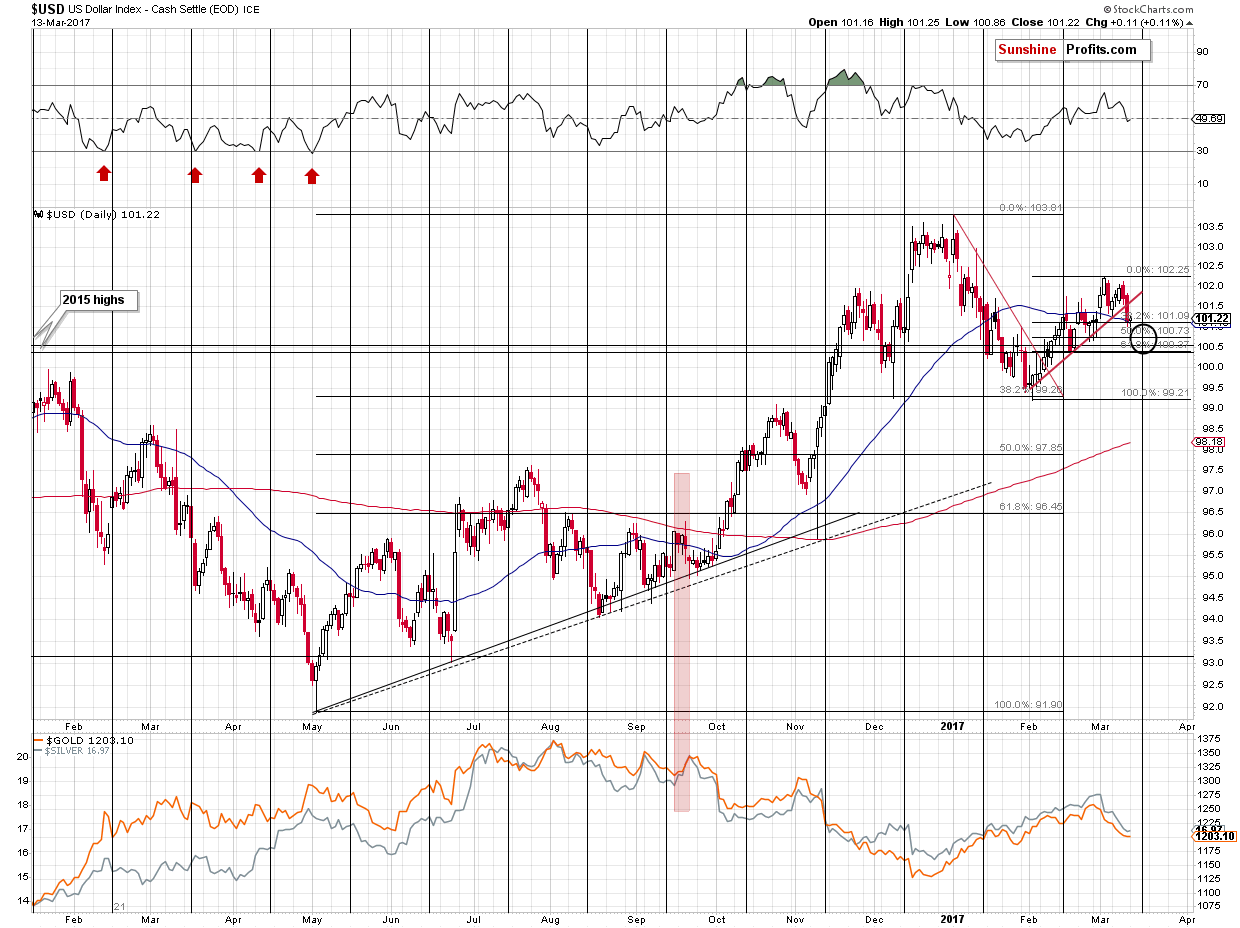
Both patterns are quite similar in terms of size and (to a smaller degree, but still) shape, so we could expect some similarity in the follow-up action as well. Back in September 2016, the second decline was visibly smaller than the previous one – it corrected about half of the previous short-term upswing. Applying this analogy to the current situation, gives us 100.73 as the downside target. Since the USD Index already moved to 101, it could be the case that the bottom was almost reached.
Still, other Fibonacci retracements (38.2% and 61.8%) are also useful in case of the USD Index (as well as the EUR/USD pair) and therefore 101.09 and 100.37 also serve as target levels. Moreover, the 100.5 level is particularly important as that’s what (approximately) stopped both major rallies of 2015.
All in all, it appears that the bottom in the USD Index is at hand, or perhaps already in. Why is that is important?
It is important for the USD Index, because (mostly based on the long-term chart but also due to the mentioned head-and-shoulders self-similarity) the rally that is likely to follow is probably going to be huge. A repeat of the late-2016 rally would take the USD Index to the 109 – 110 area, which is well above the current levels.
It is important for the precious metals market, because the late-2016 rally in the USD Index corresponded to a big decline in the metals. Gold declined over $200. We actually expect a decline that’s even bigger, but the above analogy is enough to indicate that the likely follow-up slide is probably going to be huge.
Yesterday’s intra-day low was 100.86 – a mere 0.15 above one of the target levels – it could very well be the case that the short-term decline in the USD Index is already over. The outlook for the USD Index improved based on yesterday’s session, and the implications for the precious metals sector are more bearish than they were previously.
Summing up, it appears that the potential size of the decline in the USD Index and rally in metals are very limited and that the medium-term trends will resume shortly (if they haven’t already resumed, that is). The breakout in the Japanese stocks indicates that a major slide in gold is just around the corner. It appears that speculative short positions in the precious metals sector remain justified from the risk to reward point of view.
As always, we will keep you – our subscribers – informed.
To summarize:
Trading capital (supplementary part of the portfolio; our opinion): Short positions (150% of the full position) in gold, silver and mining stocks are justified from the risk/reward perspective with the following stop-loss orders and initial target price levels / profit-take orders:
- Gold: exit-profit-take level: $1,063; stop-loss: $1,273; initial target price for the DGLD ETN: $81.88; stop-loss for the DGLD ETN $48.17
- Silver: initial target price: $13.12; stop-loss: $18.67; initial target price for the DSLV ETN: $46.18; stop-loss for the DSLV ETN $19.87
- Mining stocks (price levels for the GDX ETF): initial target price: $9.34; stop-loss: $26.34; initial target price for the DUST ETF: $143.56; stop-loss for the DUST ETF $21.37
In case one wants to bet on junior mining stocks' prices (we do not suggest doing so – we think senior mining stocks are more predictable in the case of short-term trades – if one wants to do it anyway, we provide the details), here are the stop-loss details and initial target prices:
- GDXJ ETF: initial target price: $14.13; stop-loss: $45.31
- JDST ETF: initial target price: $104.26; stop-loss: $10.78
Long-term capital (core part of the portfolio; our opinion): No positions (in other words: cash)
Insurance capital (core part of the portfolio; our opinion): Full position
Please note that the in the trading section we describe the situation for the day that the alert is posted. In other words, it we are writing about a speculative position, it means that it is up-to-date on the day it was posted. We are also featuring the initial target prices, so that you can decide whether keeping a position on a given day is something that is in tune with your approach (some moves are too small for medium-term traders and some might appear too big for day-traders).
Plus, you might want to read why our stop-loss orders are usually relatively far from the current price.
Please note that a full position doesn’t mean using all of the capital for a given trade. You will find details on our thoughts on gold portfolio structuring in the Key Insights section on our website.
As a reminder – “initial target price” means exactly that – an “initial” one, it’s not a price level at which we suggest closing positions. If this becomes the case (like it did in the previous trade) we will refer to these levels as levels of exit orders (exactly as we’ve done previously). Stop-loss levels, however, are naturally not “initial”, but something that, in our opinion, might be entered as an order.
Since it is impossible to synchronize target prices and stop-loss levels for all the ETFs and ETNs with the main markets that we provide these levels for (gold, silver and mining stocks – the GDX ETF), the stop-loss levels and target prices for other ETNs and ETF (among other: UGLD, DGLD, USLV, DSLV, NUGT, DUST, JNUG, JDST) are provided as supplementary, and not as “final”. This means that if a stop-loss or a target level is reached for any of the “additional instruments” (DGLD for instance), but not for the “main instrument” (gold in this case), we will view positions in both gold and DGLD as still open and the stop-loss for DGLD would have to be moved lower. On the other hand, if gold moves to a stop-loss level but DGLD doesn’t, then we will view both positions (in gold and DGLD) as closed. In other words, since it’s not possible to be 100% certain that each related instrument moves to a given level when the underlying instrument does, we can’t provide levels that would be binding. The levels that we do provide are our best estimate of the levels that will correspond to the levels in the underlying assets, but it will be the underlying assets that one will need to focus on regarding the signs pointing to closing a given position or keeping it open. We might adjust the levels in the “additional instruments” without adjusting the levels in the “main instruments”, which will simply mean that we have improved our estimation of these levels, not that we changed our outlook on the markets. We are already working on a tool that would update these levels on a daily basis for the most popular ETFs, ETNs and individual mining stocks.
Our preferred ways to invest in and to trade gold along with the reasoning can be found in the how to buy gold section. Additionally, our preferred ETFs and ETNs can be found in our Gold & Silver ETF Ranking.
As always, we'll keep you - our subscribers - updated should our views on the market change. We will continue to send out Gold & Silver Trading Alerts on each trading day and we will send additional Alerts whenever appropriate.
The trading position presented above is the netted version of positions based on subjective signals (opinion) from your Editor, and the Tools and Indicators.
As a reminder, Gold & Silver Trading Alerts are posted before or on each trading day (we usually post them before the opening bell, but we don't promise doing that each day). If there's anything urgent, we will send you an additional small alert before posting the main one.
=====
Latest Free Trading Alerts:
During Thursday’s press conference, Draghi sounded more hawkish than usually. What does this imply for the gold market?
March Draghi’s Press Conference and Gold
=====
Hand-picked precious-metals-related links:
Solving the Secret Behind the Chinese Gold Market
UK's BullionVault to offer investors physical platinum trade
=====
In other news:
Fed, in shift, may move to faster pace of rate hikes
Fed to Hike But Avoid Signaling Faster Pace: Decision-Day Guide
BOJ expected to pull back from stimulus, maybe as early as this year
Pound Falls in London Trading as May Gets Brexit Go-Ahead
Why Robert Shiller Is Worried About the Trump Rally
Opinion: This is the most overvalued stock market on record — even worse than 1929
Bill Ackman Dumps Valeant, All Of It
=====
Thank you.
Sincerely,
Przemyslaw Radomski, CFA
Founder, Editor-in-chief, Gold & Silver Fund Manager
Gold & Silver Trading Alerts
Forex Trading Alerts
Oil Investment Updates
Oil Trading Alerts

