

Briefly: In our opinion, regular (100% of the full position) speculative short positions in gold, silver and mining stocks are justified from the risk/reward perspective. The above means that we are moving to a regular position size from the extra-large positions that we had opened right after Trump’s victory. We are therefore taking sizable profits off the table, but we are keeping a smaller (regular) position intact.
The USD Index moved a bit over 100 yesterday and precious metals moved to new lows. However, the size of the decline was limited (and mining stocks even managed to move higher), which is a sign that a bottom is already in. Is this really the case? Let’s take a look at the charts (charts courtesy of http://stockcharts.com).
This time we’ll start with the USD Index.
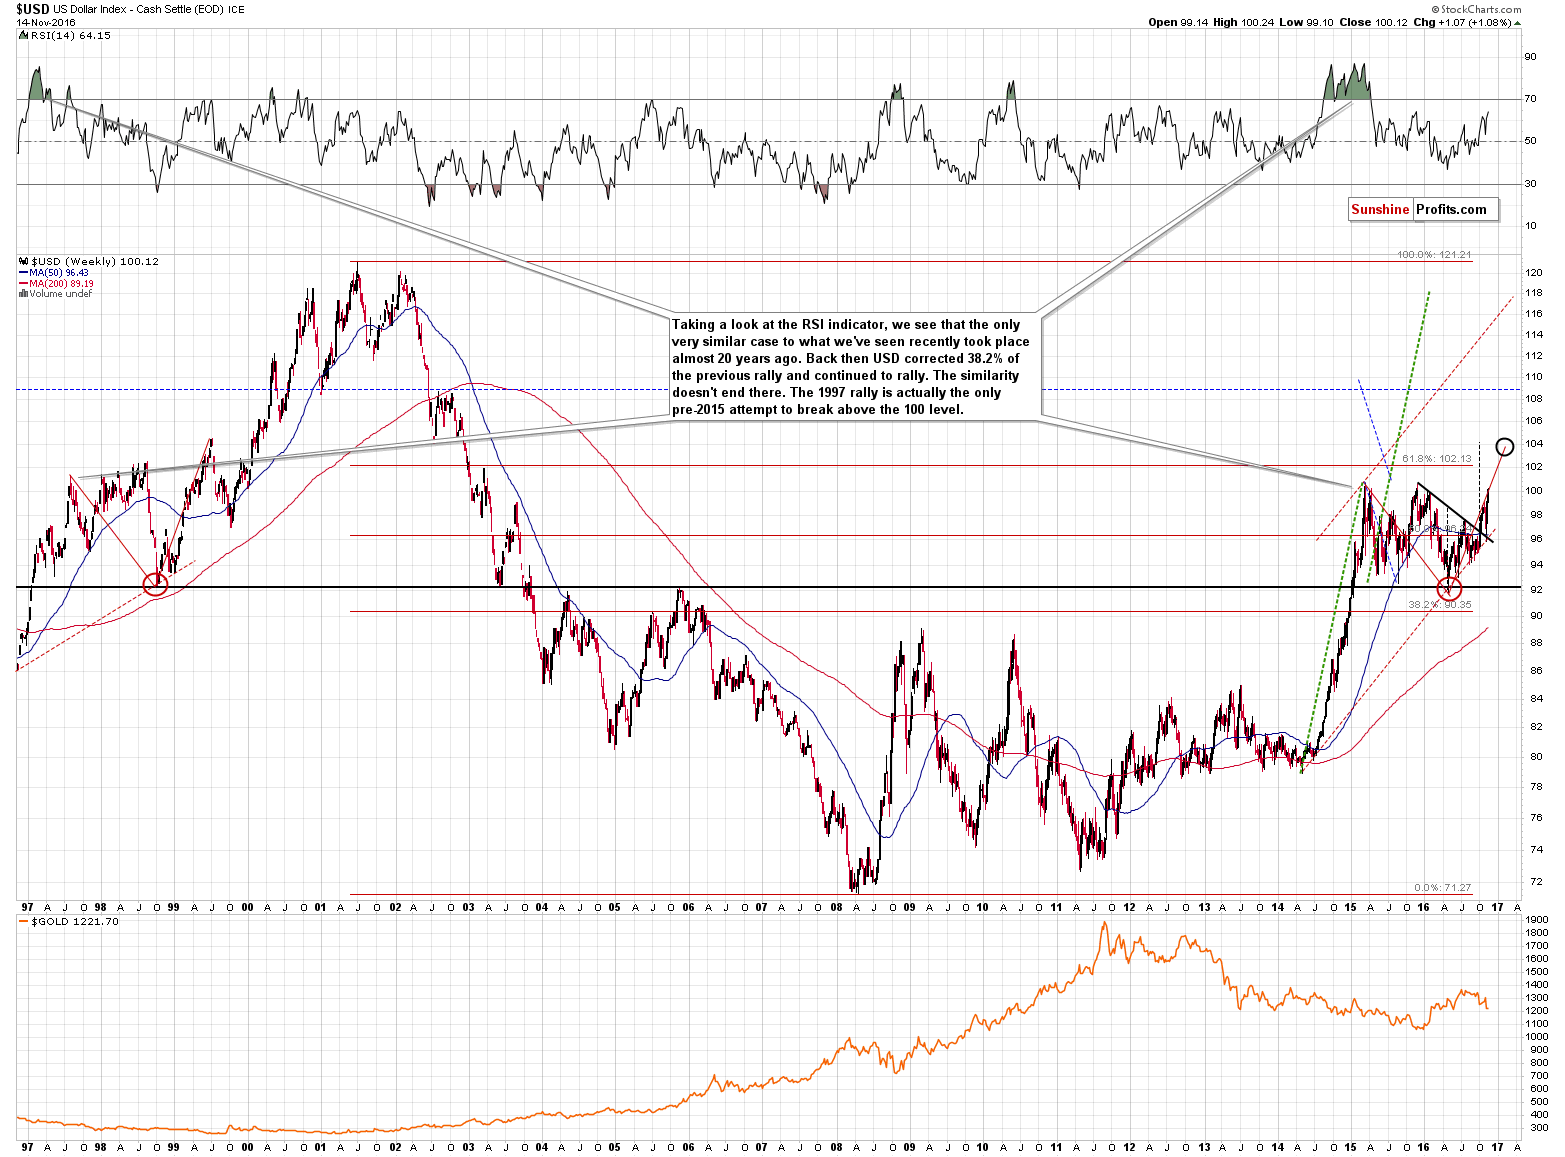
The key chart to look at is the very long-term one. The key thing about yesterday’s session is that the USD Index reached the 100 level once again. That’s the third attempt of the USD Index to move above this level and it seems likely that… It will actually succeed this time. However, this is not widely expected. People remember that 100 was unbreakable in the recent history and that the rally preceding it was sharp. Thus, one can really expect a corrective downswing from here. The problem is that when too many people believe in a certain scenario it’s unlikely to take place (in case of some markets, the same goes for “too perfect” chart patterns that everyone recognizes) and it seems that this is what we have right now. The above is quite vague, though, so it’s not a key bullish thing to focus on right now.
There are 2 other – more important – factors: the analogy to the 1999 rally and the symmetry between the previous big decline (the 2001 top – the 2009 bottom) and the current big rally (the 2009 bottom – now). We discussed the former thoroughly previously (and what we wrote previously remains up-to-date), so we’ll discuss the latter. We are in the part of the decline that is symmetrical to what we saw in late 2002 and early 2003. Back then the USD Index was breaking below 100 and now it’s breaking above it. What makes the symmetry so special right now? The time that it took between the breakdown below 100 and the middle of the symmetry (the 2009 bottom) is extremely close to the time between the 2009 bottom and the current moment. The previous attempts of the USD Index to break above 100 were likely unsuccessful because the time factor was not fulfilled. In other words, the USD Index had previously rallied too fast and too soon. The USD Index is now after an almost 2-year-long consolidation – it was definitely enough to cool down investors’ emotions after the huge 2014 – 2015 rally. Consequently, the USD Index can rally further and - based on the symmetrical analogy - it’s likely to.
So, why did we choose to limit the size of the short position at this time?
Because the combination of extreme amount of strongly bearish signals is no longer present and at the same time we saw a relatively good performance of gold and mining stocks in yesterday’s trading. Plus, some support levels were reached – they were not our target levels yet (with the exception of silver where the upper part of our target area was indeed reached). In other words, the outlook improved and moved from extremely bearish to bearish.
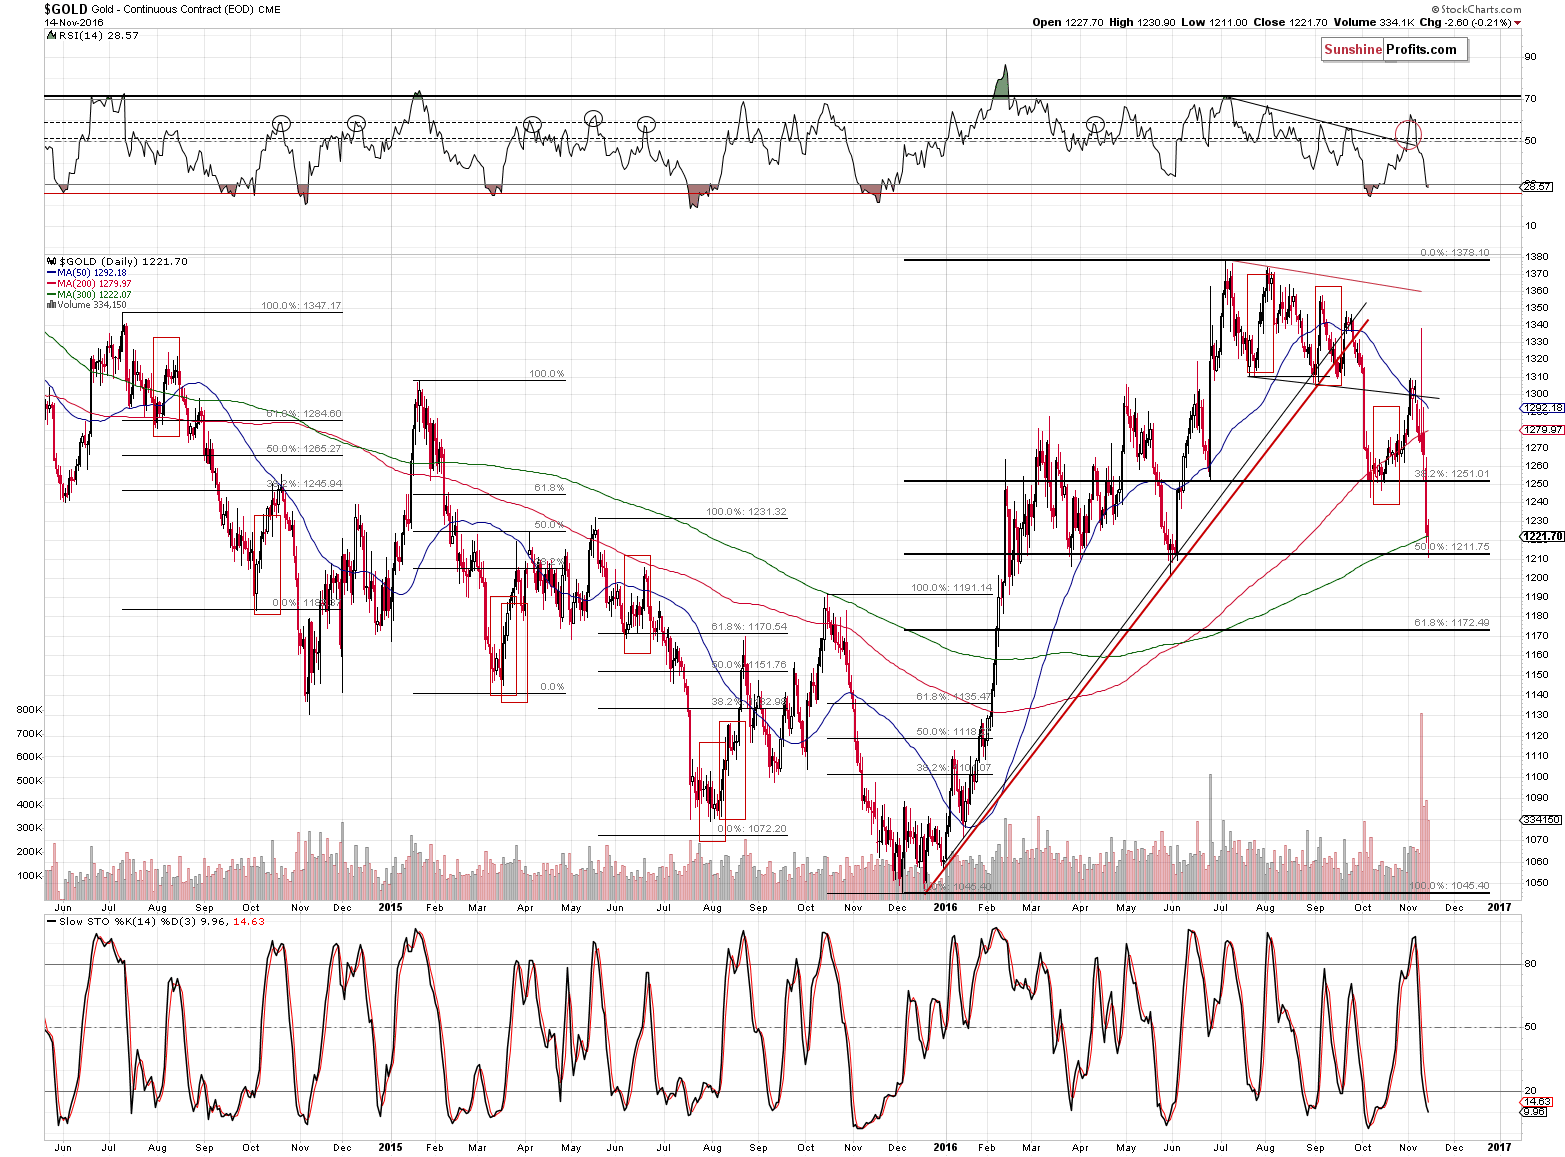
Gold moved to the 50% Fibonacci retracement level (and more or less the previous lows) and declined by less than $3 yesterday (in terms of closing prices). That’s very little in light of yesterday’s 1.07 rally in the USD Index. Still, gold’s rather positive reaction could have simply been caused by the 100 level – most investors could expect a reversal here and thus are not believing in gold’s declines as they think that USD’s rally is done. Once USD breaks above 100 in a more visible way, metals and miners could catch up by declining more profoundly.
Gold is after a rather long corrective upswing (before the U.S. elections), so it does not need another consolidation right away. It seems more likely that a bigger rebound would be seen after the following (61.8% Fibonacci retracement) support level is reached.
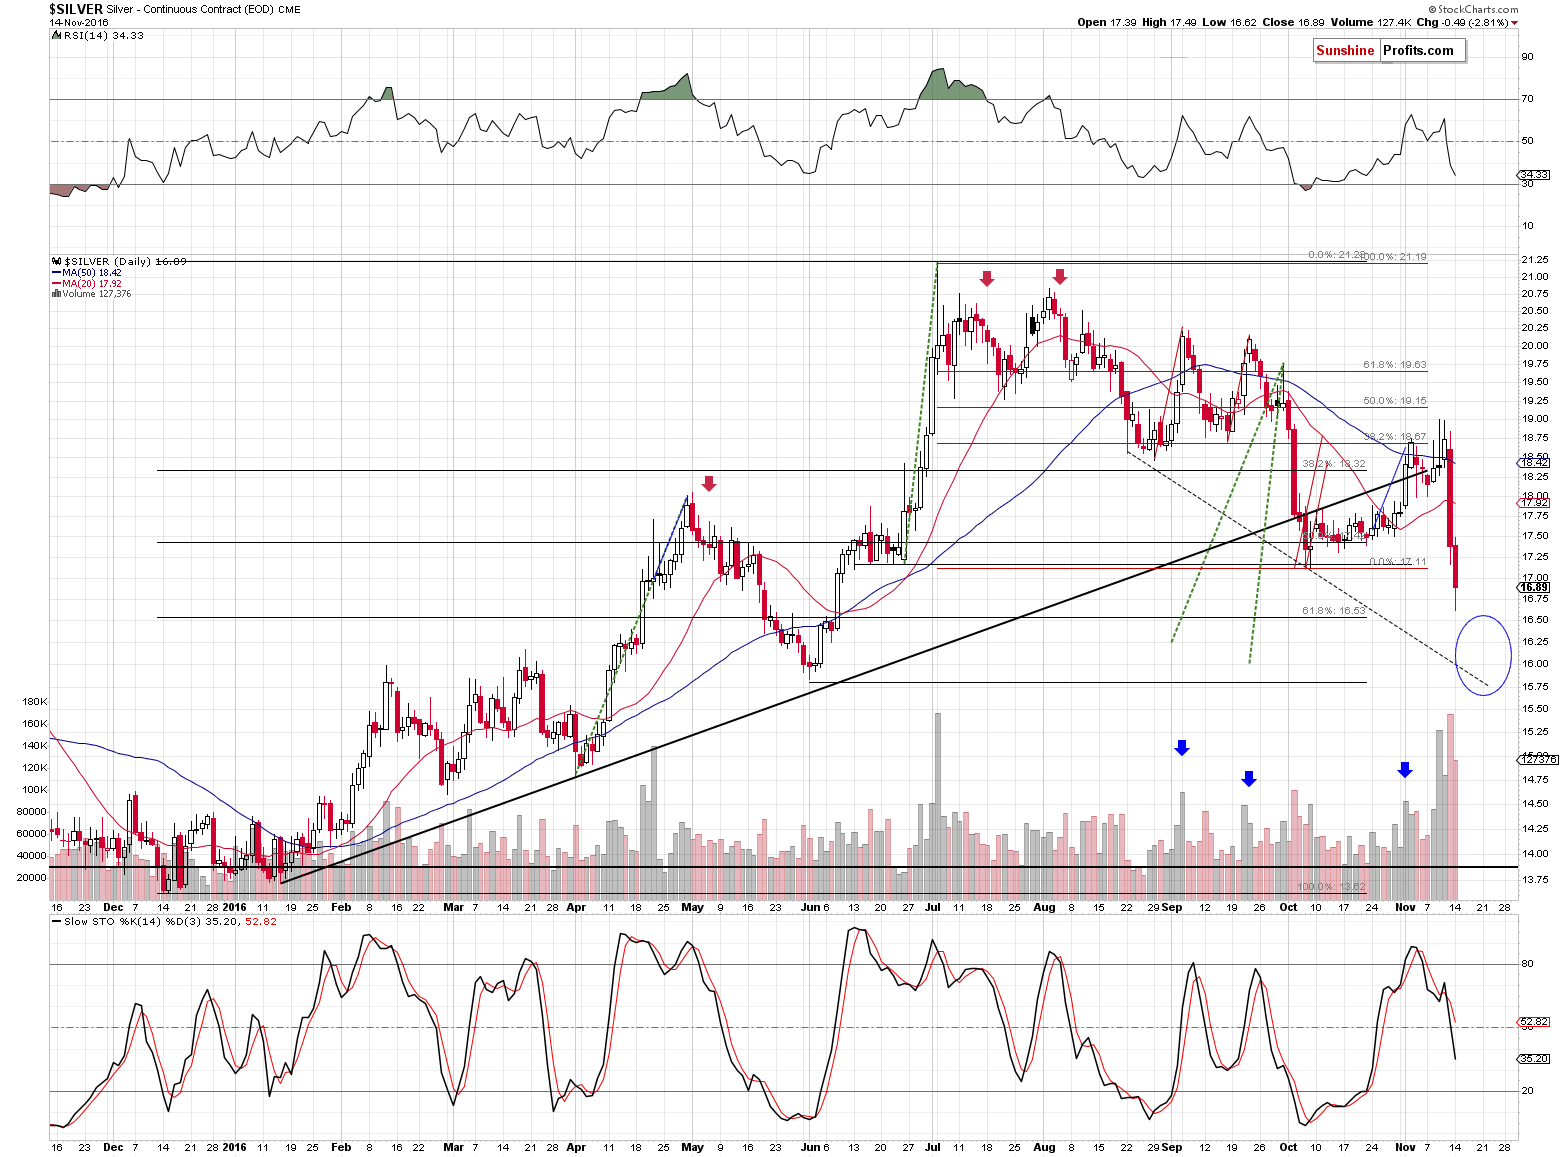
Silver moved very close to its 61.8% Fibonacci retracement level yesterday, so it could be the case that it corrects from here. Then again, silver moved just a little below the previous lows and it’s likely that such a breakdown would be followed by a more visible decline than what we saw so far – likely to the declining support line – close to the $16 level. The volume on which silver moved lower was significant, which supports the bearish case.
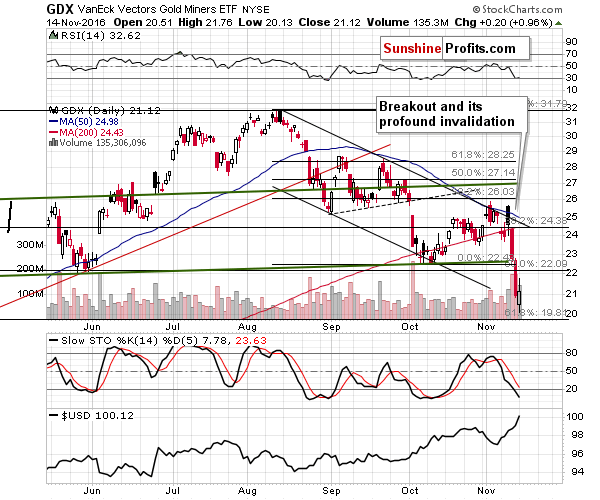
Mining stocks moved a bit below the declining support line (lower border of the declining trend channel) and then moved back above it. The invalidation of the breakdown was a bullish sign.
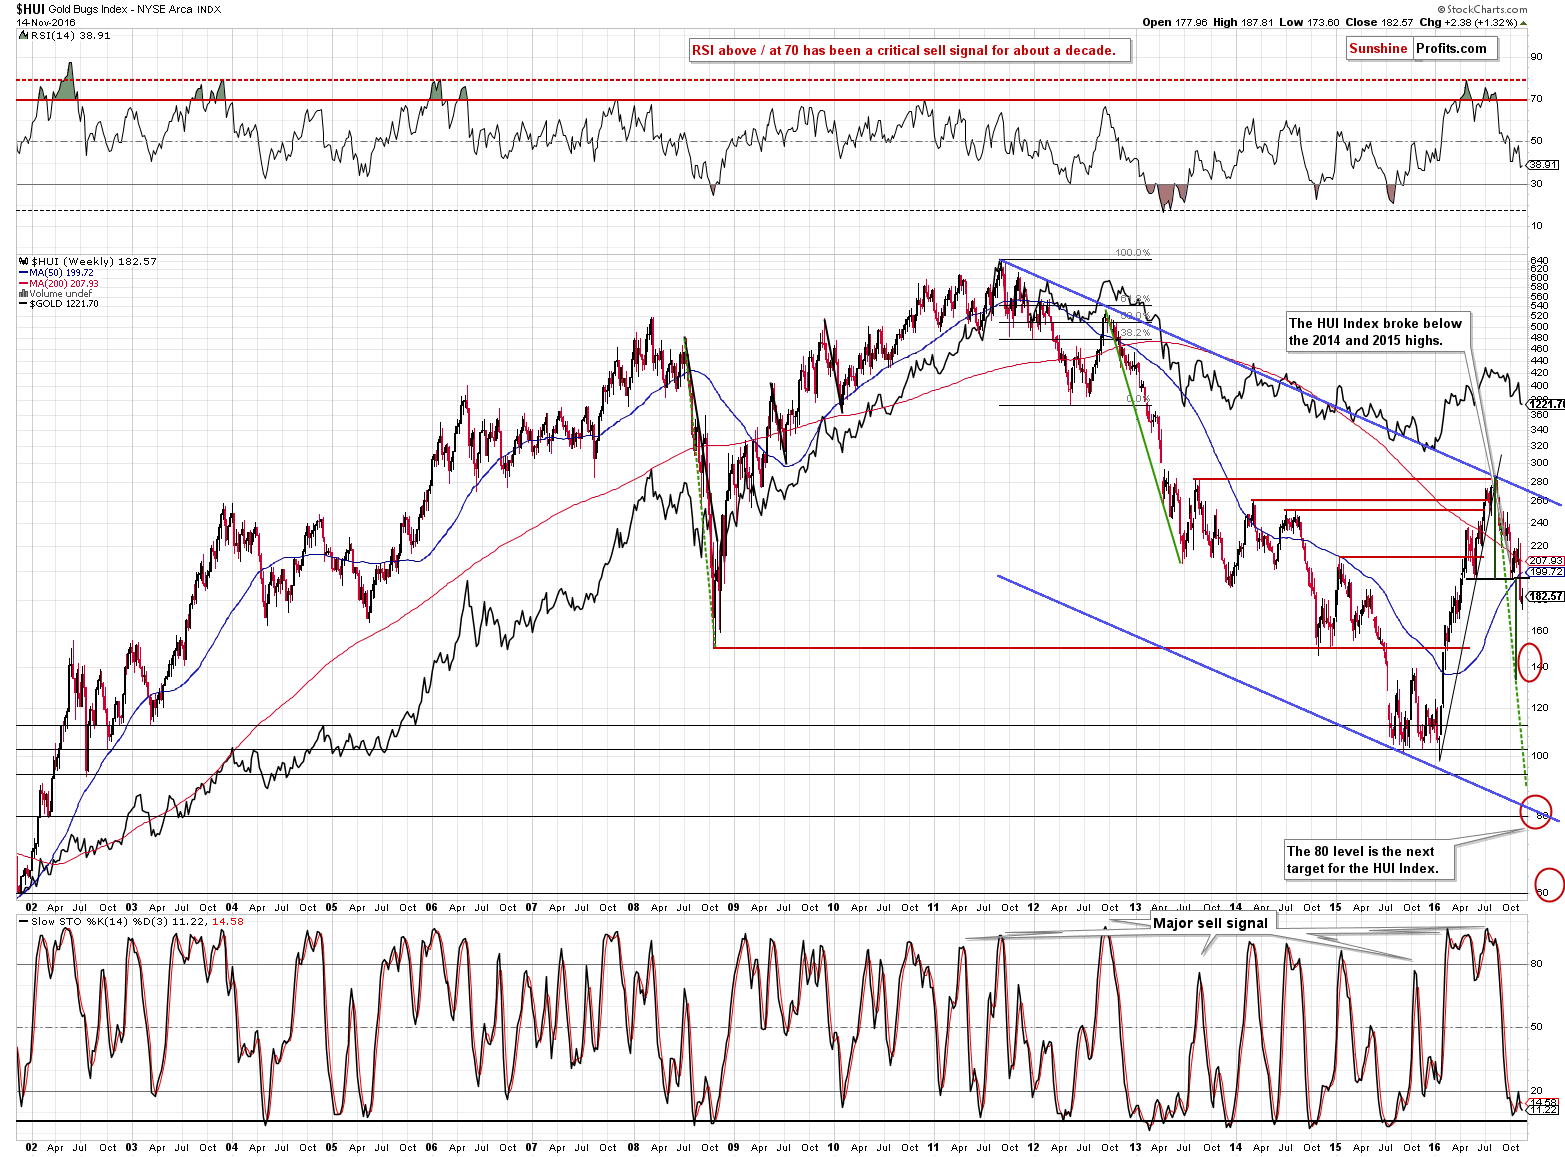
Still, let’s keep in mind that based on the long-term HUI Index (gold stocks) chart, the decline is likely to continue for much longer.
Summing up, the outlook for the precious metals market remains bearish for the following weeks, but it’s no longer extremely bearish, since a few support levels were reached and gold (along with mining stocks) showed strength yesterday. Therefore, we are partially taking profits off the table, but keeping a regular short position intact.
We realize that the above decision may generate some negative feedback (if metals rally from here, it could seem to be a bad decision to keep the position open at all; if metals decline, it could seem to be a bad decision to limit the position), but it seems to be the thing that is currently justified from the risk to reward point o view. If we didn’t have any position before, we would have opened a short position today, but not an extra-large one – consequently, we are adjusting the position accordingly.
As always, we will keep you – our subscribers – updated.
To summarize:
Trading capital (supplementary part of the portfolio; our opinion): Short positions (full position) in gold, silver and mining stocks are justified from the risk/reward perspective with the following entry prices, stop-loss orders and initial target price levels:
- Gold: initial target price: $1,006; stop-loss: $1,272, initial target price for the DGLD ETN: $73.19; stop-loss for the DGLD ETN $47.51
- Silver: initial target price: $13.12; stop-loss: $18.13, initial target price for the DSLV ETN: $39.78; stop-loss for the DSLV ETN $22.81
- Mining stocks (price levels for the GDX ETF): initial target price: $9.34; stop-loss: $23.12, initial target price for the DUST ETF: $297; stop-loss for the DUST ETF $38.52
In case one wants to bet on junior mining stocks' prices (we do not suggest doing so – we think senior mining stocks are more predictable in the case of short-term trades – if one wants to do it anyway, we provide the details), here are the stop-loss details and initial target prices:
- GDXJ ETF: initial target price: $14.13; stop-loss: $38.23
- JDST ETF: initial target price: $245; stop-loss: $26.58
Long-term capital (core part of the portfolio; our opinion): No positions
Insurance capital (core part of the portfolio; our opinion): Full position
Plus, you might want to read why our stop-loss orders are usually relatively far from the current price.
Please note that a full position doesn’t mean using all of the capital for a given trade. You will find details on our thoughts on gold portfolio structuring in the Key Insights section on our website.
As a reminder – “initial target price” means exactly that – an “initial” one, it’s not a price level at which we suggest closing positions. If this becomes the case (like it did in the previous trade) we will refer to these levels as levels of exit orders (exactly as we’ve done previously). Stop-loss levels, however, are naturally not “initial”, but something that, in our opinion, might be entered as an order.
Since it is impossible to synchronize target prices and stop-loss levels for all the ETFs and ETNs with the main markets that we provide these levels for (gold, silver and mining stocks – the GDX ETF), the stop-loss levels and target prices for other ETNs and ETF (among other: UGLD, DGLD, USLV, DSLV, NUGT, DUST, JNUG, JDST) are provided as supplementary, and not as “final”. This means that if a stop-loss or a target level is reached for any of the “additional instruments” (DGLD for instance), but not for the “main instrument” (gold in this case), we will view positions in both gold and DGLD as still open and the stop-loss for DGLD would have to be moved lower. On the other hand, if gold moves to a stop-loss level but DGLD doesn’t, then we will view both positions (in gold and DGLD) as closed. In other words, since it’s not possible to be 100% certain that each related instrument moves to a given level when the underlying instrument does, we can’t provide levels that would be binding. The levels that we do provide are our best estimate of the levels that will correspond to the levels in the underlying assets, but it will be the underlying assets that one will need to focus on regarding the signs pointing to closing a given position or keeping it open. We might adjust the levels in the “additional instruments” without adjusting the levels in the “main instruments”, which will simply mean that we have improved our estimation of these levels, not that we changed our outlook on the markets. We are already working on a tool that would update these levels on a daily basis for the most popular ETFs, ETNs and individual mining stocks.
Our preferred ways to invest in and to trade gold along with the reasoning can be found in the how to buy gold section. Additionally, our preferred ETFs and ETNs can be found in our Gold & Silver ETF Ranking.
As always, we'll keep you - our subscribers - updated should our views on the market change. We will continue to send out Gold & Silver Trading Alerts on each trading day and we will send additional Alerts whenever appropriate.
The trading position presented above is the netted version of positions based on subjective signals (opinion) from your Editor, and the Tools and Indicators.
As a reminder, Gold & Silver Trading Alerts are posted before or on each trading day (we usually post them before the opening bell, but we don't promise doing that each day). If there's anything urgent, we will send you an additional small alert before posting the main one.
=====
Latest Free Trading Alerts:
Gold lost almost $120 over the week. What is the reason for that decline and what does it mean for the gold market?
What’s Next for Gold after Election?
=====
Hand-picked precious-metals-related links:
UPDATE 1-Soros dissolves SPDR Gold trust shares in Q3, Paulson stays in
Soros More Than Doubles Stake in Barrick Gold as Shares Drop
=====
In other news:
Empire State Manufacturing Index Rises To 1.5 In November
October Retail Sales Beat Expectations
China just let its currency hit lows not seen since the financial crisis
Mark Carney: central banks not to blame for rising inequality
India’s rupee restrictions are boosting demand for bitcoin
=====
Thank you.
Sincerely,
Przemyslaw Radomski, CFA
Founder, Editor-in-chief, Gold & Silver Fund Manager
Gold & Silver Trading Alerts
Forex Trading Alerts
Oil Investment Updates
Oil Trading Alerts

