

Briefly: In our opinion, speculative long (full) positions in gold, silver and mining stocks are justified from the risk/reward perspective.
The big decline in the precious metals appears to already be underway (even though we are in a short-term corrective upswing) and it seems that gold will move much lower in the coming months even though it’s likely to move higher in the coming days. The big decline remains to be the most important development for gold and silver investors. Why? Because this decline’s end is likely to present the ultimate buying opportunity for precious metals and for mining stocks.
Before elaborating on this all-important issue, let’s briefly discuss the current events. The USD Index rallied yesterday and it moved higher also today, reaching its March 2016 high. We previously wrote that it was possible that we would see something like that and we also wrote that it didn’t really matter, as metals and miners were not likely to respond to an additional rally at that time (before a corrective rally). That’s exactly what (hadn’t) happened – metals and miners moved only a little lower yesterday and they are almost no changes today. This means that the precious metals sector continues to show strength relative to the USD Index and thus a rally in the former is still likely and it seems that our profits on long positions will become bigger shortly.
Having said that, let’s move to the most important issue of today’s alert.
We discussed the final bottom target for gold in the previous Gold & Silver Trading Alerts and in today’s alert we focus on something even more important – we discuss WHEN gold is likely to bottom.
What may seem odd, today’s alert will not feature any gold, silver or mining stocks charts as the key detail is not visible on any of them, but on a quite different chart – the one featuring the past two decades of the USD Index. Why? Because, in a globalized economy and interconnected financial markets, no asset can move totally independently from other ones – and this is especially the case with gold and the USD Index during major moves. In most cases (we discuss the exception later in today’s alert), when the USD plunges a lot, gold is likely to rally a lot and when the USD soars, gold is likely to decline substantially. That’s likely to change in the final stage of the precious metals bull market, but it doesn’t seem we are at this point yet.
Therefore, the million-dollar question can be asked differently: when is the USD Index likely to form a very important top in the coming months?
In our opinion, it’s most likely to happen in January or February 2017, with the second half of January being the most probable target.
Why? Let’s take a look at the chart (charts courtesy of http://stockcharts.com).
We’ve looked at the above chart and analyzed it hundreds (if not thousands) times, but it hadn’t been until this week that we noticed a major analogy that becomes apparent only after connecting a few dots that – individually – may not seem clear at all.
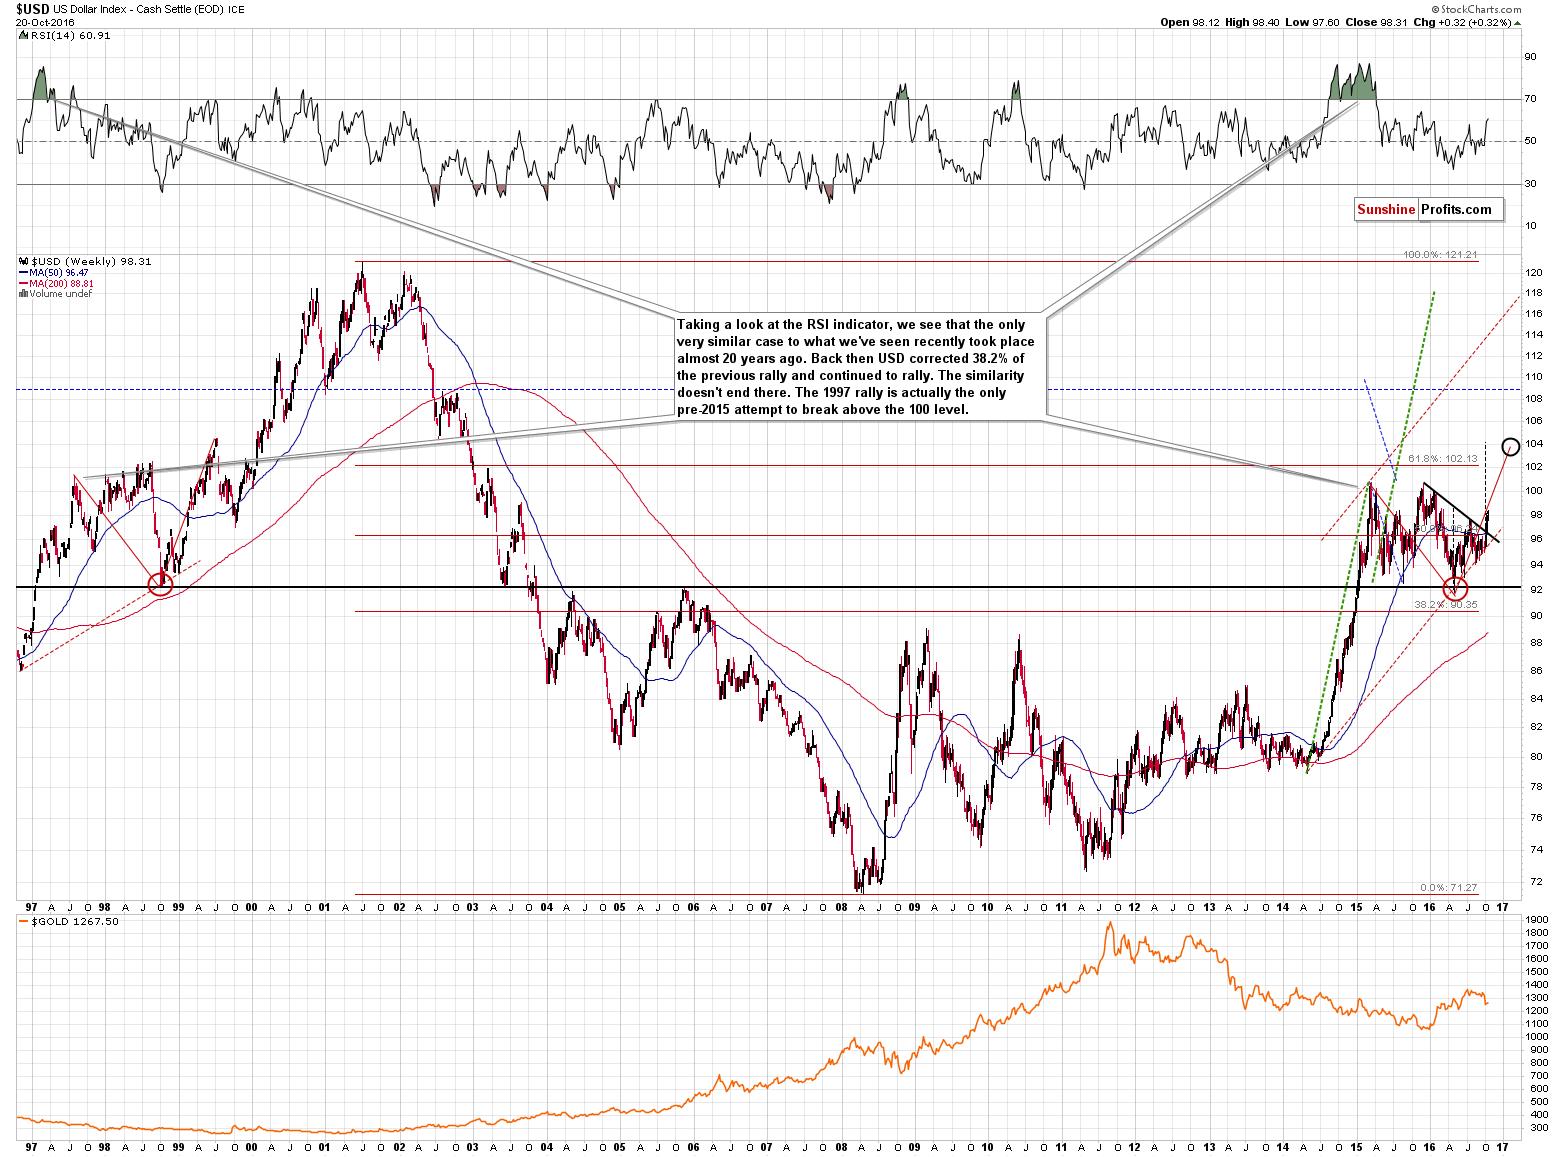
Let’s start with the discovery. What was the key thing that happened in the USD Index in the past few years? It rallied sharply (pushing RSI well above 80) and broke the all-important 100 level – or more precisely – it tried to break above it, but failed and declined substantially. There were other attempts and they failed as well and were followed by an even bigger decline.
Since history rhymes, the big question is: “When did we see something similar?” Almost 20 years ago – in 1997. That’s the only time in the past 20+ years, when the weekly RSI was well over 80 (besides late 2014 and early 2015). Paraphrasing Calvin Candie’s quote from a Tarantino movie: this fact alone is something that should get your curiosity, but the big number of other similarities and how precise the key one is, should get your attention.
After the USD Index initially moved above 100 in August 1997, it declined sharply and it took several months before the next rally begun. The rally started after the USD moved to the 50-week moving average. That’s exactly what we saw in the more recent past – in 2015. What happened next in 1998? The USD tried moving above 100 a few more times, but finally declined substantially and this time the decline took the USD to a new low. Again, the same thing happened in 2015 and 2016. The shape of the rallies and declines was not identical, but it’s nothing to call home about – after all, very different events accompanied both time frames.
Up to this moment, the above analogy can be viewed as interesting, but perhaps not particularly important. We saw the above previously and it was not shocking. What changes everything is an additional analogy – the size (in terms of both the price and time) and steepness of the 1997 – 1998 decline.
We marked the entire decline with a red line and we copied and pasted this line onto the 2015 – 2016 decline. That’s right – the red line that you can see from the 2015 top to the 2016 bottom is not drawn based on these extremes – it’s the exact copy of the 1997 – 1998 decline. However, we bet that you wouldn’t be able to guess that by looking at the chart as the moves are almost identical. The accuracy of the analogy is striking, especially since there are already quite a few similarities between the 2 situations.
Of course, the moves are not 100% identical, but are so close that we can view them as such. The previous decline unfolded over 436 days and the USD declined by 9.12 (8.999%) bottoming very close to the 92 level and the recent decline was 414 days long and the USD declined by 8.83 (8.768%) bottoming very close to the 92 level. Extremely similar.
In light of such significant similarity, we simply can’t ignore the likelihood that what followed the 1998 bottom is going to follow the 2016 bottom as well – especially that so far this similarity is playing out near-perfectly.
Plotting the 1998 – 1999 rally on the current situation provides us with approximately 104 as the next target, but let’s focus one something different. How is the USD Index moving after the bottom?
Back in late 1998, the USD Index moved sharply higher, above the red “target line” and topped close to 97. Then it declined below 94, but the key thing is that it declined below the target line by approximately as much as it had previously rallied above it (in other words, the “target line” rallied through the middle of the short-term decline). The bottom was formed more or less at the rising support line based on the previous important bottoms (rising red dashed line).
What happened earlier this year? Pretty much the same thing – the USD Index moved sharply above the rising red “target line” (the exact copy of the “target line” from 1998 - 1999), then it declined below it by as approximately as much as it had rallied above it previously, and bottomed. The bottom was formed more or less at the rising support line based on the previous important bottoms (rising red, dashed line).
The similarities are indeed extraordinary and the implications are very important. As far as the shape of the upcoming rally (the way the USD gets to its target) is concerned, we don’t have to see identical performance, just as the way in which the USD tried to move above 100 in 1998 wasn’t very similar to the way it tried to move above the same level in late 2015 and early 2016.
Still, the rally is very likely to end in a similar way to what we saw back in 1999 in terms of length and the size of the rally. So, when and how high is the USD Index likely to move?
At the first sight we see that the target is at approximately the 104 level. More detailed calculations:
USD rallied by 12.28 (13.32%) from the 1998 bottom to the 1999 high (104.5). If it rallies by the same amount from the 2016 bottom, we get 104.16 as the target and if it rallies by the same amount percentage-wise, we get 104.11 as the target. However, since the recent decline was not as big as the previous one (it was 96.8% of the 1997 – 1998 decline), we might expect the following rally to be smaller as well. Applying the above percentage to the above methodology provides us with 103.77 and 103.73 as targets.
Overall, we end up with what we see on the chart – the USD Index is likely to for a major top close to the 104 level.
As far as time and the WHEN question are concerned, we saw the bottom on May 3, 2016 and adding 269 days to this date (that’s how long the USD declined from the 1997 top to the 1998 bottom) gives us the time target of January 27, 2017. However, since the recent decline took a bit less time than the previous one (95% of the previous decline’s time), we might expect the following rally to take less time as well. Applying the above percentage to the above methodology provides us with January 13, 2017 as the target date.
Moving back to the issue of the 104 level as the target – there is also another very important technique that points to it. It’s the target based on the big reverse head-and-shoulders formation that started to form in late 2015 and was completed just a few weeks ago. The declining black line is the neck level of the formation and the breakout above it is now clear even from the very long-term perspective. The move back to it is still quite possible, but the implications are bullish for the following months nonetheless.
The size of the “head” in the head-and-shoulders and reverse-head-and-shoulders patterns is the size of the rally that’s likely to follow. We already saw the breakout (at about 96) so we can use this technique. We marked the size of the “head” and the target based on it with vertical, black, dashed lines. As discussed earlier, this technique points to 104 as the next major target.
Given the likelihood that we’ll see a big rally in the USD Index in the coming months, there is a very good possibility that we’ll see gold at new lows. It seems that we still have time to prepare for the ultimate buying opportunity in gold, silver and mining stocks, but this time is slowly running out.
So, will gold continue to plunge if the USD continues to rally, like it did in 1999 – 2001? Not necessarily. If could very well be the case that prolonged strength in the USD Index will not really be due to the inherent strength of the USD (or the U.S. economy), but due to weakness in the euro (if the latter continues to exist, that is) and in other major currencies. If this is the case, gold is likely to rally due to the demand from these other countries. Besides, the self-similar patterns are generally most useful for near-term price movements (it’s relative what is near term – in case of a multi-year analogy, several months are indeed near term) and not so much for price moves that extend far into the future. Consequently, the discussed analogy has important implications for the next several months, but not necessarily for the next few years. The USD Index could continue to rally, but not necessarily due to the self-similar pattern and not necessarily in tune with it (beyond the next several months).
Summing up, while the short-term indications for the precious metals sector remain bullish, the medium-term trend remains bearish and it seems that the final bottom will be formed in the first months of 2017, with the second half of January 2017 being the most probable time frame.
Meanwhile, it seems that the profits on our long positions will increase further before the trade is over and the downtrend resumes.
The above estimations are based on the information that we have available today (Oct. 21, 2016). As always – we will keep you – our subscribers – updated.
To summarize:
Trading capital (supplementary part of the portfolio; our opinion): Long positions (100% of the full position) in gold, silver and mining stocks are justified from the risk/reward perspective with the following stop-loss orders and initial target price levels:
- Gold: initial target price: $1,295; stop-loss: $1,237, initial target price for the UGLD ETN: $12.47; stop-loss for the UGLD ETN $10.23
- Silver: initial target price: $18.45; stop-loss: $16.88, initial target price for the USLV ETN: $19.78; stop-loss for the USLV ETN $14.67
- Mining stocks (price levels for the GDX ETF): initial target price: $25.77; stop-loss: $21.77, initial target price for the NUGT ETF: $17.38; stop-loss for the NUGT ETF $9.77
In case one wants to bet on junior mining stocks' prices (we do not suggest doing so – we think senior mining stocks are more predictable in the case of short-term trades – if one wants to do it anyway, we provide the details), here are the stop-loss details and initial target prices:
- GDXJ ETF: initial target price: $43.87; stop-loss: $35.86
- JNUG ETF: initial target price: $15.87; stop-loss: $8.78
Long-term capital (core part of the portfolio; our opinion): No positions
Insurance capital (core part of the portfolio; our opinion): Full position
Plus, you might want to read why our stop-loss orders are usually relatively far from the current price.
Please note that a full position doesn’t mean using all of the capital for a given trade. You will find details on our thoughts on gold portfolio structuring in the Key Insights section on our website.
As a reminder – “initial target price” means exactly that – an “initial” one, it’s not a price level at which we suggest closing positions. If this becomes the case (like it did in the previous trade) we will refer to these levels as levels of exit orders (exactly as we’ve done previously). Stop-loss levels, however, are naturally not “initial”, but something that, in our opinion, might be entered as an order.
Since it is impossible to synchronize target prices and stop-loss levels for all the ETFs and ETNs with the main markets that we provide these levels for (gold, silver and mining stocks – the GDX ETF), the stop-loss levels and target prices for other ETNs and ETF (among other: UGLD, DGLD, USLV, DSLV, NUGT, DUST, JNUG, JDST) are provided as supplementary, and not as “final”. This means that if a stop-loss or a target level is reached for any of the “additional instruments” (DGLD for instance), but not for the “main instrument” (gold in this case), we will view positions in both gold and DGLD as still open and the stop-loss for DGLD would have to be moved lower. On the other hand, if gold moves to a stop-loss level but DGLD doesn’t, then we will view both positions (in gold and DGLD) as closed. In other words, since it’s not possible to be 100% certain that each related instrument moves to a given level when the underlying instrument does, we can’t provide levels that would be binding. The levels that we do provide are our best estimate of the levels that will correspond to the levels in the underlying assets, but it will be the underlying assets that one will need to focus on regarding the signs pointing to closing a given position or keeping it open. We might adjust the levels in the “additional instruments” without adjusting the levels in the “main instruments”, which will simply mean that we have improved our estimation of these levels, not that we changed our outlook on the markets. We are already working on a tool that would update these levels on a daily basis for the most popular ETFs, ETNs and individual mining stocks.
Our preferred ways to invest in and to trade gold along with the reasoning can be found in the how to buy gold section. Additionally, our preferred ETFs and ETNs can be found in our Gold & Silver ETF Ranking.
As always, we'll keep you - our subscribers - updated should our views on the market change. We will continue to send out Gold & Silver Trading Alerts on each trading day and we will send additional Alerts whenever appropriate.
The trading position presented above is the netted version of positions based on subjective signals (opinion) from your Editor, and the Tools and Indicators.
As a reminder, Gold & Silver Trading Alerts are posted before or on each trading day (we usually post them before the opening bell, but we don't promise doing that each day). If there's anything urgent, we will send you an additional small alert before posting the main one.
=====
Latest Free Trading Alerts:
The chorus of voices demanding helicopter money is growing. How would it work? We invite you to read our today’s article presenting the differences between helicopter money and quantitative easing and find out how it could affect the gold market.
Quantitative Easing, Helicopter Money and Gold
The Consumer Price Index increased 0.3 percent last month. What does it imply for the gold market?
=====
Hand-picked precious-metals-related links:
Chinese buying, India's festival season prop up gold demand in Asia
Morgan Stanley joins LBMA Silver fix
GST Council eyes 16% levy on gold jewellery and 4% on bullion
Strong car sales “a statistical illusion” for platinum price
=====
In other news:
US stock futures fall as Street eyes earnings, Fed speakers
Euro Falls to Lowest Since March as Draghi Eases Nerves on QE
IMF assessment hints at internal struggles
Soaring house prices in Sweden an unnecessary reality: Analyst
Greek minister: We’ve done our part. Now it’s time to discuss debt relief
EU extends LSE-Deutsche Boerse merger review until March 6
=====
Thank you.
Sincerely,
Przemyslaw Radomski, CFA
Founder, Editor-in-chief, Gold & Silver Fund Manager
Gold & Silver Trading Alerts
Forex Trading Alerts
Oil Investment Updates
Oil Trading Alerts

