

Briefly: In our opinion, (full) speculative short positions in gold, silver and mining stocks are justified from the risk/reward perspective.
History tends to repeat itself and the more similarities to a past pattern we have, the bigger likelihood that it will continue to repeat. The day-to-date price swings of silver may seem erratic, but from a broader point of view, they are repeating – to a great extent – the same pattern that we saw in the past. The most interesting thing is what followed that past pattern.
Let’s take a look at the charts (charts courtesy of http://stockcharts.com).
Before discussing the latest developments, let’s quote what we wrote about silver’s projected price path on October 7:
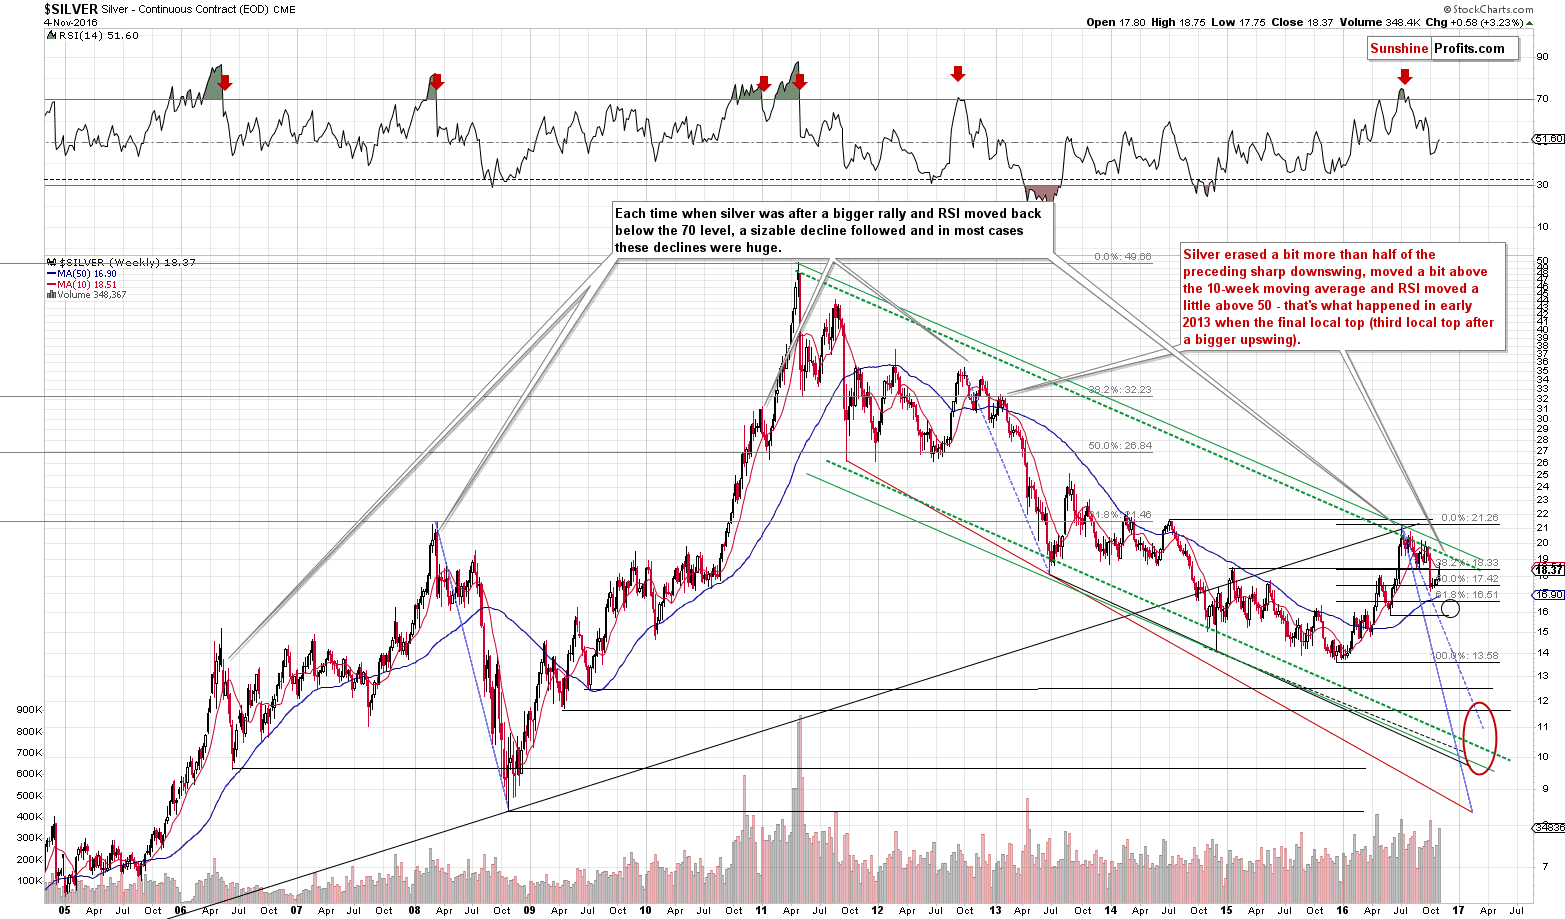
(…) We can now see that comparing the current downswing to the previous medium-term ones does not have bullish implications.
The important thing about this decline is where it started – it started when silver topped with the RSI above 70. That’s not something that happens often and consequently it’s critical to check what tends to happen next once such a situation materializes. Long story short – silver declined after such cases, but the most important thing is that after the $50 top we saw only one similar case – the 2012 top and the 2012 – 2013 decline. Actually, we wrote about the similarity of these declines a few times in the past months. So far the analogy holds.
The late 2012 top and the 2016 top were followed by some sideways trading, then an initial small decline, then a rally close to the previous high. The sharp decline followed in both cases. In the past, silver was only one small (smaller than the previous ones) correction away from the big slide.
When and where did silver bottom in late 2012 before the final small correction? After 14 – 16 weeks (depending on how we define to bottom – weekly closing price or the intra-day price), below the 50-week moving average and with the RSI at about 40 (…).
Right now silver is in the 13th week of the decline, still above the 50-week moving average and the RSI is at 44. Silver appears to be relatively close to the bottom (the majority of the decline seems to be behind us) but may not be at it just yet.
We wrote the above after silver ended the session at $17.34. That was indeed the final bottom in terms of the daily closing prices and the final bottom in the case of intra-day lows formed on the following day.
What happened next? The self-similar pattern was upheld. Silver rallied in both late 2012 (and early 2013) and in the past few weeks. Since the very similar pattern remains in place, what happened next in the past is a likely roadmap for what lies ahead.
Back in early 2013, silver topped after:
- Moving above its 10-week moving average.
- Correcting a bit more than half of the preceding short-term downswing (Back then it corrected 61.8% of the late-2012 decline, and now silver has corrected either 50% of the rally or 61.8%, depending on which moment we use as the starting point of the decline. Using silver’s early-September high as the starting point, we get the 50% retracement, and using silver’s September 30 intra-day high as the starting point, we get the 61.8% retracement).
- The RSI moved a bit above the 50 level.
This time, we have already seen these signals and consequently, silver appears to be ready for the next part of the pattern – a huge decline.
The very characteristic trait of the 2013 decline in silver is that it had very few upswings (and rather insignificant from the long-term point of view) before it was really over – several months later. This could be the case also this time, but doesn’t have to – the self-similar patterns are generally getting less reliable when one is trying to make a more long-term-oriented prediction (the closer the prediction date or the price path to the current moment, the greater the impact of the pattern is likely to be).
Overall, the implications are very bearish for the coming weeks and months.
There’s not much to comment on in case of silver’s short-term chart as it didn’t move much on Friday, but there’s something else that’s worth discussing.
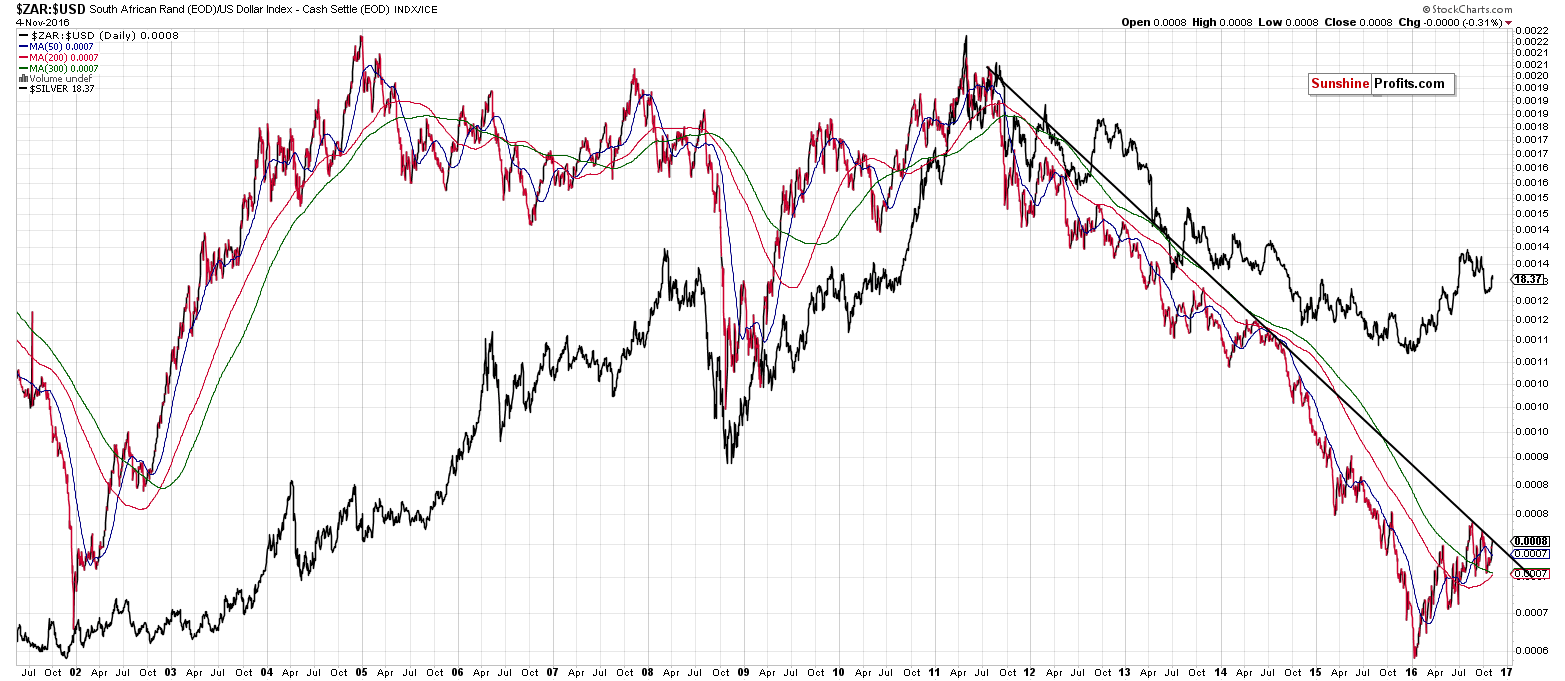
Some time ago we featured the South African Rand to USD Index ratio – it’s very highly correlated with silver, so what’s bearish for the ratio is quite likely to be bearish for silver as well. When we discussed this phenomenon previously, we argued that silver was at a local top or very close to it as the ratio moved to its declining, long-term resistance line and was about to reverse based on it. It was indeed what we saw in the following weeks. Why are we mentioning this today? Because that’s what’s happening once again – the ratio moved to the declining resistance line and – since there was no breakout – the implications are bearish for both the ratio and for the white metal.
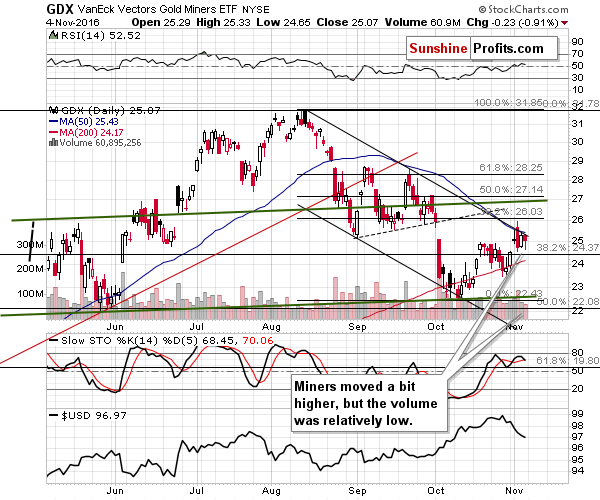
Meanwhile, mining stocks declined on Friday, while gold moved a few dollars higher, which is a bearish indication. We can say the same about the miners’ inability to break above the declining trend channel (and stay there).
In terms of relative valuations, we have an interesting observation to discuss. Taking the last 2 weeks into account, gold moved $1,267.70 to $1,304.50 ($36.80 higher) while the HUI Index (more appropriate for comparison than GDX as the former only includes gold stocks) moved from 215.96 to 217.39 (only 1.43 higher). That’s a very clear sign of underperformance, which has negative implications for the following weeks.
As far as gold is concerned, we received a question about the MACD and PMO indicators and their recent buy signals (whether they invalidate the bearish outlook).
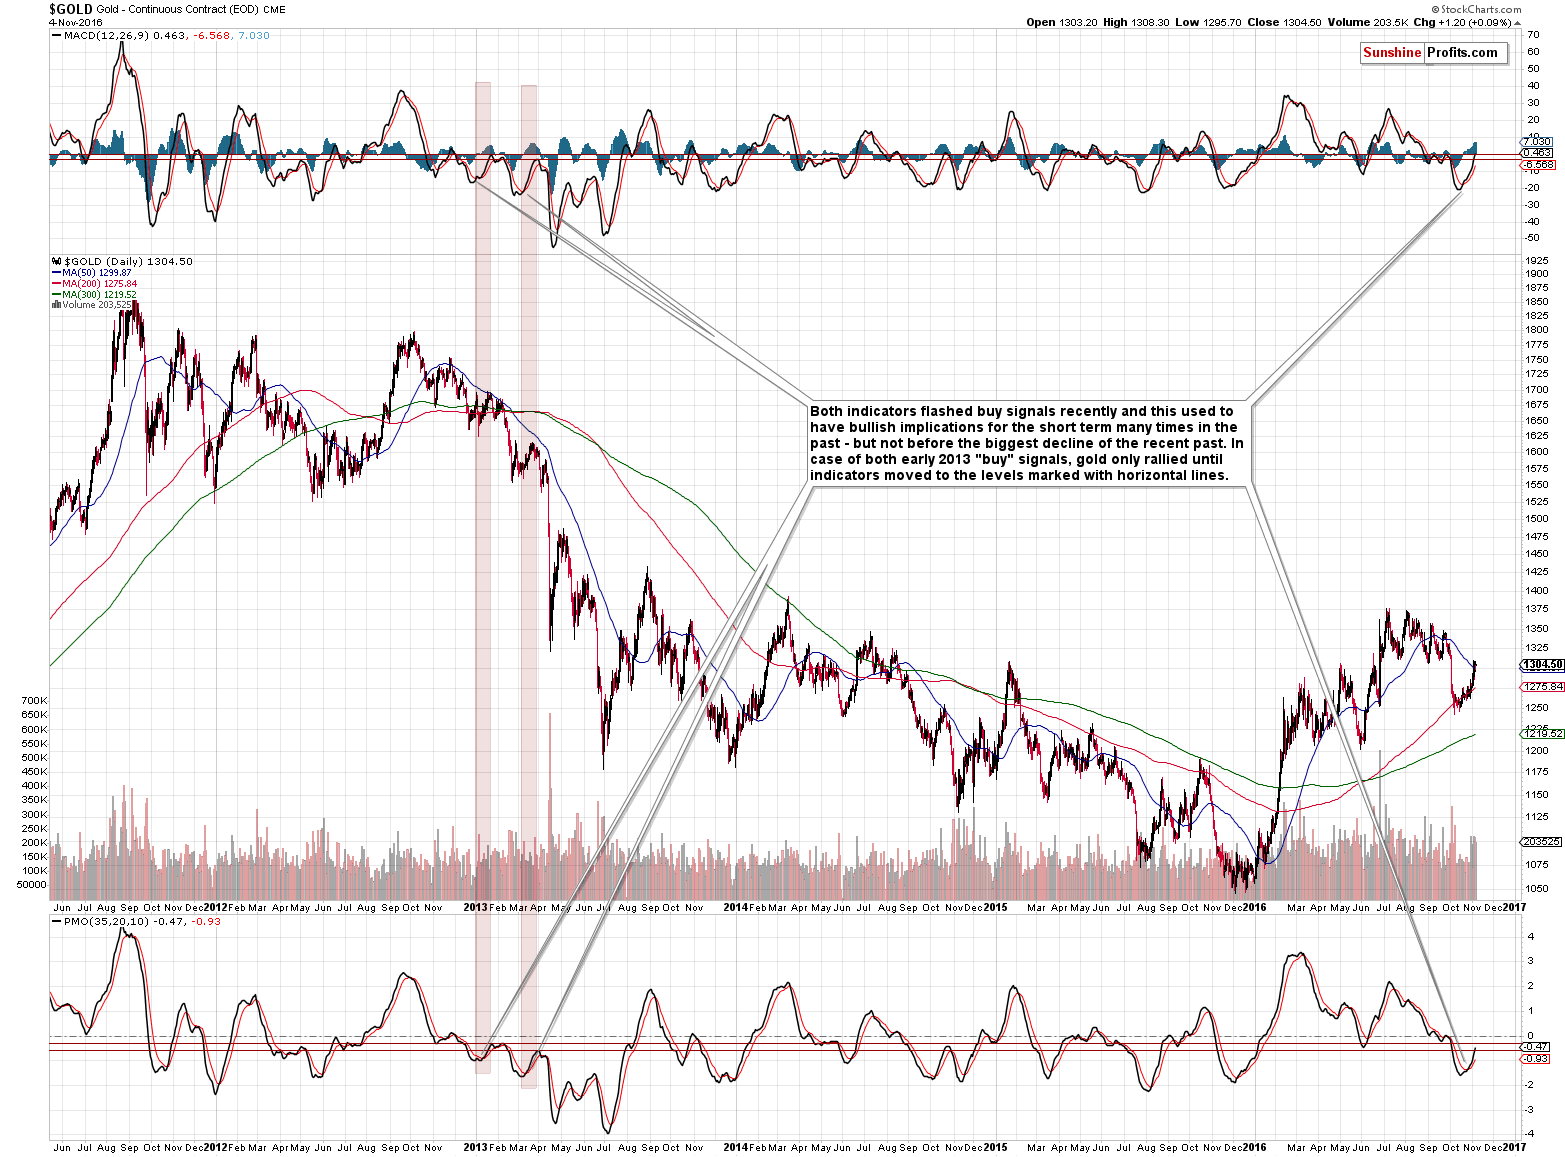
In short, they are both useful short-term indicators, but since the current situation is similar to what happened in early 2013, they may work... as in 2013. Back then the buy signals from the MACD and PMO were followed by short-term rallies in gold and themselves, but these rallies were followed by much bigger declines.
We marked the levels to which both indicators rallied in early 2013 with horizontal lines. The MACD indicator is already at the upper of the lines and the PMO is right in the middle thereof. Consequently, in light to the analogy to 2013, it seems that the top in gold is already in or at hand.
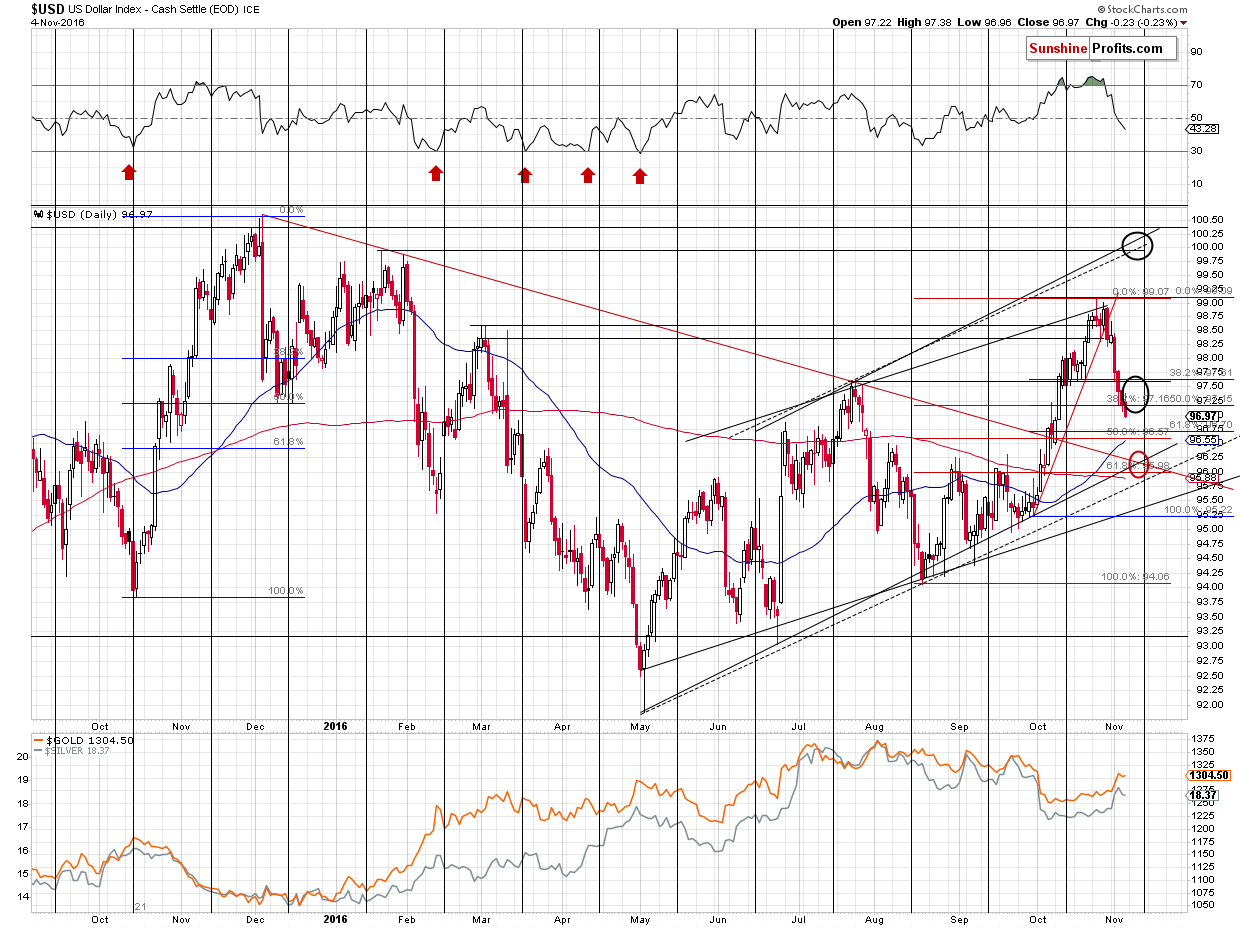
The USD Index declined on Friday, which makes gold’s tiny upswing bearish (the reaction was weak) and a decline in miners even more bearish. Since the reaction to USD’s movement weakened, it doesn’t seem that metals and miners would rally substantially even if the USD’s bottom is not yet in. Speaking of a bottom for the USD Index – it still seems most likely that it’s either in or very close to being in (either at 97 or at 96.50), but if it’s not, then it’s still very unlikely that it would slide below the 96 level and confirm such a breakdown – multiple support levels coincide there.
Again, whether the USD bottomed here or will bottom relatively soon, at lower levels, doesn’t seem to be the key factor for the precious metals market as the link between the USD and PMs appears to have weakened.
Summing up, based on the combination of signs that a bottom in the USD Index is in or close to being in, the outperformance of silver (seen last week) and self-similar pattern in it along with the invalidations of breakouts in the case of gold and mining stocks (and the underperformance of the latter), it seems that the risk to reward ratio continues to favor speculative short positions in gold, silver and mining stocks.
The period before the U.S. elections could be volatile, but based on the combination of the mentioned factors, it still seems that a speculative position is now justified. The polls are close to a tie and they are publicly known, thus there will likely be little surprise just before the election. In the case of the Brexit vote, there was a huge surprise, as Bremain was the very likely outcome and the markets were surprised, to say the least. Investors, who are particularly risk averse, may want to consider limiting the size of the position before the elections, though.
As always, we will keep you – our subscribers – updated.
To summarize:
Trading capital (supplementary part of the portfolio; our opinion): Short positions (100% of the full position) in gold, silver and mining stocks are justified from the risk/reward perspective with the following entry prices, stop-loss orders and initial target price levels:
- Gold: initial target price: $1,006; stop-loss: $1,331, initial target price for the DGLD ETN: $73.19; stop-loss for the DGLD ETN $41.89
- Silver: initial target price: $13.12; stop-loss: $19.23, initial target price for the DSLV ETN: $39.78; stop-loss for the DSLV ETN $18.74
- Mining stocks (price levels for the GDX ETF): initial target price: $9.34; stop-loss: $27.32, initial target price for the DUST ETF: $297; stop-loss for the DUST ETF $27.87
In case one wants to bet on junior mining stocks' prices (we do not suggest doing so – we think senior mining stocks are more predictable in the case of short-term trades – if one wants to do it anyway, we provide the details), here are the stop-loss details and initial target prices:
- GDXJ ETF: initial target price: $14.13; stop-loss: $47.41
- JDST ETF: initial target price: $245; stop-loss: $18.59
Long-term capital (core part of the portfolio; our opinion): No positions
Insurance capital (core part of the portfolio; our opinion): Full position
Plus, you might want to read why our stop-loss orders are usually relatively far from the current price.
Please note that a full position doesn’t mean using all of the capital for a given trade. You will find details on our thoughts on gold portfolio structuring in the Key Insights section on our website.
As a reminder – “initial target price” means exactly that – an “initial” one, it’s not a price level at which we suggest closing positions. If this becomes the case (like it did in the previous trade) we will refer to these levels as levels of exit orders (exactly as we’ve done previously). Stop-loss levels, however, are naturally not “initial”, but something that, in our opinion, might be entered as an order.
Since it is impossible to synchronize target prices and stop-loss levels for all the ETFs and ETNs with the main markets that we provide these levels for (gold, silver and mining stocks – the GDX ETF), the stop-loss levels and target prices for other ETNs and ETF (among other: UGLD, DGLD, USLV, DSLV, NUGT, DUST, JNUG, JDST) are provided as supplementary, and not as “final”. This means that if a stop-loss or a target level is reached for any of the “additional instruments” (DGLD for instance), but not for the “main instrument” (gold in this case), we will view positions in both gold and DGLD as still open and the stop-loss for DGLD would have to be moved lower. On the other hand, if gold moves to a stop-loss level but DGLD doesn’t, then we will view both positions (in gold and DGLD) as closed. In other words, since it’s not possible to be 100% certain that each related instrument moves to a given level when the underlying instrument does, we can’t provide levels that would be binding. The levels that we do provide are our best estimate of the levels that will correspond to the levels in the underlying assets, but it will be the underlying assets that one will need to focus on regarding the signs pointing to closing a given position or keeping it open. We might adjust the levels in the “additional instruments” without adjusting the levels in the “main instruments”, which will simply mean that we have improved our estimation of these levels, not that we changed our outlook on the markets. We are already working on a tool that would update these levels on a daily basis for the most popular ETFs, ETNs and individual mining stocks.
Our preferred ways to invest in and to trade gold along with the reasoning can be found in the how to buy gold section. Additionally, our preferred ETFs and ETNs can be found in our Gold & Silver ETF Ranking.
As always, we'll keep you - our subscribers - updated should our views on the market change. We will continue to send out Gold & Silver Trading Alerts on each trading day and we will send additional Alerts whenever appropriate.
The trading position presented above is the netted version of positions based on subjective signals (opinion) from your Editor, and the Tools and Indicators.
As a reminder, Gold & Silver Trading Alerts are posted before or on each trading day (we usually post them before the opening bell, but we don't promise doing that each day). If there's anything urgent, we will send you an additional small alert before posting the main one.
=====
Latest Free Trading Alerts:
The U.S. economy added 161,000 jobs in October. What does it imply for the Fed policy, presidential elections, and the gold market?
S&P 500 index extended its downtrend on Friday following economic data, quarterly earnings releases. Will it reverse upwards? Or is this just a quick upward correction before another leg down?
=====
Hand-picked precious-metals-related links:
Gold Slumps As Dollar, Stocks Jump After FBI Clears Clinton
Hedge Funds Are Hiding Out in Gold
=====
In other news:
Clinton 3 Points Ahead of Trump in Final Bloomberg National Poll
Obama’s Successor Inherits Bond Market at Epic Turning Point
Bank of Italy says ECB considering extending QE, not tapering it
Update 2-BOJ Policymakers Admit Time Needed To Hit Price Target-Sept Minutes
German banking association calls for extension to Basel IV timetable
OPEC Chief Says Russia on Board With Deal to Limit Output
=====
Thank you.
Sincerely,
Przemyslaw Radomski, CFA
Founder, Editor-in-chief, Gold & Silver Fund Manager
Gold & Silver Trading Alerts
Forex Trading Alerts
Oil Investment Updates
Oil Trading Alerts

