

Briefly: No speculative positions in gold, silver and mining stocks are justified from the risk/reward perspective. We are expecting to be back in the short positions relatively soon, but not yet at this time.
We had been expecting the end of last week to be volatile and we carefully took profits off the table from our short positions early on Thursday and precious metals certainly turned out to be volatile. The employment numbers shook the market and resulted in multiple technical developments. The most important thereof seems to be a huge, weekly reversal in mining stocks, but let’s not forget about silver’s rally as well. What can we make of all this, especially that it happened without a corresponding slide in the USD Index?
Let’s take a look at the charts to find out, starting with the latter (charts courtesy of http://stockcharts.com).
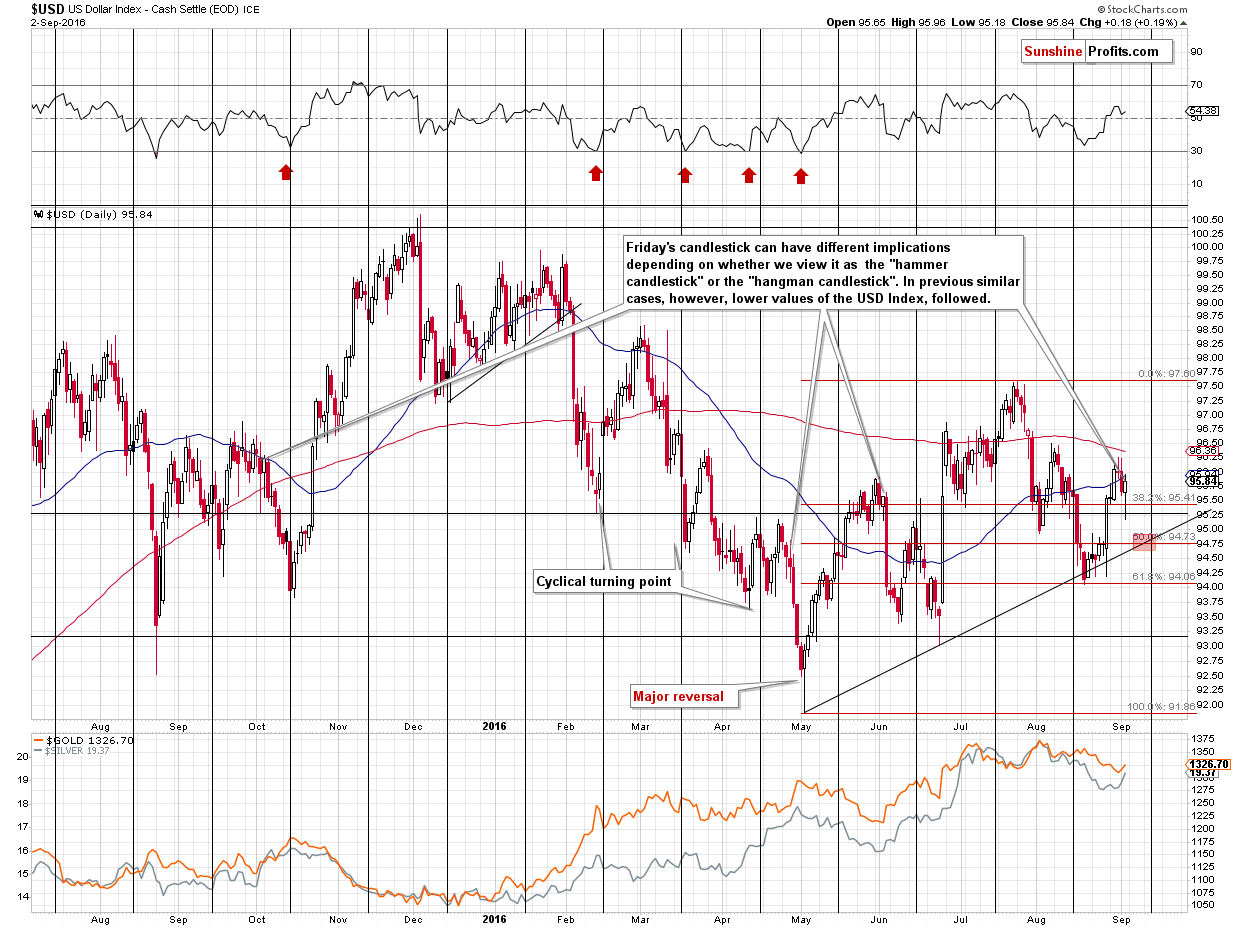
We saw a daily reversal, which supposedly has bullish implications. However, taking a closer look at the above chart shows that it doesn’t and some might even view Friday’s price action as bearish. Why? As it is usually the case, the context is everything and taking the signal at its face value could be misleading.
The reversal, in which the price moves lower at first, but ends the session cancelling most of the declines (or even ends in appreciation) is called a “hammer”, but only if it is preceded by a decline. If it is preceded by a rally, it’s called a “hangman” candlestick and it has bearish implications, not bullish ones. So, one question that one has to answer before assessing the implications is whether the preceding move was up or down. It may seem obvious, but it isn’t – the USD declined on Thursday and it didn’t really rally on Wednesday, so one might view the reversal as bullish. However, the size of the late-August rally is much more significant than Thursday’s daily downswing, so after all, it seems that the entire move that preceded Friday’s session was an upswing. Therefore, the implications are bearish, but not extremely so, as it is somewhat unclear what the preceding move really was.
The second – and more important – question that one has to reply to is whether similar sessions (in a similar context) were followed by rallies, declines, or both. As we marked on the chart, similar sessions were seen a few times in the very early parts of declines. The above confirms our previous observation – that the implications of Friday’s session are not bullish, but bearish.
How low can the USD Index go? Quite likely to the combination of significant support levels: the 50% Fibonacci retracement level and the rising support line. Moreover, assuming the pace of the decline will be similar to the previous declines, the mentioned support is likely to be reached close to the cyclical turning point, which makes the reversal more likely.
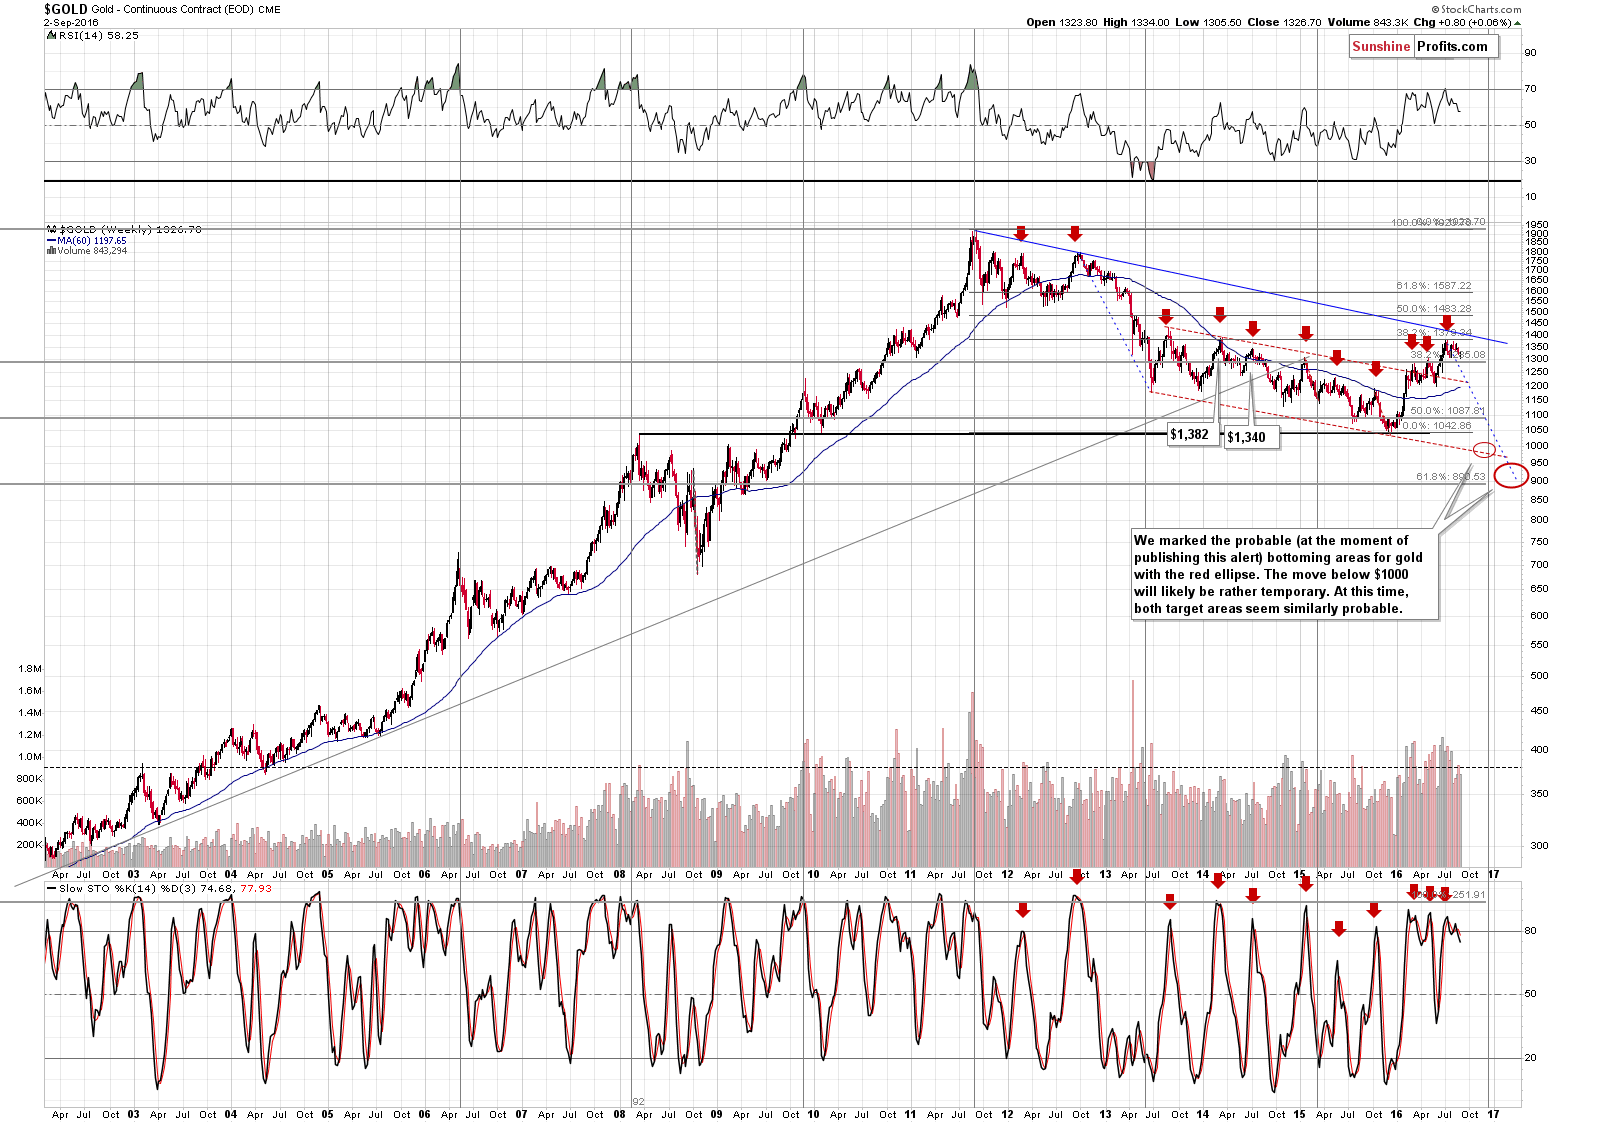
Moving on to gold, from the long-term perspective, we saw a weekly reversal, but the volume accompanying it wasn’t huge, so it’s not extremely bullish – only a little so. The sell signal from the weekly Stochastic indicator was not invalidated based on last week’s moves and the main trend seems to remain down.
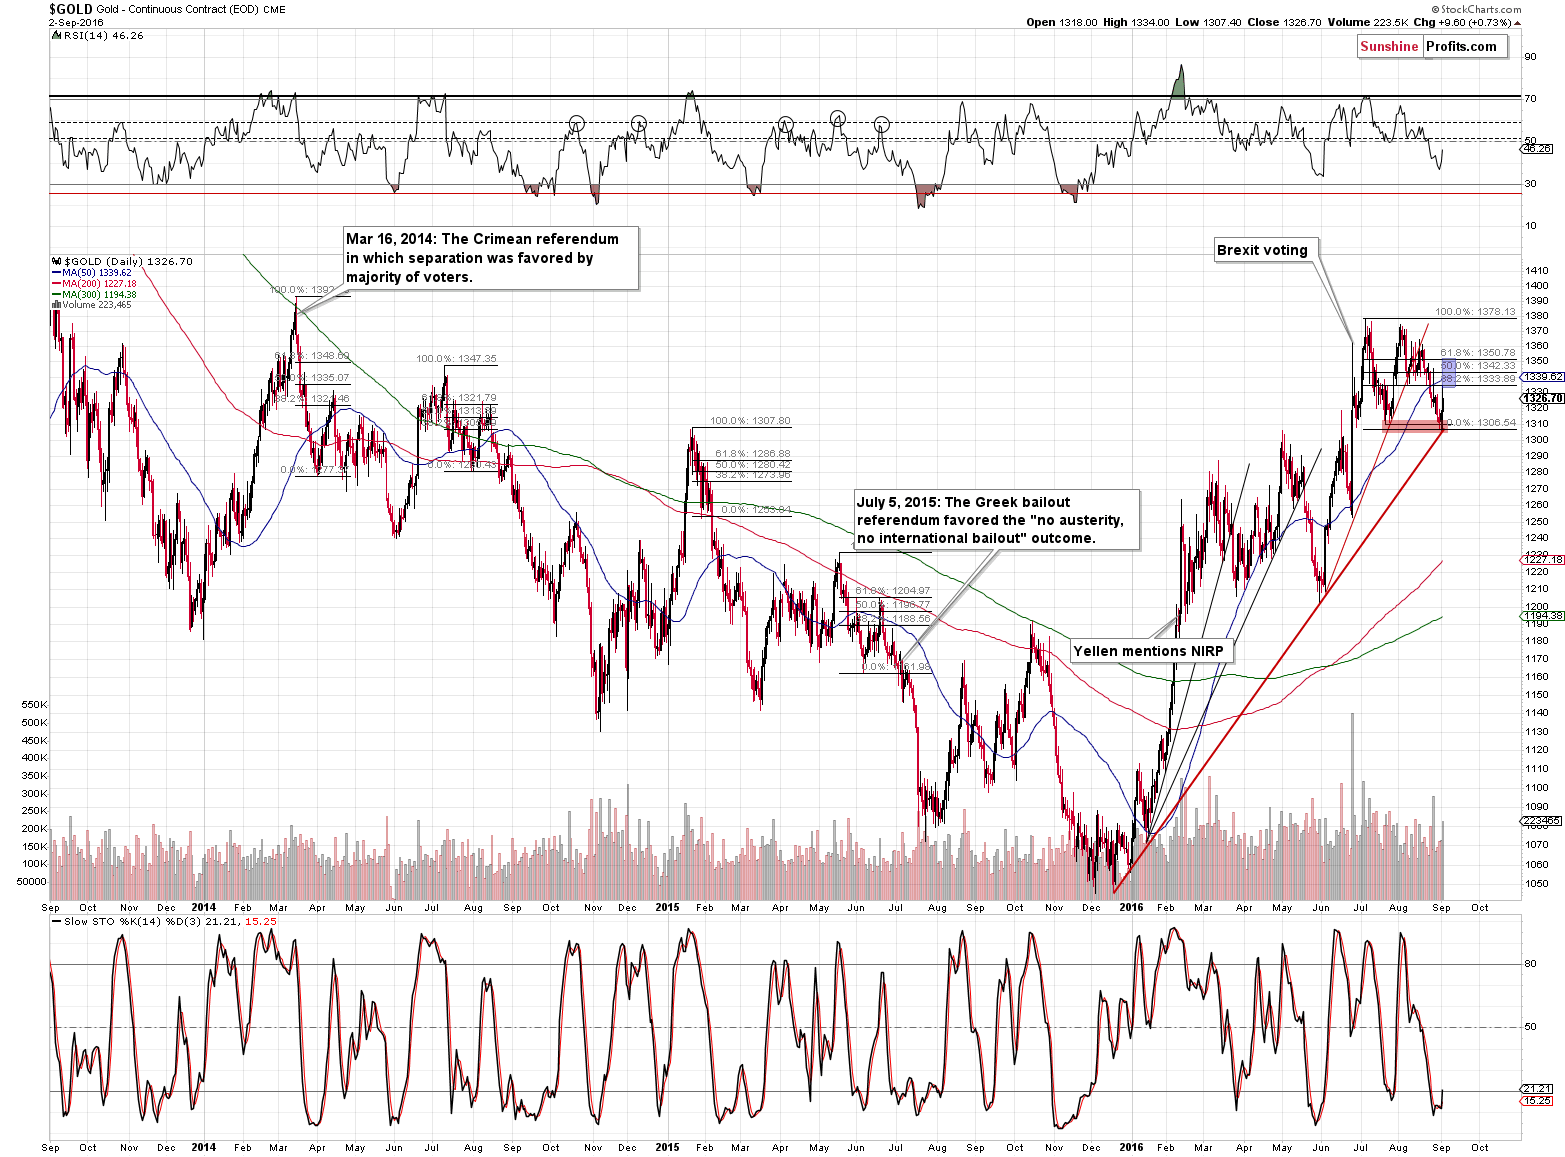
On the short-term chart, we have more interesting details. Gold rallied strongly on Friday and the volume was just as strong. The implications for the short term (!) are bullish. Gold moved to the 38.2% Fibonacci retracement (based on the July-September decline) and then gave away some of the gains, but given the size of the volume, it seems that the rally is not over yet. If the trend is down and the rally doesn’t seem to be over yet, then the natural question here is: “So how high is gold likely to rally before turning south again?”
Our reply is that gold is quite likely to move to the 50% or 61.8% Fibonacci retracement before declining again, just like it was the case in similar cases. The 50-day moving average is also a factor as it’s what stopped the decline back in June and it’s currently as bit below the 50% retracement. Which of these levels will finally stop the rally is unknown, but knowing the area in which gold is likely to top allows us to pay extra attention to reversal signs once gold is there.
There’s one more thing that we would like to discuss before moving on to the following chart and that is: “What actually caused gold to rally this year?”
Of course, the point of technical analysis is not to reply to the “why” question, but to take what we have without knowing the reply, use it, and profit on it. However, discussing the above should be beneficial in terms of detecting in what kind of big trend gold is right now.
To make a long story short, there were basically two major events that triggered huge daily rallies in gold this year. These events were likely responsible for a large part of the follow-up action as well but for the sake of being conservative, let’s assume that it was only the immediate daily reaction that we’ll take into account.
These events are:
- Reaction to Yellen’s remarks on NIRP (as a reminder: Yellen said that the Fed can’t rule out negative interest rates in the future and markets viewed this as an indication that it is something likely, which in reality is the only way Yellen could have replied – they can’t rule out any tool in advance, so she had to reply otherwise).
- Unexpected outcome of the Brexit vote (up to this day, the vote hasn’t resulted in basically anything – the UK is still in the EU).
The markets seem to have overreacted to these events, which pushed gold’s price higher (and – naturally – the rest of the precious metals market followed).
These two rather more emotional than logical moves accounted for a large part of gold’s upswing earlier this year, which – in opinion of many investors and analysts – is something that proves (!) that gold is in a major uptrend right now. However, if we view these two moves as accidental and choose not to put too much emphasis on them and consequently take them out of the current price of gold, will we the seemingly bullish implications remain in place? The individual replies depend on each investor’s and analyst’s analytical techniques, but let’s check where would the price of gold be today, if the two above-mentioned moves were removed.
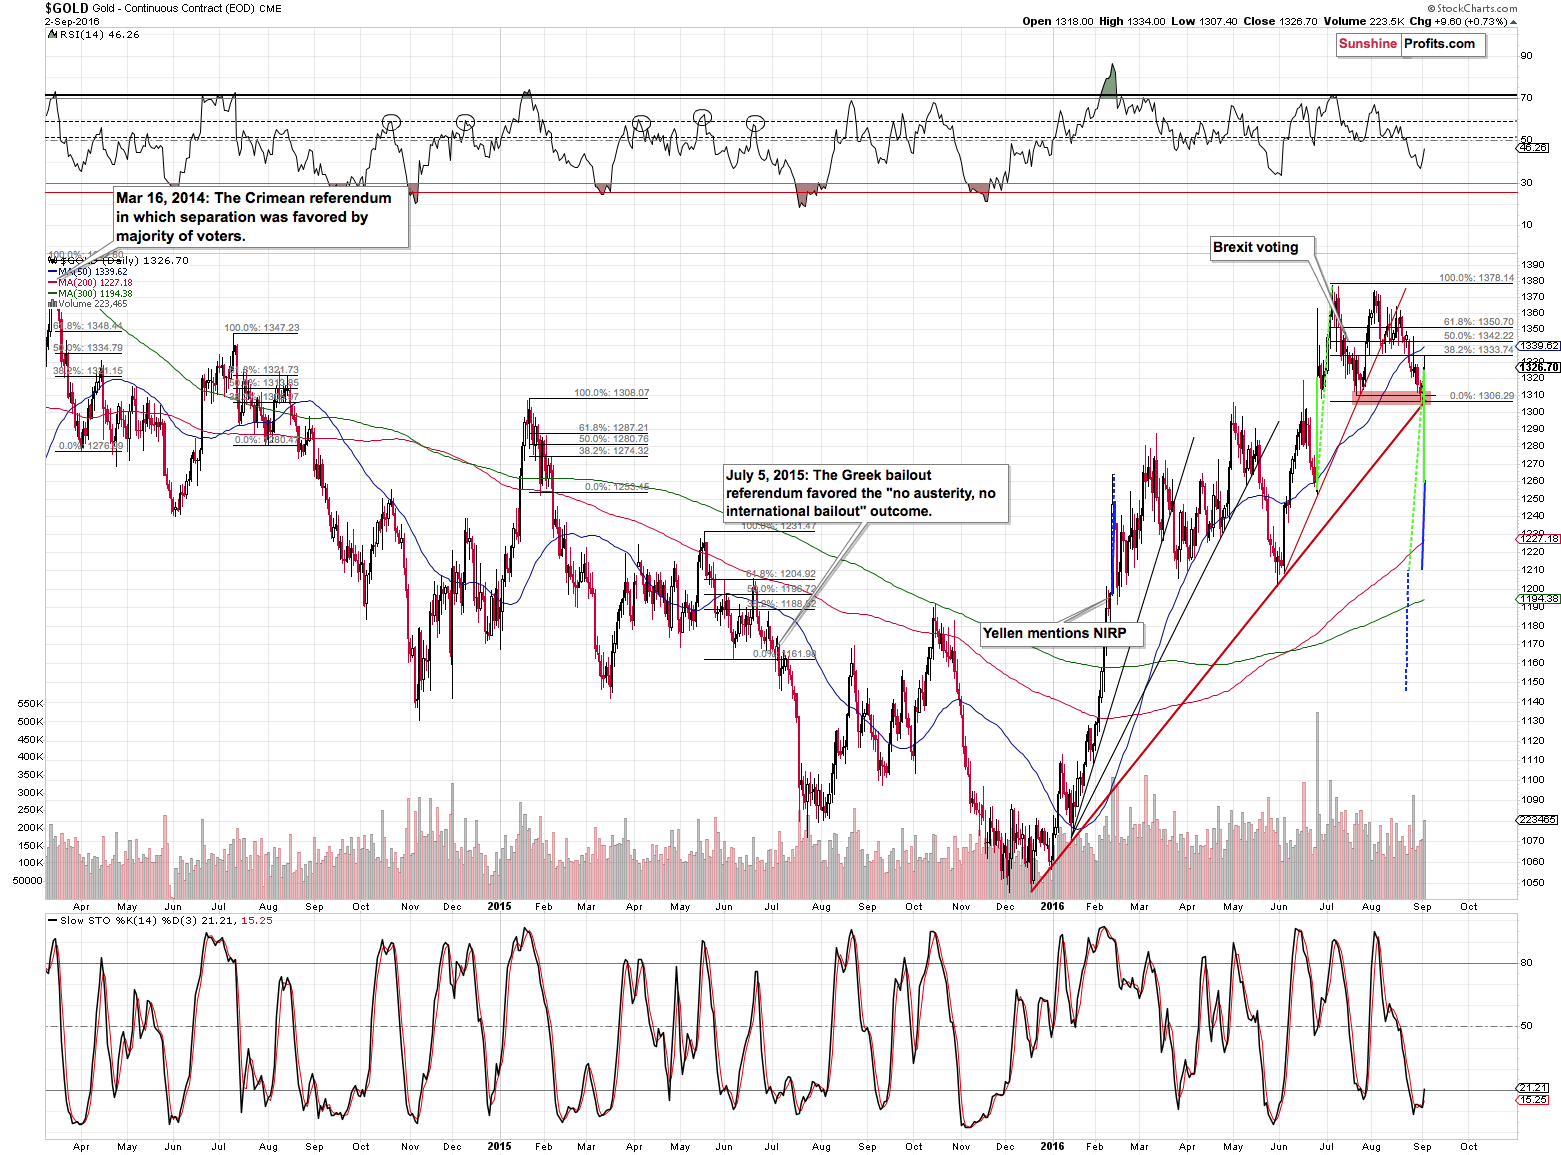
The solid lines (blue and green) represent the daily moves in terms of closing prices and the dashed lines represent the daily moves in terms of the open – intra-day high moves. So, if everything else was exactly like it transpired, but these two sessions were taken out of the picture, where would the price of gold be today?
After removing both rallies (deducting the price moves) from the current price of gold (Friday’s closing price), we are left with about $1,145 in case of the intra-day analogy and with about $1,210 in case of the analogy based on closing prices.
That’s still well above the 2015 low, but the most important thing is that both levels are relatively close to the previous local highs. In case of the intra-day analogy, gold would even be below the October 2015 high (the lowest of local highs) and gold would be in a clear downtrend (having invalidated the breakout above this high). In case of the higher of the hypothetical price levels ($1,210), we would have gold below the May 2015 high and only about $20 above the October 2015 high – still close to the lowest of the local highs.
The point is that if only two sessions were taken out of the picture (and both of them seem to be an overreaction to what actually happened and how much it changed), the entire “we are already in a major rally in gold” point of view becomes doubtful.
What does it all mean? The above is just a hypothetical situation – a thought experiment, so it’s not a direct buy or sell signal. It does, however, very strongly suggest that all that’s been written about gold’s “imminent” rally in the following months should be taken with a healthy dose of skepticism, to say the least. The fundamental situation in gold is favorable, but let’s not forget that this has been the case for years and it hasn’t stopped gold from declining hundreds of dollars in the past few years. Consequently, while gold is likely to be much higher than it is right now in the coming years, it may not be higher in a few months.
Still, gold is very likely to rally here in the short term, right?
No. Possible – yes, likely – could be, but saying that is very likely is an exaggeration and the above chart is one of the reasons why.
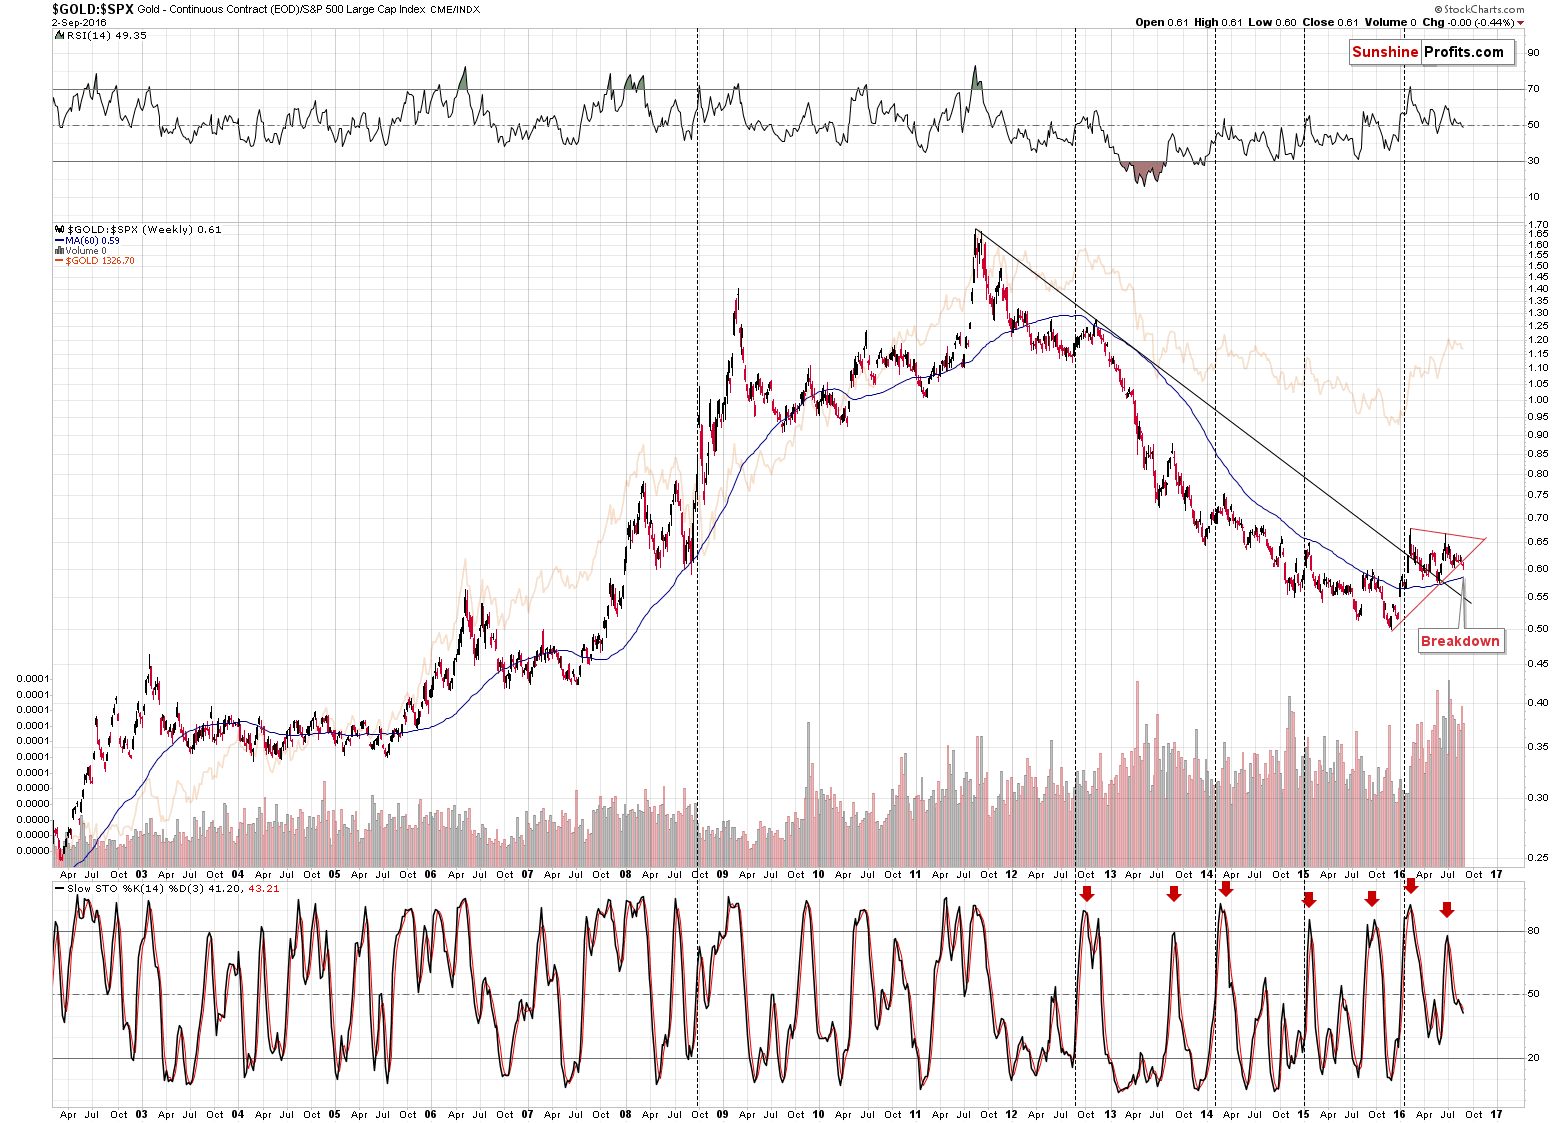
In case of the gold to S&P 500 ratio (unlike what we saw in gold), we saw a breakdown below the rising support line and this breakdown was not invalidated based on what happened on Friday. Consequently, the breakdown is seen even in the case of weekly closing prices, which has bearish implications.
What about silver?
We previously commented on silver’s performance in the following way:
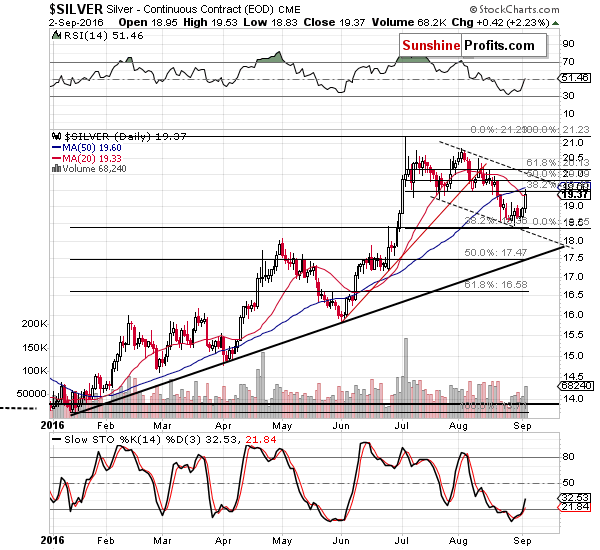
Silver moved higher, but it remains within the small trading range and the implications are next to nothing. Let’s keep in mind that silver tends to outperform on a very short-term basis right before local tops and at them, so this will be one of the confirmations that we will be looking for in the coming days.
The white metal rallied quite visibly, but so did gold, so the outperformance factor has not been clearly visible so far. Silver moved to the 50- and 20-day moving averages, which could keep the rally in check (especially given the proximity of the 38.2% Fibonacci retracement), but if the USD declines substantially, it will be unlikely for silver to stay at these levels – an additional rally seems more likely. The next – and more likely final – resistance for silver is at about the $20 - $20.15 range. That’s where we have the upper border of the declining trend channel and the 61.8% Fibonacci retracement.
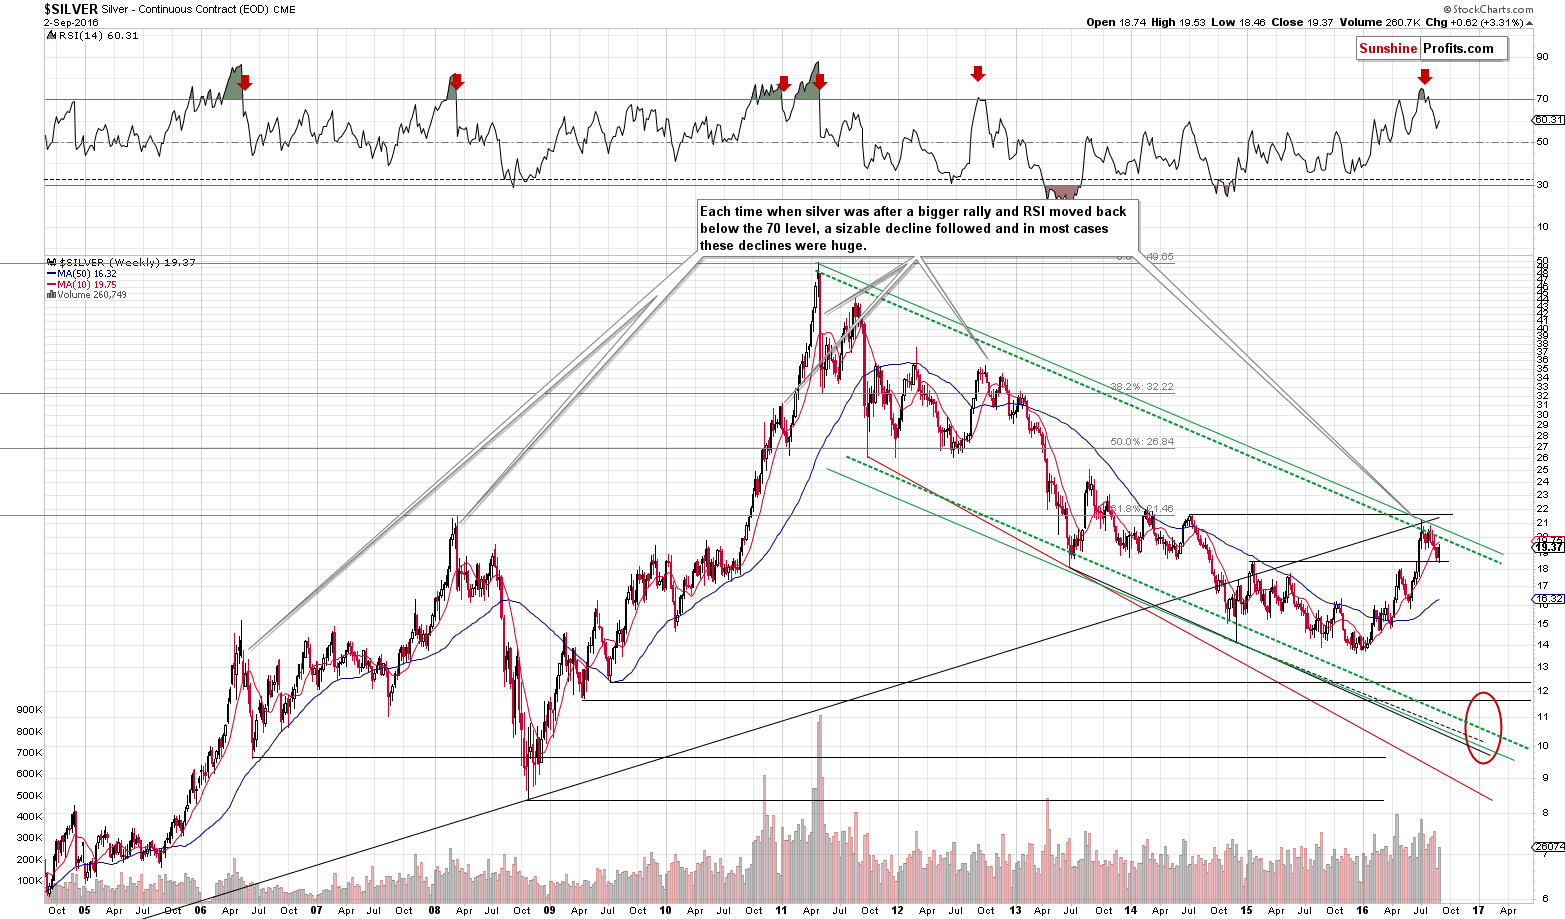
Moreover, that’s more or less where we currently have the declining green resistance line (based on the 2011 and 2016 tops in terms of weekly closing prices). Consequently, silver could rally visibly, but a move above the 2016 highs is highly unlikely.
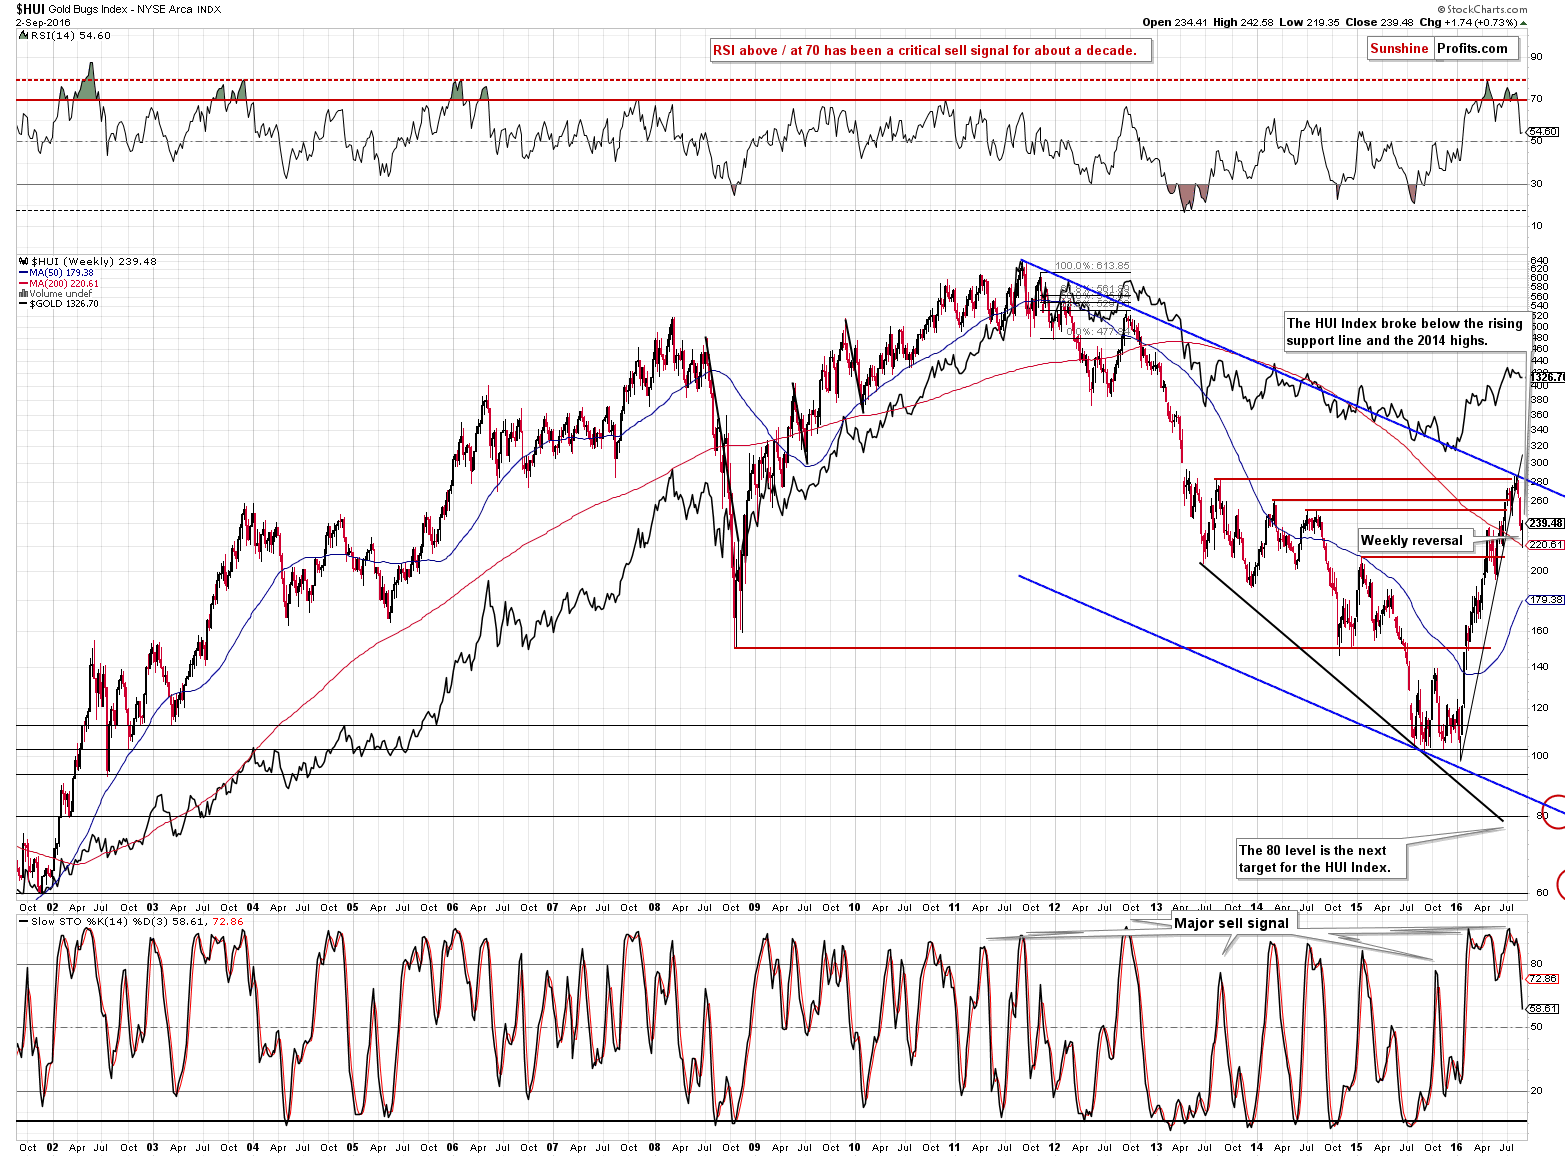
Moving on to gold stocks, we saw a weekly reversal and its implications are bullish. It was accompanied by huge volume, which we’ll feature on the following chart, but before moving to it, please note that the breakdown below the 2014 highs was not invalidated.
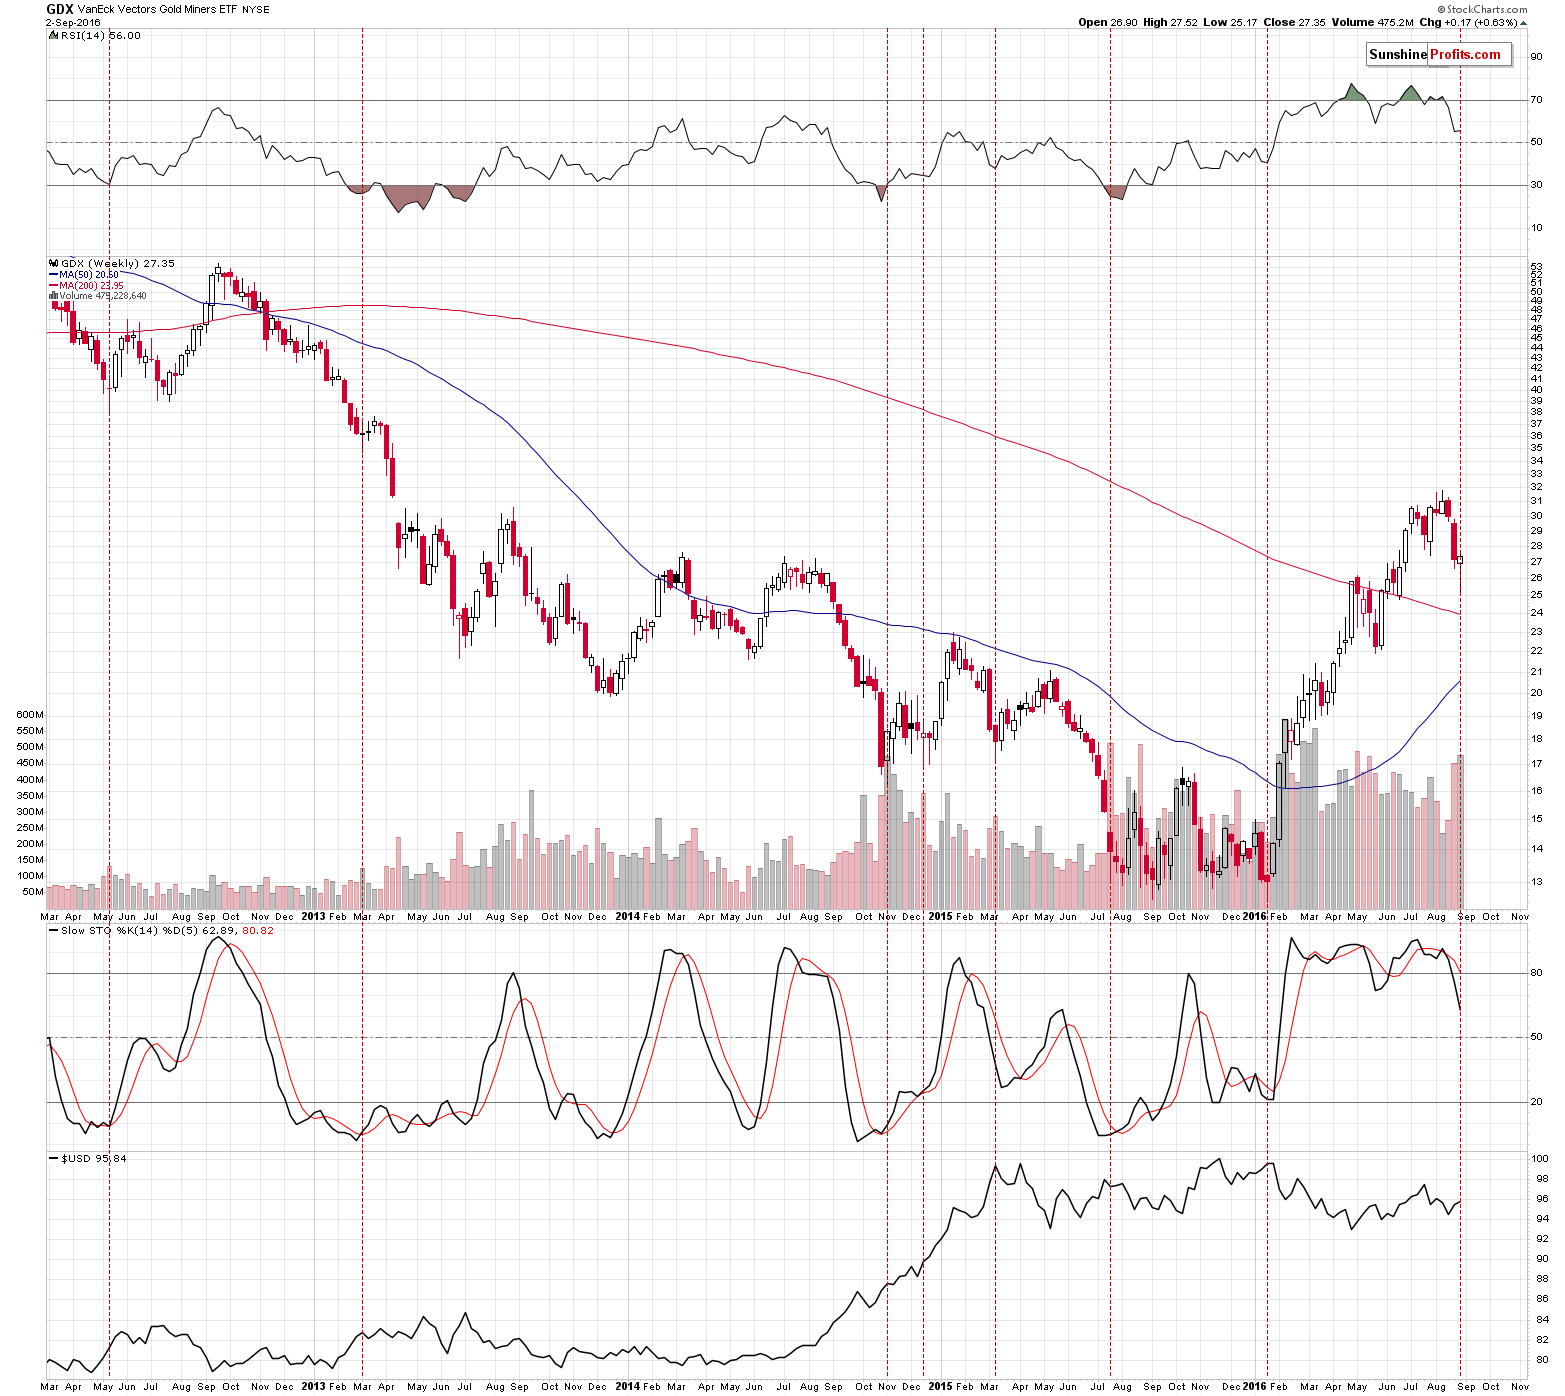
Moving back to the issue of big volume and the daily reversal, we marked similar weeks with vertical red lines. The implications vary from slightly bullish (like in March 2013) to very bullish (like in January 2016). Overall, the implications are moderately bullish.
So, miners are also pointing to higher prices in the following days, but how high are they likely to go?
As far as this question is concerned, our previous comments remain up-to-date.
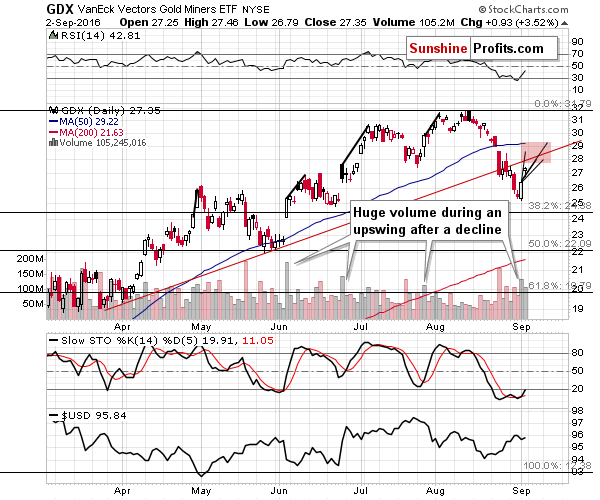
We marked the similar moves that took place after the similar daily rallies (from the highest point of the initial session to the final top in intra-day terms) and we applied these moves to yesterday’s high. The red rectangle is the area where miners would have to go for this rally to be similar to the previous ones.
Please note that even when mining stocks were moving mostly higher, the sizes of the follow-up rallies were not that huge. After a relatively big daily rally, it turned out that a large part of the entire short-term rally was already over.
What does that imply for the current situation? That it’s likely not worth participating in this rally as the potential size thereof is quite limited, especially when we factor in the significant resistance created by the rising red line (at about $28 - $28.5). Naturally, if it was certain that miners would move there, participating in the rally would be obvious, but it is associated with risk – especially that miners are after a major breakdown and have been underperforming gold for weeks (with yesterday’s session being an exception) and since it appears that the precious metals are now in a bigger downtrend.
So far, the miners’ rally is in perfect tune with the previous ones. What’s next in light of the above analogy to previous moves? Miners could consolidate for a bit or they could shoot right up, but it seems that about half or more than a half of the move is already behind us. The volume that we saw on Friday was still significant, which points to the continuation of the move, but the implications are only of a short-term nature.
So, is the rally inevitable?
Even in the case of mining stocks we have some bearish signs as well.
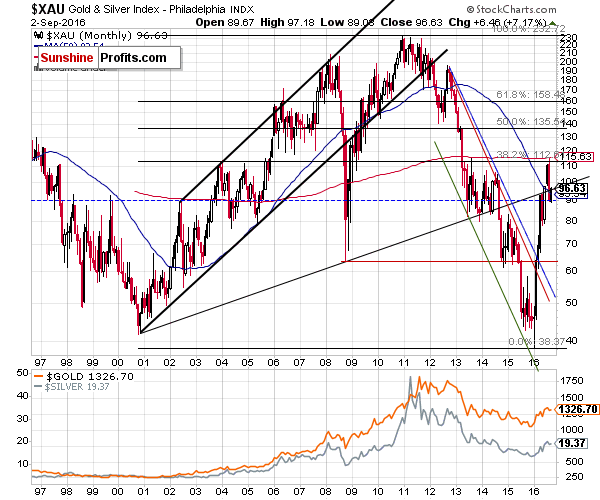
In the case of the XAU Index, which includes not only gold stocks, but also silver stocks, we see that miners moved to the 38.2% Fibonacci retracement level and declined significantly enough to invalidate the move above the rising long-term support line. Last week’s rally only took the index back to this line, there was no clear invalidation of the breakdown. Consequently, technically, the bearish implications of the breakdown remain in place.
Summing up, even though the 1983 analogy and the big downtrend remain in place, it appears that an additional short-term rally is likely on the horizon and that we will be able to re-enter the speculative short positions at higher prices. For now, both long and short positions seem too risky, so we are staying on the sidelines, waiting for a better risk to reward ratio. There will most likely be at least a few bearish confirmations present when the next local top is formed and we will be paying extra attention to the markets and report to you if we see such events.
As always, we will keep you – our subscribers – updated.
To summarize:
Trading capital (supplementary part of the portfolio; our opinion): No positions
Long-term capital (core part of the portfolio; our opinion): No positions
Insurance capital (core part of the portfolio; our opinion): Full position
Plus, you might want to read why our stop-loss orders are usually relatively far from the current price.
Please note that a full position doesn’t mean using all of the capital for a given trade. You will find details on our thoughts on gold portfolio structuring in the Key Insights section on our website.
As a reminder – “initial target price” means exactly that – an “initial” one, it’s not a price level at which we suggest closing positions. If this becomes the case (like it did in the previous trade) we will refer to these levels as levels of exit orders (exactly as we’ve done previously). Stop-loss levels, however, are naturally not “initial”, but something that, in our opinion, might be entered as an order.
Since it is impossible to synchronize target prices and stop-loss levels for all the ETFs and ETNs with the main markets that we provide these levels for (gold, silver and mining stocks – the GDX ETF), the stop-loss levels and target prices for other ETNs and ETF (among other: UGLD, DGLD, USLV, DSLV, NUGT, DUST, JNUG, JDST) are provided as supplementary, and not as “final”. This means that if a stop-loss or a target level is reached for any of the “additional instruments” (DGLD for instance), but not for the “main instrument” (gold in this case), we will view positions in both gold and DGLD as still open and the stop-loss for DGLD would have to be moved lower. On the other hand, if gold moves to a stop-loss level but DGLD doesn’t, then we will view both positions (in gold and DGLD) as closed. In other words, since it’s not possible to be 100% certain that each related instrument moves to a given level when the underlying instrument does, we can’t provide levels that would be binding. The levels that we do provide are our best estimate of the levels that will correspond to the levels in the underlying assets, but it will be the underlying assets that one will need to focus on regarding the signs pointing to closing a given position or keeping it open. We might adjust the levels in the “additional instruments” without adjusting the levels in the “main instruments”, which will simply mean that we have improved our estimation of these levels, not that we changed our outlook on the markets. We are already working on a tool that would update these levels on a daily basis for the most popular ETFs, ETNs and individual mining stocks.
Our preferred ways to invest in and to trade gold along with the reasoning can be found in the how to buy gold section. Additionally, our preferred ETFs and ETNs can be found in our Gold & Silver ETF Ranking.
As always, we'll keep you - our subscribers - updated should our views on the market change. We will continue to send out Gold & Silver Trading Alerts on each trading day and we will send additional Alerts whenever appropriate.
The trading position presented above is the netted version of positions based on subjective signals (opinion) from your Editor, and the Tools and Indicators.
As a reminder, Gold & Silver Trading Alerts are posted before or on each trading day (we usually post them before the opening bell, but we don't promise doing that each day). If there's anything urgent, we will send you an additional small alert before posting the main one.
=====
Latest Free Trading Alerts:
The U.S. economy added 151,000 jobs in August. What does it imply for the Fed policy and the gold market?
Disappointing August Payrolls and Gold
=====
Hand-picked precious-metals-related links:
Gold steady as weak U.S. jobs data cuts rate hike views
Metals-Miners Run Out of Steam as Citigroup Cuts Outlook
=====
In other news:
Goldman Sachs boldly strays from the herd with a contrarian Fed call
BOJ's Kuroda says room for more easing, including new ideas
IMF working paper proposes reinforced Abenomics to battle Japan deflation
Asia shares rally as U.S. job report seen dimming chance of Sept hike
China, U.S. commit to refrain from competitive currency devaluations
Why the Fed could raise rates TWICE this year: trader
=====
Thank you.
Sincerely,
Przemyslaw Radomski, CFA
Founder, Editor-in-chief, Gold & Silver Fund Manager
Gold & Silver Trading Alerts
Forex Trading Alerts
Oil Investment Updates
Oil Trading Alerts

