

Briefly: Short positions (full position) in gold, silver and mining stocks are justified from the risk/reward perspective.
Two important pieces of financial news emerged last week. The more important one was the interest rate cut by the Bank of England and the less important was an employment report better than expected. The more important of the above was bullish for gold (more easy credit – money) and the less important was bearish for gold (though indirectly as it doesn’t have to change the Fed’s approach). So why did gold decline over $13 last week?
Because there’s much more to what drives the price of gold than just simply pieces of information. If the price of the yellow metal was really driven by information, gold would move more or less randomly as news is sometimes good and sometimes bad and there’s a ton of it. Still, gold moved from $1,900 to below $1,100 despite the fundamental situation being positive and without an increase in the interest rates in the U.S. Then gold rallied despite an increase in the interest rates. Is the gold – news link really that simple? No, it is not.
Which brings us to another question – is knowing and analyzing fundamentals enough to enter and exit and enter the market at correct times (or more or less close to them)? Let’s reply to this question by reminding you of one situation in silver. What changed in the fundamental outlook for silver from July 2008 to October 2008? Did the world stop using silver? Did mine production suddenly increase? No. And yet silver’s price declined from $19.55 to 8.40 – it was more than cut in half. Something else was in the works. We won’t say that it was completely predictable right from the start of the slide to its very end, but it was completely UNpredictable if one focused on fundamental information and news only. With technical, cyclical, fractal and other price-and-volume-based analyses one could have successfully exited the market at higher prices than the prices at which they would re-enter. By the way, we closed the long-term investment position in silver much higher than the current prices and we think we will have a much better opportunity to re-enter these positions than what we have today.
Ending the above digression – what can last week’s reaction tell us? That gold is ready to fall and based on the 1983-today analogy, it’s ready to fall hard. Why? Because gold failed to react to a bullish piece of news by rallying and it (and the same goes for silver) reacted significantly (overreacted?) to the bearish piece of news. Several technical confirmations followed. Let’s take a closer look (charts courtesy of http://stockcharts.com and chartsrus.com).
Once again, let’s start by discussing the analogy that we featured in July.
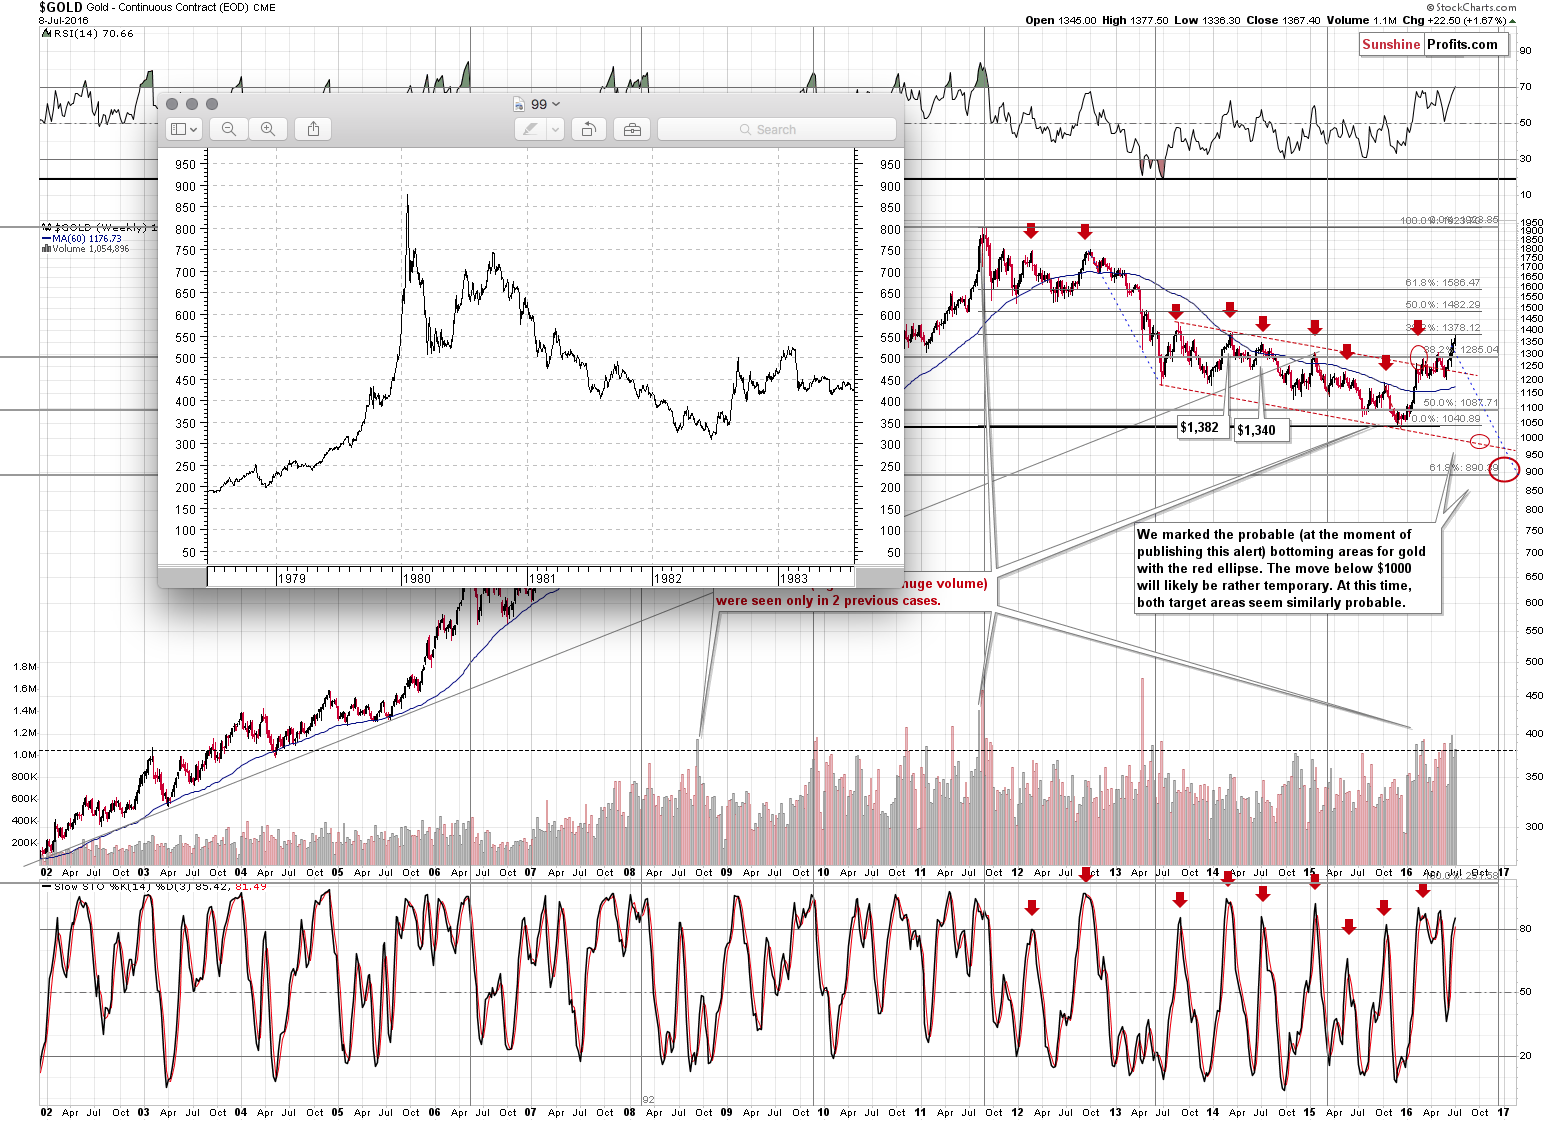
Back in July we wrote the following:
(...) let us re-emphasize that gold tends to repeat its price moves. At times it does it to the letter, but in most cases it is the shape of the move that matters the most. This self-similarity pattern phenomenon can provide a roadmap of the following events – if we detect that we have one that is (Fractalyzer does that automatically, but some things can be also detected manually).
There are multiple similarities in the pattern: the parabolic upswing, the 2 tops that followed it, the initial big decline after a breakdown below the initial low, followed by a less steep decline. In both cases after the “final” bottom, the initial rally was very sharp, then we saw some sideways movement and then an additional rally a bit above the previous high.
The above makes the 2 cases very similar already, but that’s not all there is to it. Both post-bottom rallies took a little move than 6 months before the decline resumed. How high did gold rally initially in both cases? More or less to the first visible local high.
The pattern is from the end of the previous bull market (1980 top) and what followed it and while we don’t think the bull market is completely over this time, the emotions that accompanied investors in 1980 are similar to those at the 2011 top. Consequently, there are good reasons to think that the price patterns after these tops can be similar.
What does the similarity mean? That the price pattern is likely to continue, so the follow-up action in the price pattern from the past can tell us a lot about what’s likely to follow.
What is likely to happen next? The same thing – or something very similar to it – that happened in the past after this pattern. In the past, gold rallied only a little above the previous high (the one that formed after the initial sharp rally) and then it topped. After that gold moved to new lows.
We already wrote that back then the rally was in place for a bit above 6 months and the same is the case right now. Consequently, the time may be up for the rally. To be clear, since the entire pattern is very similar but not identical, it could be the case that gold doesn’t decline for another month or so and it would not invalidate the pattern or make the subsequent decline less likely based on it. Overall, the time requirement for the top to be in, is fulfilled.
What about the price? In the past gold moved more or less to the 38.2% Fibonacci retracement level based on the decline and gold is very close to this level also this time. Besides, the second and final top took form above the lowest of the previous local tops, but below the highest local top. That’s where gold is right now as well. Moreover, even if gold rallies a bit more from here, it will still remain within the above pattern.
So, what are the implications of the above? The clear implication is that gold is likely to decline (if not right away, then still rather soon) and the decline is quite likely to take gold to new lows.
Last week, gold moved to the 38.2% Fibonacci retracement based on the entire decline. Consequently, not only does the time requirement seem to be fulfilled, but the same goes for price. Let’s keep in mind that gold moved a few dollars above the retracement before topping, so even a move to $1,400 or so would not invalidate the above. Still, such an upswing is not necessary or likely – after all gold topped right at the retracement and there are many indications of extreme optimism among precious metals investors – strong indications that the top is in (or at hand).
In Friday’s alert we added:
The above is up-to-date as gold is once again close to the mentioned 38.2% Fibonacci retracement level. Why are we bringing this topic back today? Because based on the most recent upswing in gold, the current price pattern is even more similar to what happened previously.
Please note how gold topped in early 1983. The top consisted of 3 smaller tops: the initial one (lowest), the second (highest) and the final one that took gold almost to the second top, but ultimately didn’t exceed it.
What did gold do back in 1983? It plunged. What did gold do on Friday? It plunged. The size of the slide is not as big as in 1983 yet, but the direction and sharpness of the decline is clearly in tune with what happened a few decades ago. The history rhymes and this has very bearish implications for the current outlook.
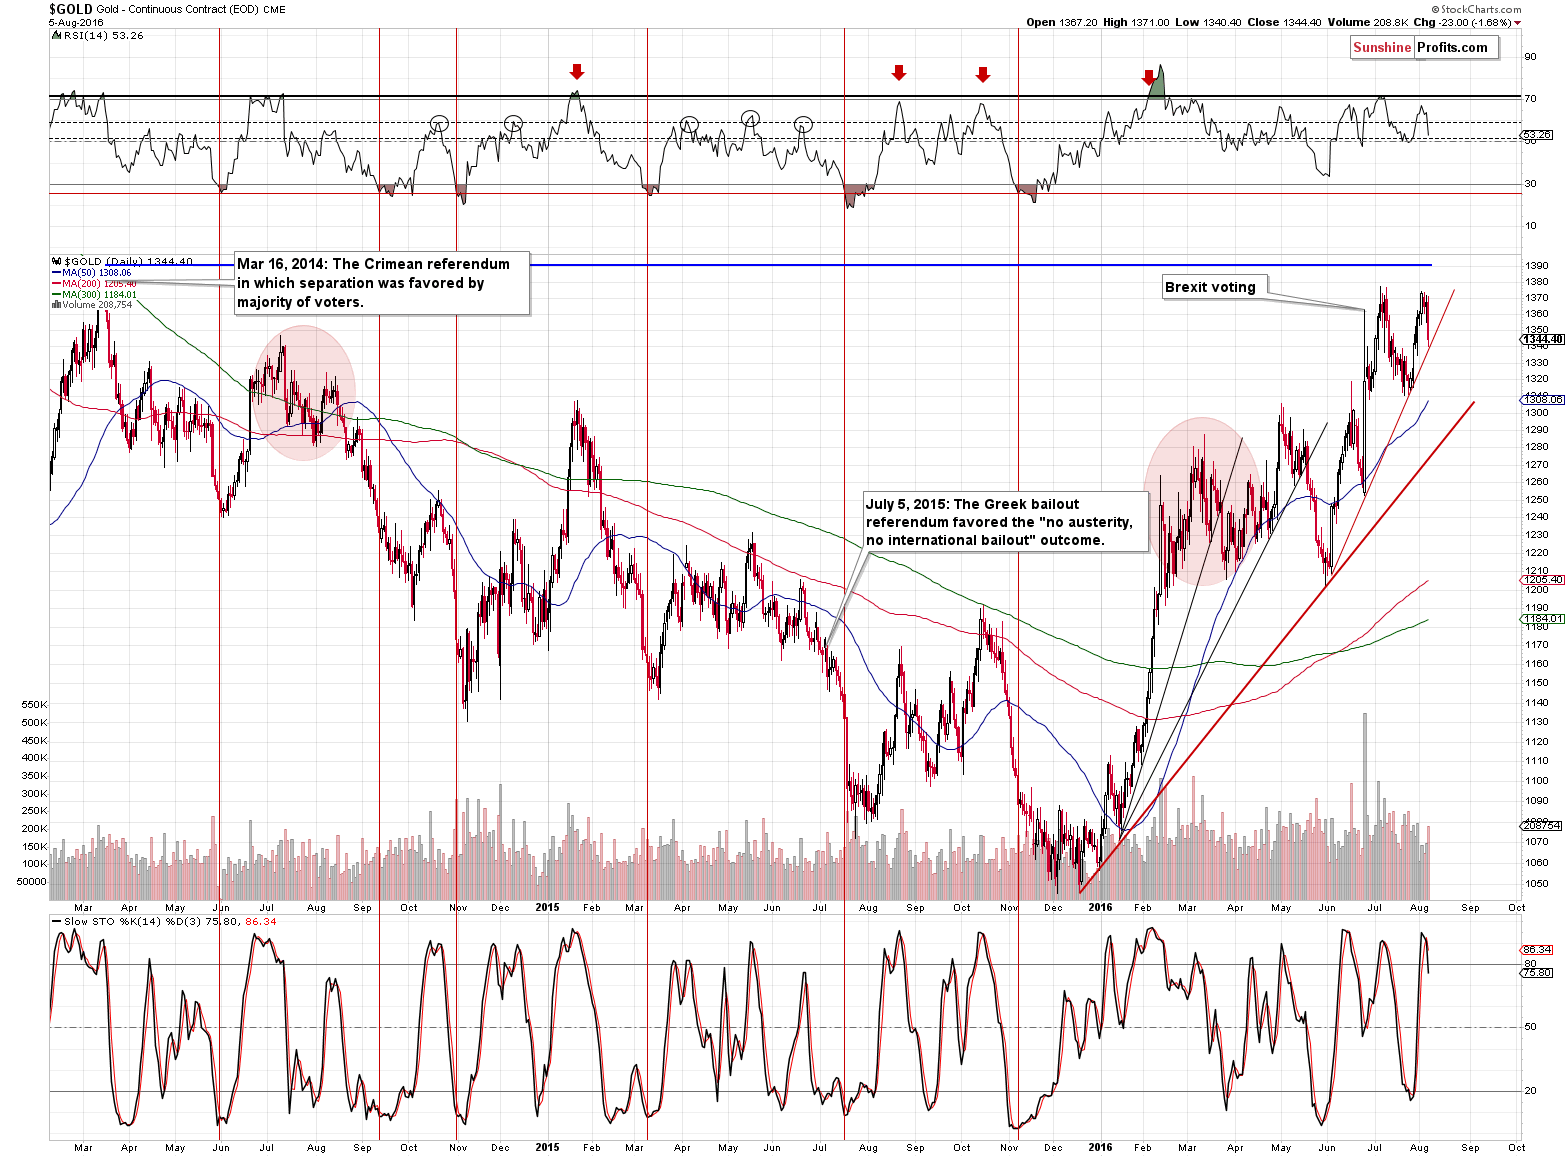
On the above short-term chart, we see that gold declined on increased volume (bearish implications), but we also see that gold moved to the short-term rising support line, which is bullish as there was no breakdown. Overall, the implications of Friday’s action are mixed… And that’s the only somewhat bullish indication that we’ve got. Now, let’s take a look at the Japanese yen currency exchange rate, which is highly correlated with gold.
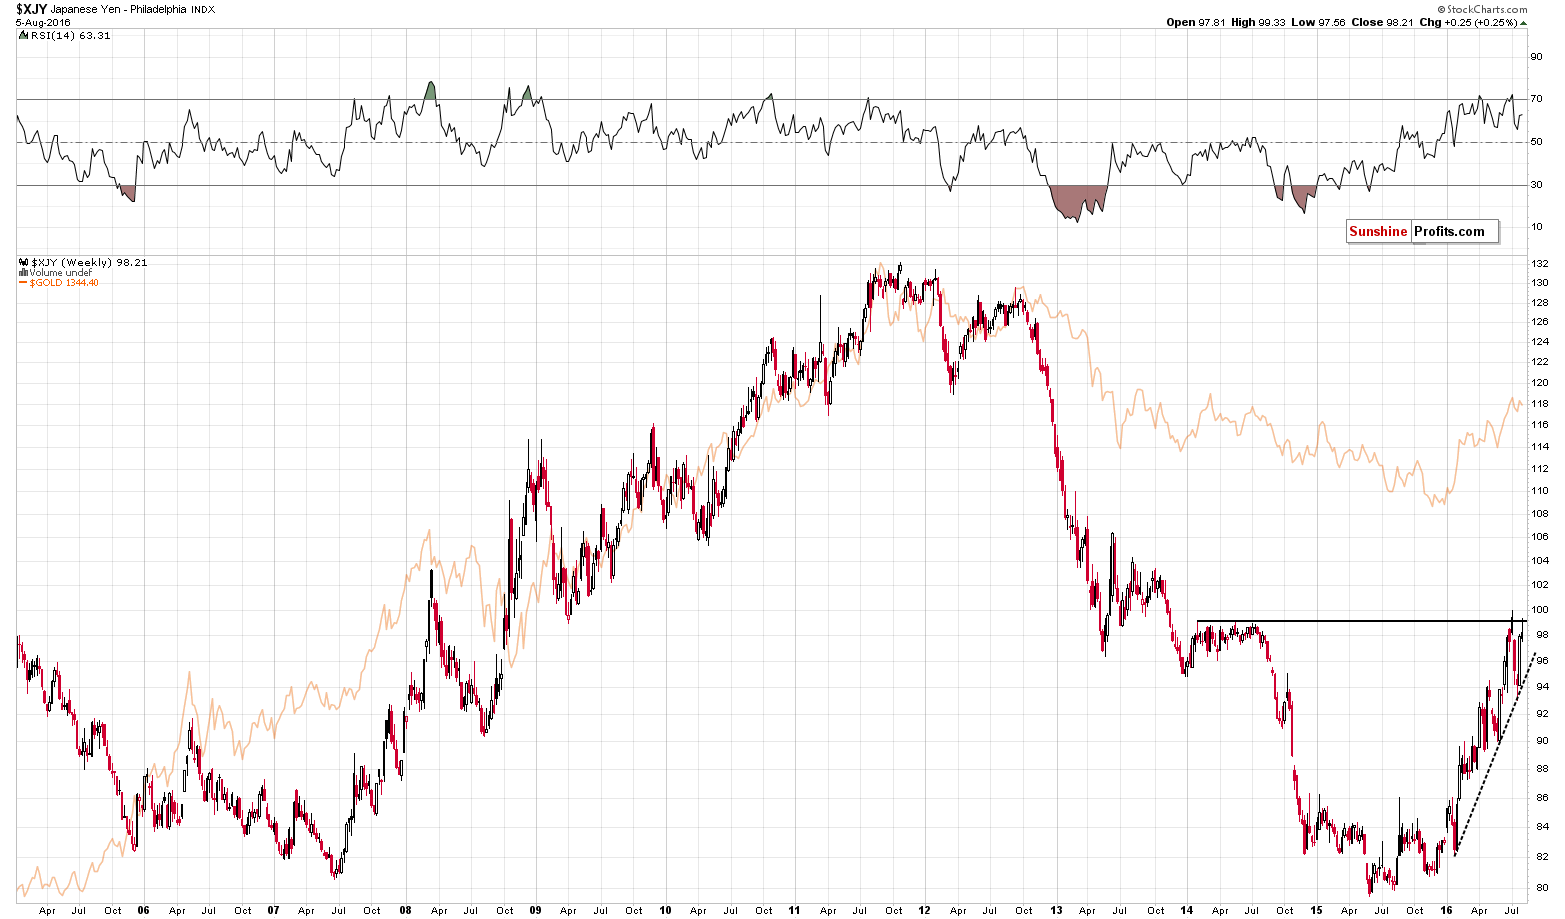
The yen moved once again to the resistance line (created by the 2014 highs) and it once again failed to hold. The rising support line has not been broken yet, but the tiny invalidation is a strong bearish sign. The yen-gold link suggests – in light of the above – that lower gold prices will follow.
Let’s take a look at silver.
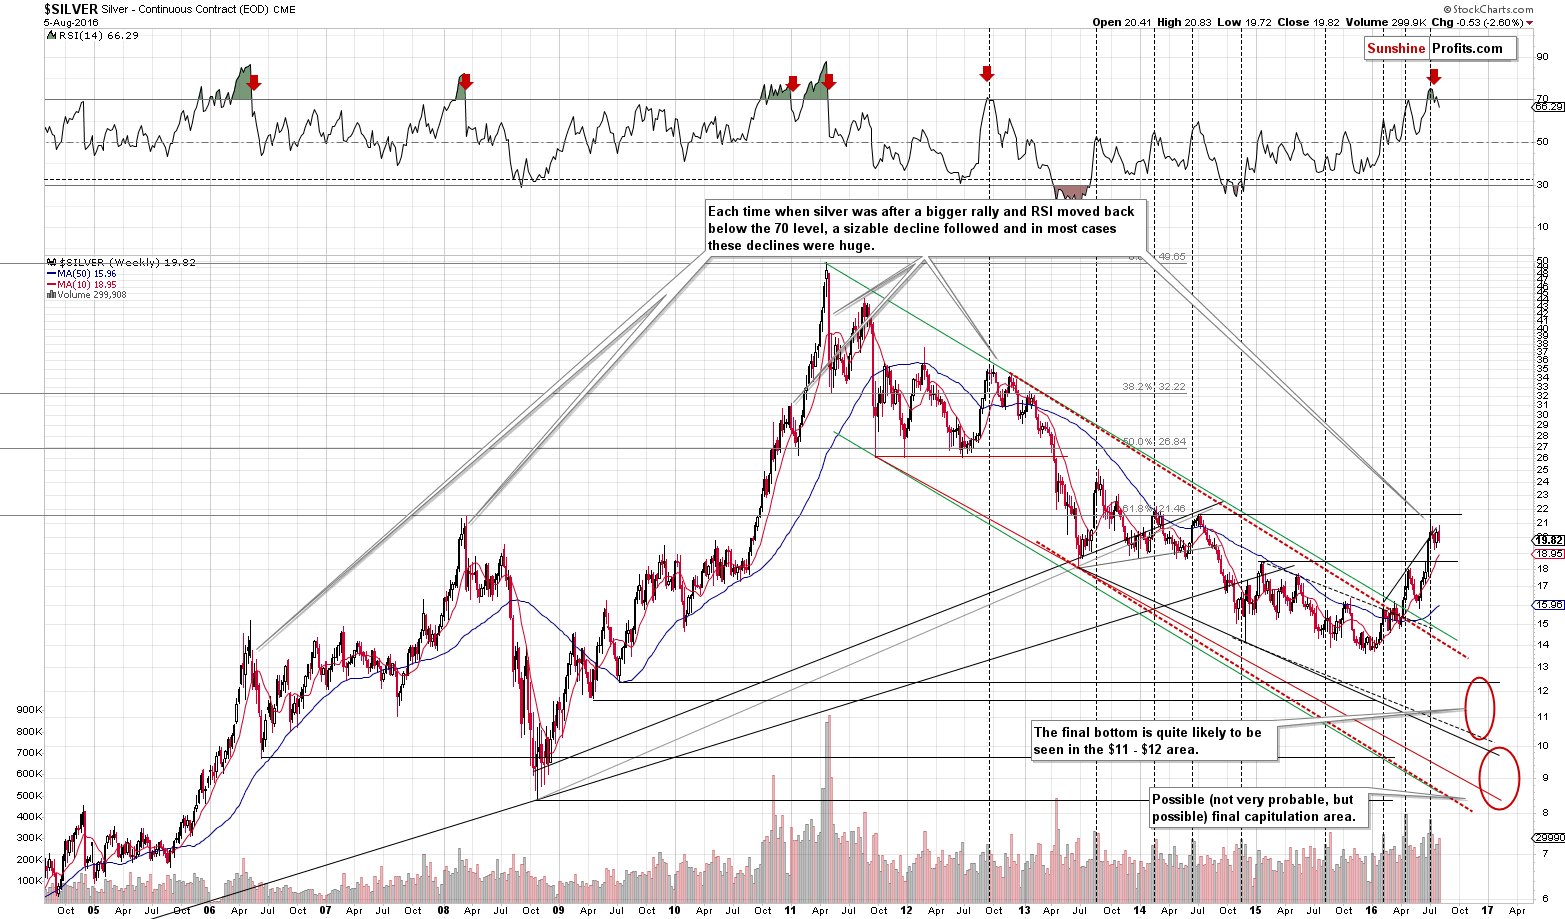
After the bearish high-volume spike, we saw a decline, a weekly comeback on relatively low volume and now a weekly decline on higher volume. The implications of the price-volume link are bearish and the same goes for the analysis of the RSI indicator. The latter moved visibly below the 70 level despite a temporary move back above it. The same was the case in 2013 and once the move below 70 was clearly seen, the decline truly started and higher prices have not been seen since that time.
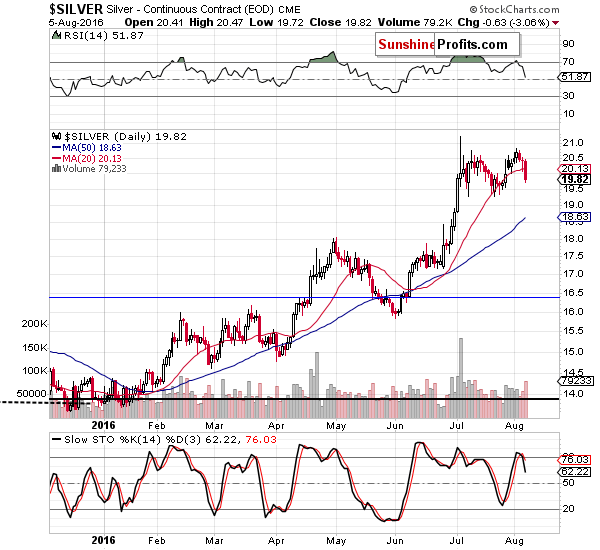
On the above short-term chart we see that silver broke below the 20-day moving average and that it’s done so on high volume. The implications are bearish, especially that the breakdown was accompanied by a sell signal from the Stochastic indicator.
What about mining stocks?
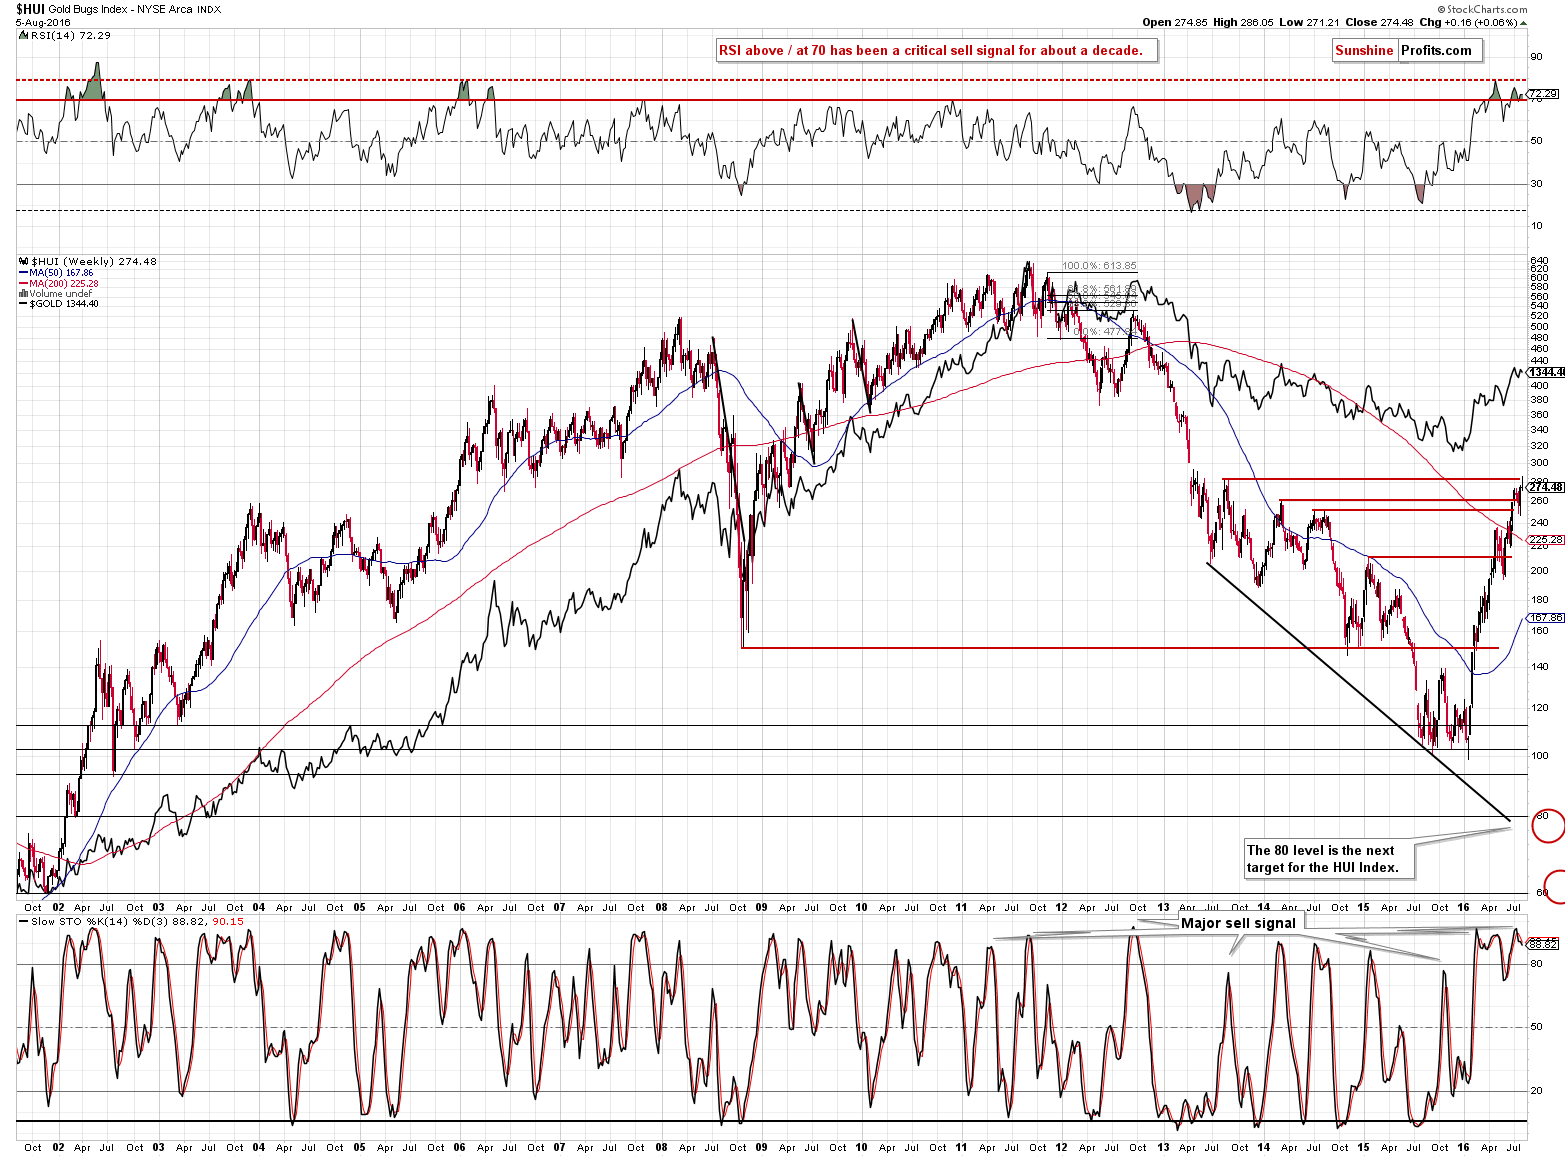
The HUI Index formed a gravestone doji candlestick last week, which is one of the most meaningful reversal candlesticks. Long story short, it’s about the value of an asset being unable to close the week visibly higher despite an intra-week upswing. We just saw this kind of development in gold stocks. Naturally, the implications are bearish and we can say the same about the recent sell signal from the Stochastic indicator.
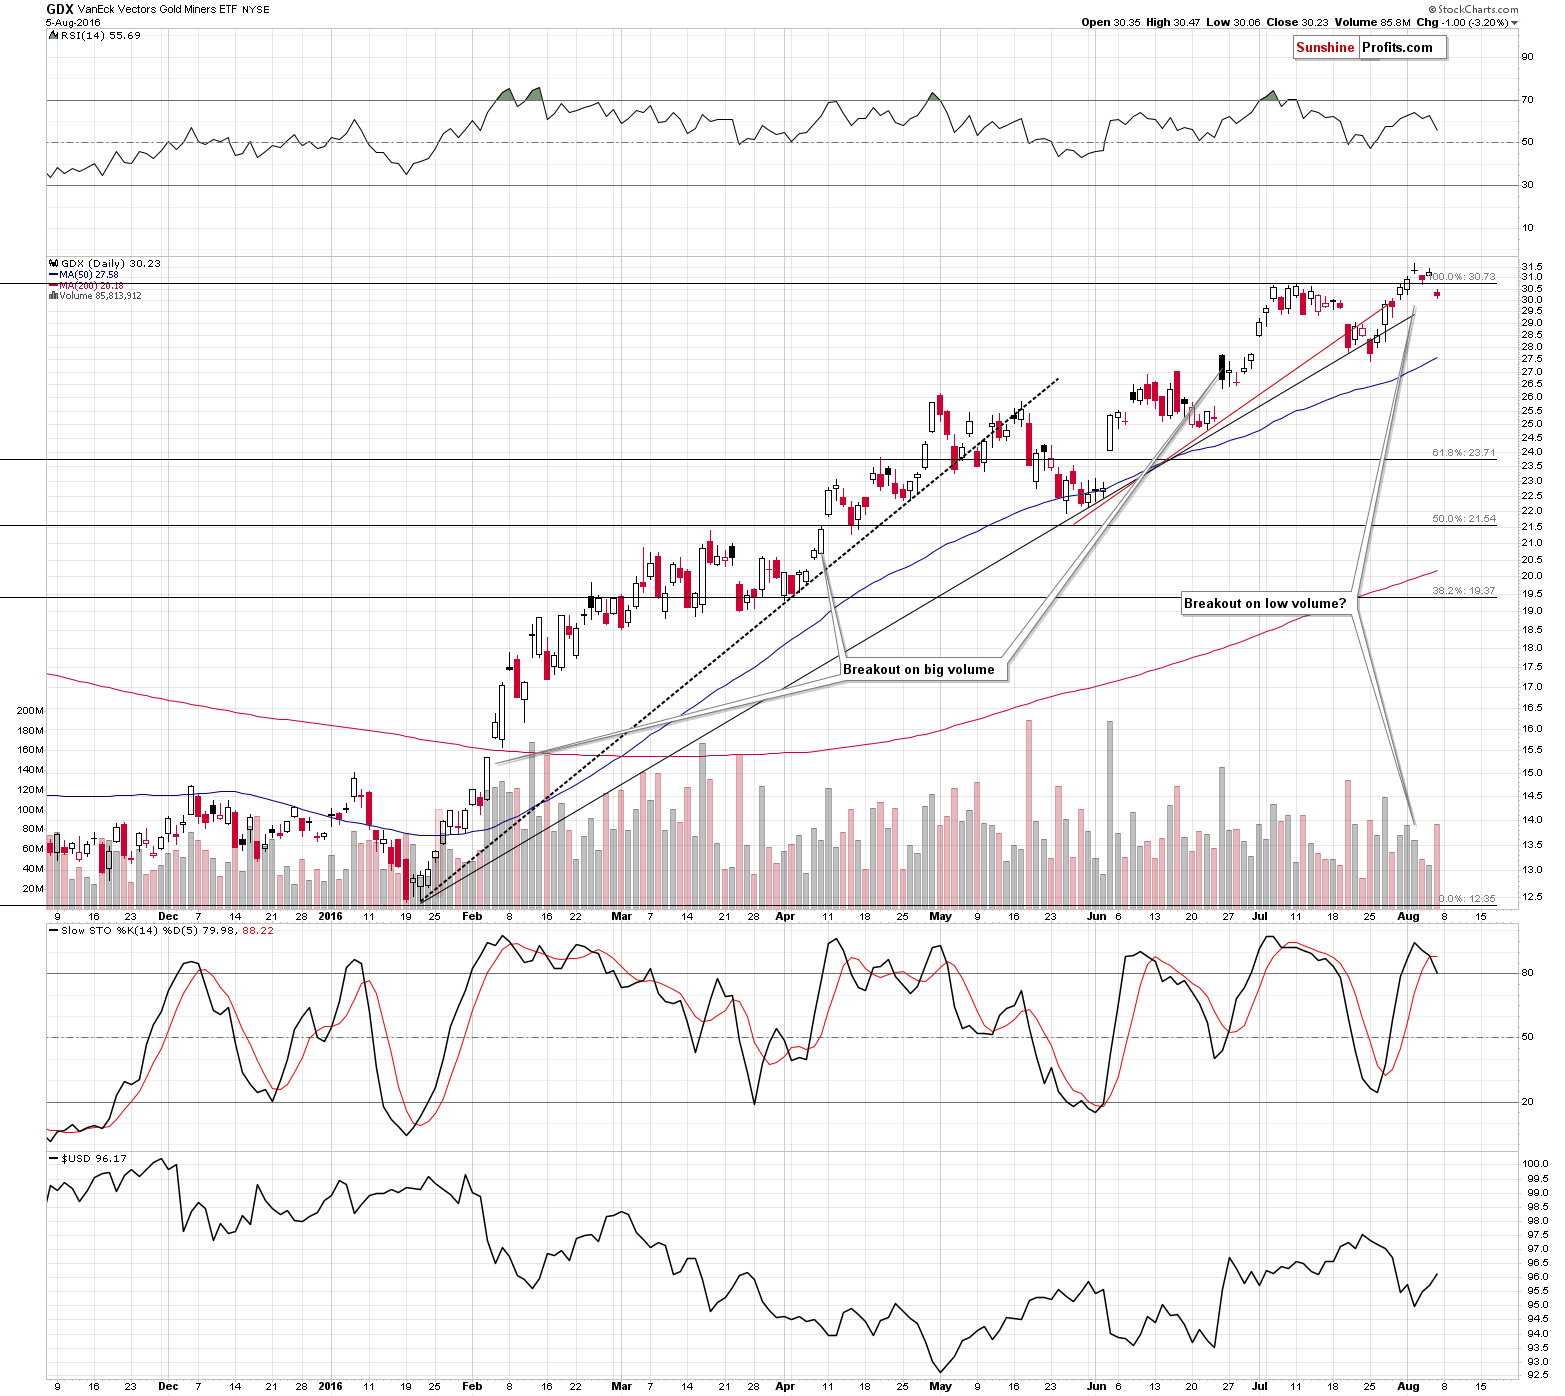
On the short-term basis, the implications are also bearish because the miners’ decline on big volume and the Stochastic indicator confirmed the bearish implications.
Summing up, last week was rich in developments in the precious metals market and the short-term outlook changed based on them. The medium-term outlook remains bearish, but the short-term outlook changed from being unclear to being bearish. Consequently, we think that opening speculative short positions is now justified from the risk to reward point of view. If the analogy to the 1983 is to be upheld, we are only after the very initial part of the decline.
As always, we will keep you – our subscribers – updated.
To summarize:
Trading capital (supplementary part of the portfolio; our opinion): Short positions (full position) in gold, silver and mining stocks are justified from the risk/reward perspective with the following entry prices, stop-loss orders and initial target price levels:
- Gold: initial target price: $1,006; stop-loss: $1,423, initial target price for the DGLD ETN: $74.37; stop-loss for the DGLD ETN $34.91
- Silver: initial target price: $13.12; stop-loss: $21.63, initial target price for the DSLV ETN: $39.78; stop-loss for the DSLV ETN $14.34
- Mining stocks (price levels for the GDX ETF): initial target price: $9.34; stop-loss: $33.17, initial target price for the DUST ETF: $16.38; stop-loss for the DUST ETF $3.77
In case one wants to bet on junior mining stocks' prices (we do not suggest doing so – we think senior mining stocks are more predictable in the case of short-term trades – if one wants to do it anyway, we provide the details), here are the stop-loss details and initial target prices:
- GDXJ ETF: initial target price: $14.13; stop-loss: $54.29
- JDST ETF: initial target price: $14.39; stop-loss: $3.22
Long-term capital (core part of the portfolio; our opinion): No positions
Insurance capital (core part of the portfolio; our opinion): Full position
Plus, you might want to read why our stop-loss orders are usually relatively far from the current price.
Please note that a full position doesn’t mean using all of the capital for a given trade. You will find details on our thoughts on gold portfolio structuring in the Key Insights section on our website.
As a reminder – “initial target price” means exactly that – an “initial” one, it’s not a price level at which we suggest closing positions. If this becomes the case (like it did in the previous trade) we will refer to these levels as levels of exit orders (exactly as we’ve done previously). Stop-loss levels, however, are naturally not “initial”, but something that, in our opinion, might be entered as an order.
Since it is impossible to synchronize target prices and stop-loss levels for all the ETFs and ETNs with the main markets that we provide these levels for (gold, silver and mining stocks – the GDX ETF), the stop-loss levels and target prices for other ETNs and ETF (among other: UGLD, DGLD, USLV, DSLV, NUGT, DUST, JNUG, JDST) are provided as supplementary, and not as “final”. This means that if a stop-loss or a target level is reached for any of the “additional instruments” (DGLD for instance), but not for the “main instrument” (gold in this case), we will view positions in both gold and DGLD as still open and the stop-loss for DGLD would have to be moved lower. On the other hand, if gold moves to a stop-loss level but DGLD doesn’t, then we will view both positions (in gold and DGLD) as closed. In other words, since it’s not possible to be 100% certain that each related instrument moves to a given level when the underlying instrument does, we can’t provide levels that would be binding. The levels that we do provide are our best estimate of the levels that will correspond to the levels in the underlying assets, but it will be the underlying assets that one will need to focus on regarding the signs pointing to closing a given position or keeping it open. We might adjust the levels in the “additional instruments” without adjusting the levels in the “main instruments”, which will simply mean that we have improved our estimation of these levels, not that we changed our outlook on the markets. We are already working on a tool that would update these levels on a daily basis for the most popular ETFs, ETNs and individual mining stocks.
Our preferred ways to invest in and to trade gold along with the reasoning can be found in the how to buy gold section. Additionally, our preferred ETFs and ETNs can be found in our Gold & Silver ETF Ranking.
As always, we'll keep you - our subscribers - updated should our views on the market change. We will continue to send out Gold & Silver Trading Alerts on each trading day and we will send additional Alerts whenever appropriate.
The trading position presented above is the netted version of positions based on subjective signals (opinion) from your Editor, and the Tools and Indicators.
As a reminder, Gold & Silver Trading Alerts are posted before or on each trading day (we usually post them before the opening bell, but we don't promise doing that each day). If there's anything urgent, we will send you an additional small alert before posting the main one.
=====
Latest Free Trading Alerts:
The U.S. economy added 255,000 jobs in July. What does it imply for the Fed policy and the gold market?
=====
Hand-picked precious-metals-related links:
Gold slips to 1-wk low as US jobs data boosts rate-hike prospects
Gold and Silver Dominate the ETF Charts
China Bought Less Bullion as Prices Climbed After Brexit Vote
=====
In other news:
Fed's Powell urges patience on U.S. rates, citing growth risks
Bond Market’s Big Illusion Revealed as U.S. Yields Turn Negative
Disappointing China July imports suggest cooling domestic demand
BOJ’s Policy Review Means Stimulus Boost Coming, Survey Shows
=====
Thank you.
Sincerely,
Przemyslaw Radomski, CFA
Founder, Editor-in-chief, Gold & Silver Fund Manager
Gold & Silver Trading Alerts
Forex Trading Alerts
Oil Investment Updates
Oil Trading Alerts

