

Briefly: In our opinion, short (full) speculative positions in gold, silver and mining stocks are justified from the risk/reward point of view.
The precious metals moved significantly lower yesterday, but mining stocks closed only a bit lower. There were times in the past when such action heralded higher prices. Is this the case also this time?
In short, in our opinion it’s unlikely that we would see a substantial price increase in metals and miners. Miners once again had a good reason to show some strength in the form of higher main stock indices’ values, so it’s no wonder that they haven’t declined significantly yet. We can’t rule out a temporary corrective upswing in the coming days, but not certain enough to adjust the current trading position in our view.
Let’s take a closer look at the charts (charts courtesy of http://stockcharts.com).
In yesterday’s alert, we wrote the following:
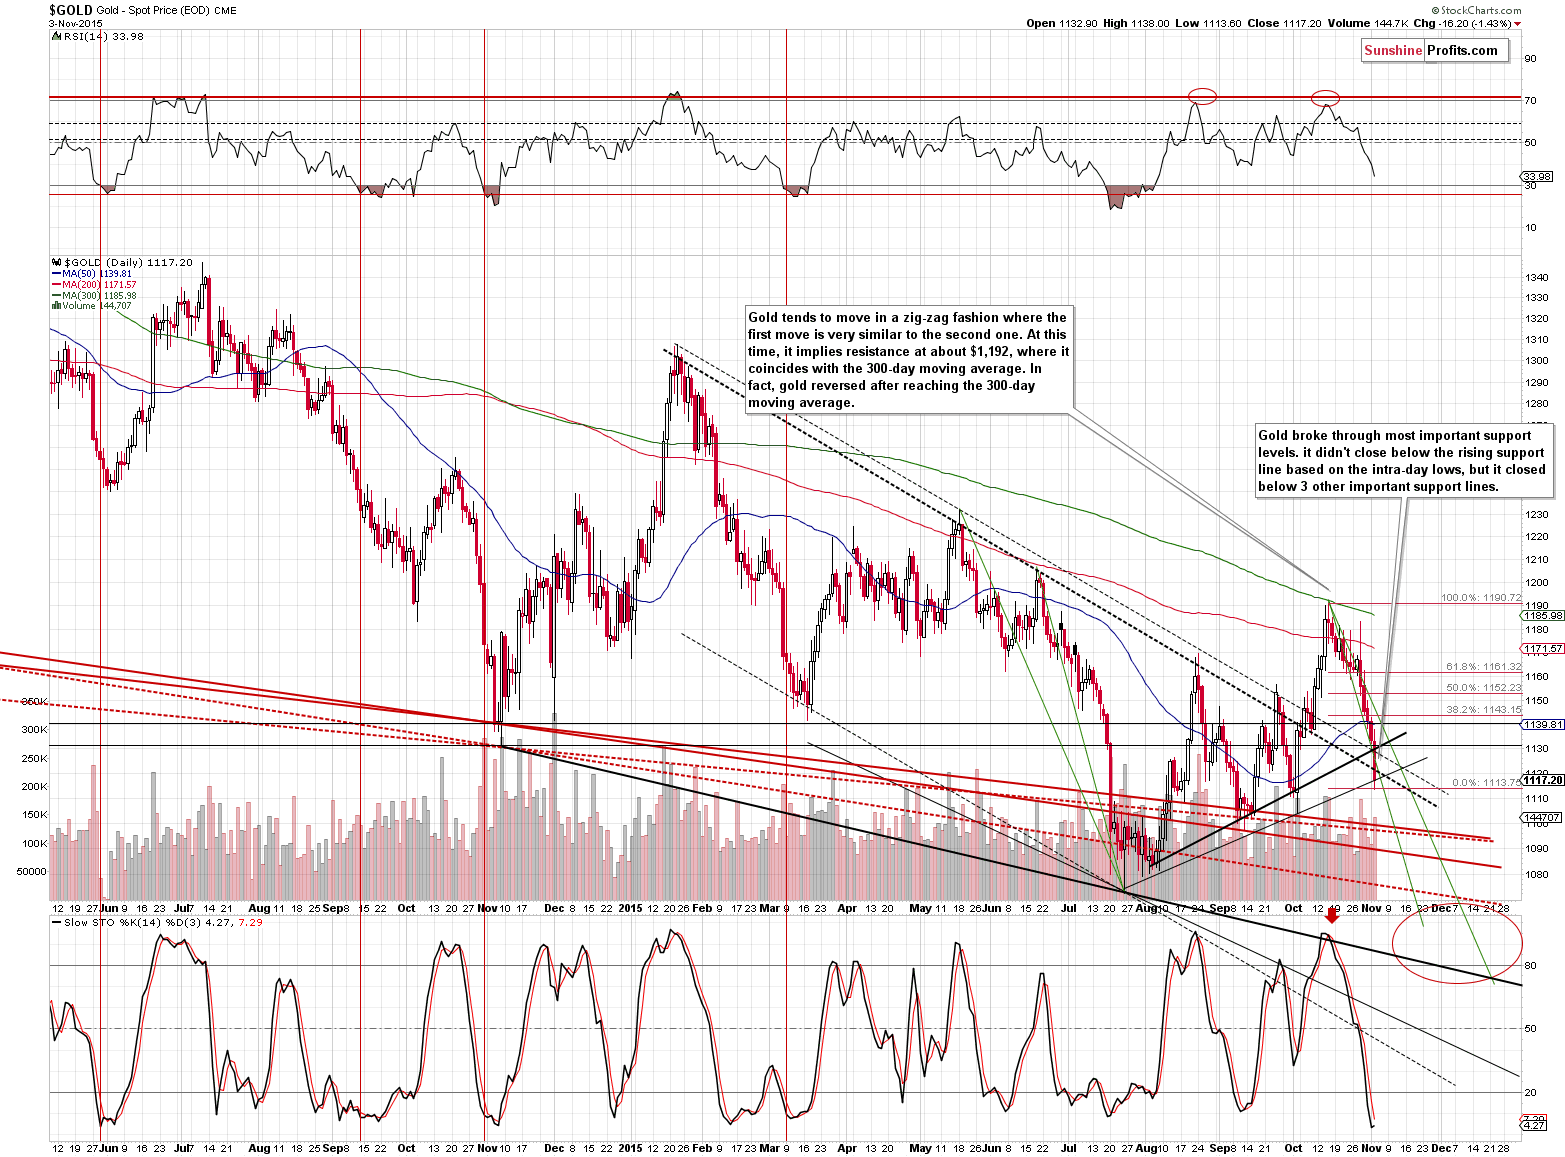
Gold moved lower and it continues to decline in tune with the pace of decline that we saw during the previous downswings. It’s in the lower part of the declining trend described by the green lines. This is an important observation, because gold is approaching a few support lines, especially the one based on the January, May and August tops. The fact that gold is closer to the lower of the green lines means that it could move temporarily higher (for instance, based on reaching a support level) and it would not invalidate even the short-term trend.
Gold declined once again yesterday and is now actually below the lower of the declining green lines. It could be the case that gold declined too fast and that it will need to correct before the decline continues. However, we would like to emphasize that the above is not a strong factor pointing to higher prices in the short term – it’s between weak and moderate, by still, it’s present.
In yesterday’s alert, we also wrote the following:
All in all, the trend remains bearish, but unless gold breaks below $1,115, we could see some temporary moves higher. We don’t think that these moves would be significant, though (not above $1,160) – that is if the counter-trend upswing does indeed materialize, which seems doubtful. The medium-term trend seems much clearer and much more worth betting on.
We didn’t have to wait long for gold to indeed move to (precisely, a bit below) the $1,115 level. Gold declined on significant volume yesterday and the mentioned level was temporarily broken. Now, we wrote about $1,115 as it was below the lowest of the close support levels. There are actually 4 lines that need to be considered: 2 based on January, May, and August highs (in terms of both the daily closing prices and intra-day highs) and 2 based on this year’s lows and the September/October lows (again, in terms of both the daily closing prices and intra-day lows).
At times, the price is stopped at the lines based on intra-day extremes and at times, the lines based on daily closing prices are more meaningful. Out of the mentioned 4 lines, 3 were broken yesterday. Consequently, the implications are bearish, but not strongly so, as the breakdowns are not confirmed yet. The volume was significant, so the move looks to be the true direction of the market, but it was not high enough to confirm the breakdowns by itself.
Generally, in the case of lines based on daily closing prices, it is the daily closing price that determines whether a certain line was broken or not. Both support lines that were based on closing prices were broken when we consider yesterday’s closing price. Once again, the implications are bearish, but not strongly so.
Overall, the situation on the above short-term gold chart deteriorated yesterday, but only a bit. We can’t rule out a corrective upswing in the coming days, but it doesn’t seem that it would take gold much higher – in all likelihood not above $1,160, and likely not even above $1,144 (the 38.2% Fibonacci retracement level). It’s also quite possible that there will be no visible corrective upswing, but rather a few days of trading sideways (or we could see no pause at all). The thing that we want to emphasize is that the medium-term trend clearly remains down and a short-term upswing – if it does indeed materialize – should not be surprising.
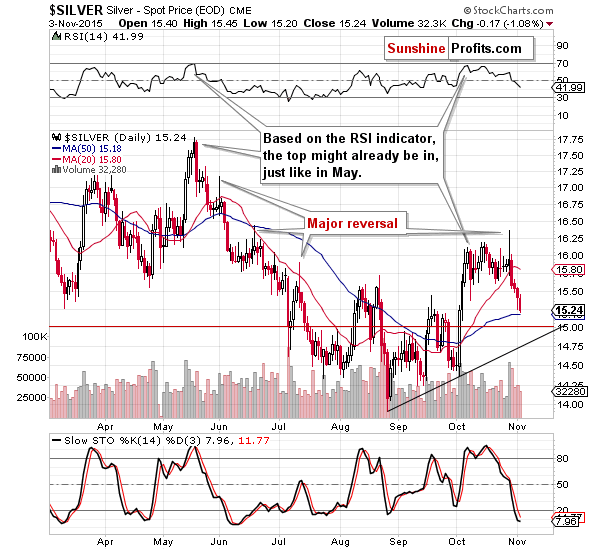
Silver declined as well and the above chart doesn’t indicate that a corrective upswing is just around the corner – the decline simply continues.
In yesterday’s alert, we wrote the following regarding mining stocks:
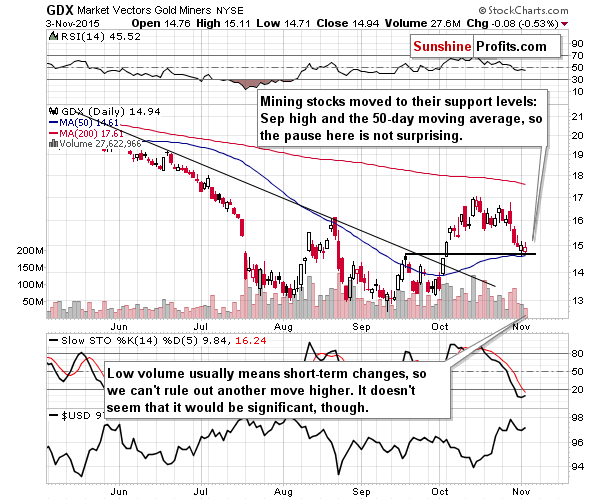
Miners moved higher by only a few cents and the fact that they formed a reversal candlestick is not really relevant, because the accompanying volume was low (in both absolute and relative terms). It seems that the miners’ pause was a reaction to the general stock market’s rally – not a show of true strength of the precious metals sector.
We can say the same once again today, as we saw more or less a repeat of what had happened previously. Today, we would like to add that there were 2 additional reasons for miners not to decline significantly: the September high and the 50-day moving average. Both levels helped to keep the miners’ declines in check, especially in light of a rising stock market.
On the other hand, low volume in mining stocks could indicate a temporary change – a corrective upswing, but the strength of this signal is rather small – the corrective upswing doesn’t have to materialize. The previous rally was preceded by miners’ short-term strength vs. gold, however, there were quite a few cases in the past, when such action did not follow the miners' daily or 2-day strength. At this time, in our opinion, it could indicate a short-term corrective upswing, but it doesn't have to, based on other (bearish) signals.
We covered multiple bearish signs on Monday, but let’s take a look at one additional – a very important one.
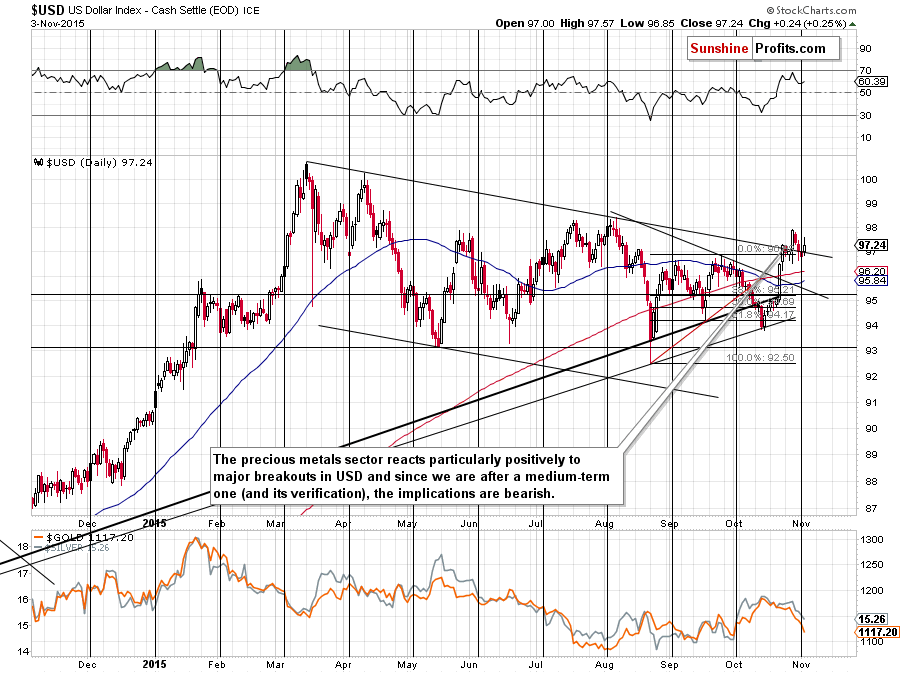
The outlook for the USD Index is bullish (and our short positions in EUR/USD are likely to become even more profitable in the coming weeks) and this has important bearish implications for the precious metals market. We previously wrote that metals and miners reacted mostly to breakouts and breakdowns in the USD Index and it was true also this time – the precious metals sector hesitated while the USD was rallying (but not breaking higher) only to decline when the USD indeed declined and verified the breakout. The USD Index is now right after a cyclical turning point and the small, short-term move preceding it was down, so the implications are bullish for the USD – and bearish for metals and miners.
The resistance line that was just broken is significant and the USD Index can now rally at least to the previous 2015 high. If that happens, metals and miners will be likely affected very negatively. Even without considering multiple bearish signs covered on Monday, this factor alone is something that makes us stick to our short positions despite the risk of a temporary upswing.
Summing up, the medium-term decline in the precious metals sector continues and there are multiple signs that confirm this bearish outlook. This week we saw some signs that could indicate a possible temporary upswing in the coming days, but – even if it materializes – it doesn’t seem that this move would be significant or worth betting on. In our opinion, the current short position continues to be justified from the risk to reward point of view and it seems likely that it will further increase our profitability.
As always, we will keep you – our subscribers – updated.
To summarize:
Trading capital (our opinion): Short position (full) position in gold, silver and mining stocks is justified from the risk/reward perspective with the following stop-loss orders and initial (! – this means that reaching them doesn’t automatically close the position) target prices:
- Gold: initial target price: $1,050; stop-loss: $1,223, initial target price for the DGLD ETN: $98.37; stop loss for the DGLD ETN $62.34
- Silver: initial target price: $12.60; stop-loss: $16.73, initial target price for the DSLV ETN: $96.67; stop loss for DSLV ETN $40.28
- Mining stocks (price levels for the GDX ETF): initial target price: $11.57; stop-loss: $18.13, initial target price for the DUST ETF: $26.61; stop loss for the DUST ETF $9.22
In case one wants to bet on junior mining stocks' prices (we do not suggest doing so – we think senior mining stocks are more predictable in the case of short-term trades – if one wants to do it anyway, we provide the details), here are the stop-loss details and initial target prices:
- GDXJ ETF: initial target price: $16.27; stop-loss: $25.23
- JDST ETF: initial target price: $46.47; stop-loss: $15.58
Long-term capital (our opinion): No positions
Insurance capital (our opinion): Full position
Plus, you might want to read why our stop-loss orders are usually relatively far from the current price.
Please note that a full position doesn’t mean using all of the capital for a given trade. You will find details on our thoughts on gold portfolio structuring in the Key Insights section on our website.
As a reminder – “initial target price” means exactly that – an “initial” one, it’s not a price level at which we suggest closing positions. If this becomes the case (like it did in the previous trade) we will refer to these levels as levels of exit orders (exactly as we’ve done previously). Stop-loss levels, however, are naturally not “initial”, but something that, in our opinion, might be entered as an order.
Since it is impossible to synchronize target prices and stop-loss levels for all the ETFs and ETNs with the main markets that we provide these levels for (gold, silver and mining stocks – the GDX ETF), the stop-loss levels and target prices for other ETNs and ETF (among other: UGLD, DGLD, USLV, DSLV, NUGT, DUST, JNUG, JDST) are provided as supplementary, and not as “final”. This means that if a stop-loss or a target level is reached for any of the “additional instruments” (DGLD for instance), but not for the “main instrument” (gold in this case), we will view positions in both gold and DGLD as still open and the stop-loss for DGLD would have to be moved lower. On the other hand, if gold moves to a stop-loss level but DGLD doesn’t, then we will view both positions (in gold and DGLD) as closed. In other words, since it’s not possible to be 100% certain that each related instrument moves to a given level when the underlying instrument does, we can’t provide levels that would be binding. The levels that we do provide are our best estimate of the levels that will correspond to the levels in the underlying assets, but it will be the underlying assets that one will need to focus on regarding the sings pointing to closing a given position or keeping it open. We might adjust the levels in the “additional instruments” without adjusting the levels in the “main instruments”, which will simply mean that we have improved our estimation of these levels, not that we changed our outlook on the markets. We are already working on a tool that would update these levels on a daily basis for the most popular ETFs, ETNs and individual mining stocks.
Our preferred ways to invest in and to trade gold along with the reasoning can be found in the how to buy gold section. Additionally, our preferred ETFs and ETNs can be found in our Gold & Silver ETF Ranking.
As always, we'll keep you - our subscribers - updated should our views on the market change. We will continue to send out Gold & Silver Trading Alerts on each trading day and we will send additional Alerts whenever appropriate.
The trading position presented above is the netted version of positions based on subjective signals (opinion) from your Editor, and the Tools and Indicators.
As a reminder, Gold & Silver Trading Alerts are posted before or on each trading day (we usually post them before the opening bell, but we don't promise doing that each day). If there's anything urgent, we will send you an additional small alert before posting the main one.
=====
Latest Free Trading Alerts:
The AK Party, founded by Erdogan, won an unexpectedly sweeping election victory. What does it mean for the global economy and the gold market?
Erdogan Wins Election in Turkey
Yesterday, the USD Index extended recent increase and climbed above the level of 97. As a result, EUR/USD declined sharply and dropped under 1.1000. Will we see a test of the recent lows in the coming week?
Forex Trading Alert: USD Index Rebounds
=====
Hand-picked precious-metals-related links:
Gold price: Hedge funds ready to dump 430 tonnes
Why Austria Is Repatriating Gold From London
Glencore raises $900m by selling future silver output
=====
In other news:
Fed policy 'very dependent' on incoming data: Brainard
Draghi: ECB willing and able to act in December
Eurozone economic growth remains 'frustratingly weak'
It's Been a Rough Year for Analysts Forecasting Central-Bank Decisions
=====
Thank you.
Sincerely,
Przemyslaw Radomski, CFA
Founder, Editor-in-chief
Gold & Silver Trading Alerts
Forex Trading Alerts
Oil Investment Updates
Oil Trading Alerts

