

Briefly: In our opinion, a speculative short position (full) in gold, silver and mining stocks is justified from the risk/reward point of view.
Yesterday was a quite volatile session for the precious metals investors and it was very volatile for currency traders. After the Fed announcement, the USD Index declined significantly and even though the reaction that one could have expected was a rally in gold, the yellow metal actually declined. Is the rally over?
It could very well be the case. It seems that to a large extent the rally in precious metals was fueled by weak economic data that was supposed to cause the Fed to become dovish. Nothing like that happened and the rally was stopped, at least in the case of gold. Let’s take a look at the charts, starting with gold (charts courtesy of http://stockcharts.com).
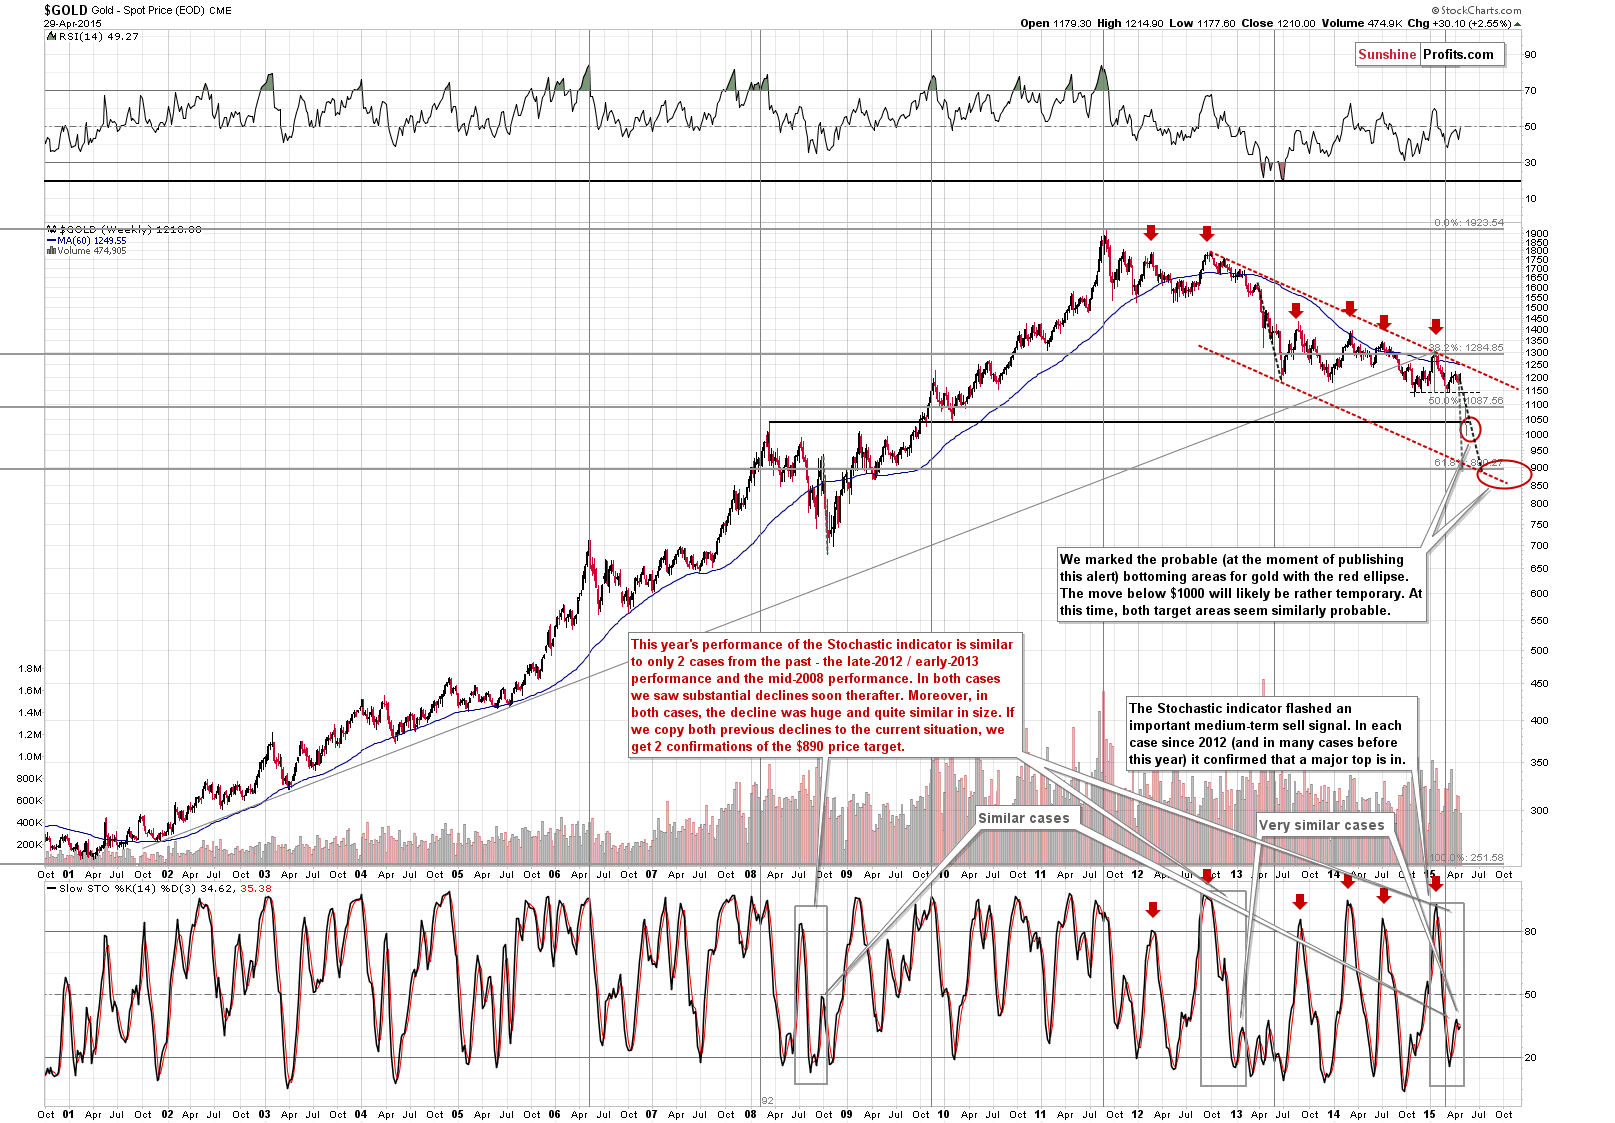
Once again, the long-term chart doesn’t show any changes, but we think it’s worth keeping in mind as it emphasizes that the medium-term trend is down.
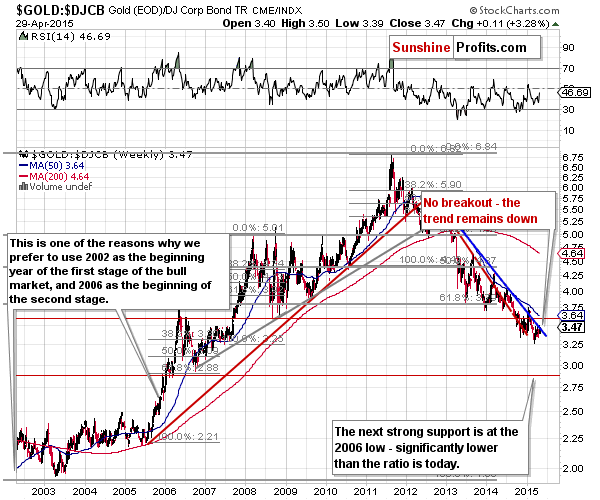
The same goes for the gold to bonds ratio.
We’ll see that the trend remains down and that this week’s move didn’t take the gold to bonds ratio above the declining resistance line. The outlook is still bearish.
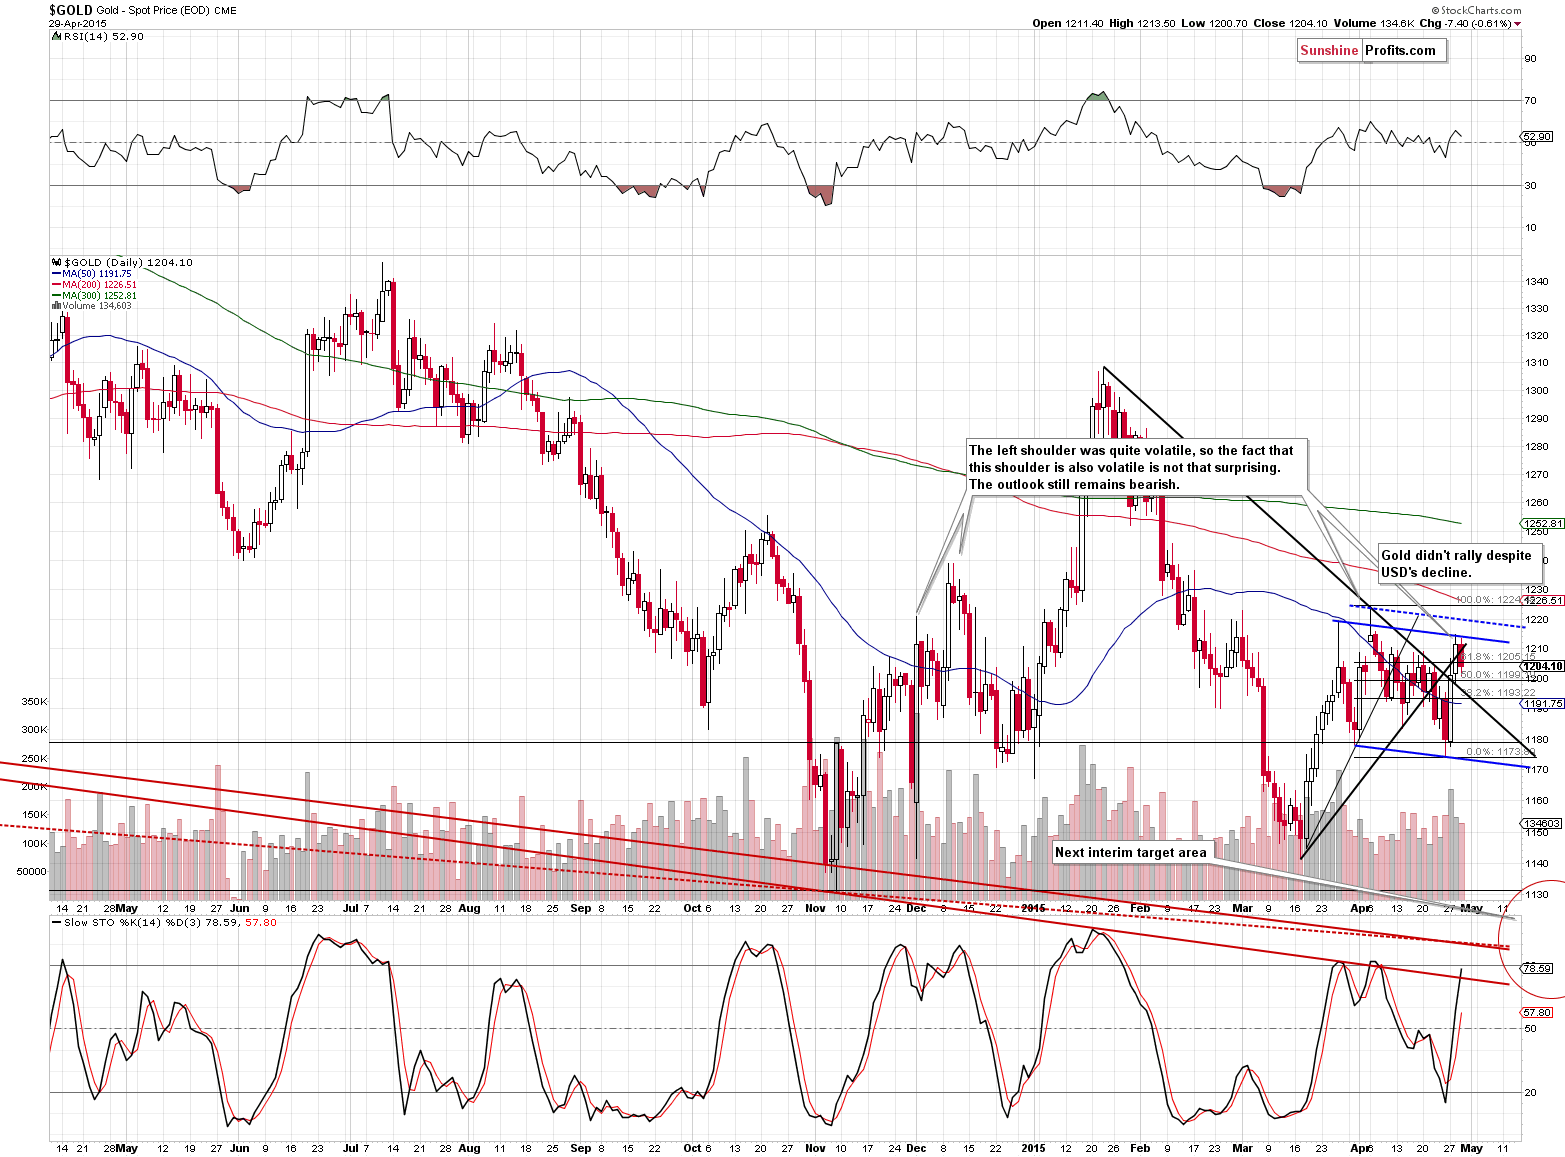
Gold didn’t just refuse to rally in light of the USD’s decline – it actually declined as well. The yellow metal also moved back below the rising support/resistance line and the 61.8% Fibonacci retracement based on the April decline. The very short-term picture deteriorated.
In yesterday’s first alert, we wrote the following:
More importantly, though, gold moved to a resistance line that we get by drawing a small head-and-shoulders pattern based on the March and April highs. It could stop this rally. However, if it doesn’t, then the next resistance is at about $1,220 at the line that is parallel to the line based on late-March and April lows. Consequently, even if gold didn’t top yesterday, it’s not likely to move much higher before it does.
We saw a breakout above the declining resistance line, but at this time it’s unconfirmed and thus it’s only a little bullish.
The small head-and-shoulders pattern is still being formed (the right shoulder of the big head-and-shoulders pattern is a head-and-shoulders pattern on its own as well) – if this continues, we will see gold moving much lower relatively soon.
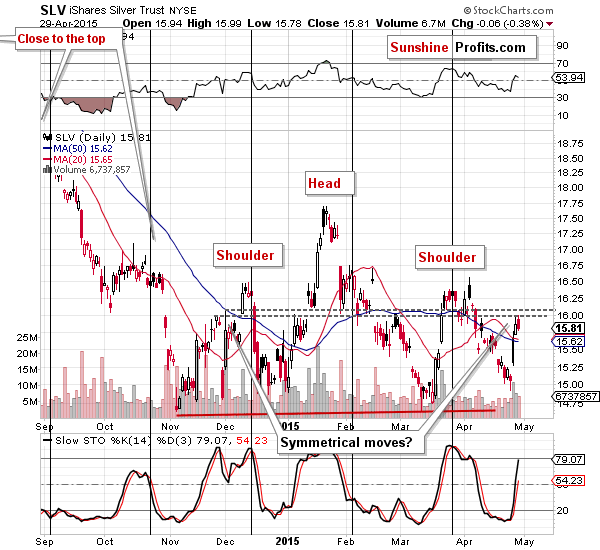
Silver moved lower yesterday (again, despite the declining USD, which is a bearish sign), but not significantly and our previous comments remain up-to-date:
The head-and-shoulders pattern that we discussed previously hasn’t been invalidated this week. In fact, it’s developing in a quite symmetrical way. Please note the sharp decline and comeback that we saw in late November / early December 2014. This move is quite symmetrical to the recent decline and the current rally.
Consequently, the bearish head-and-shoulders formation remains intact and this week’s rally is much less concerning than it seems. Moreover, please note that ther were 2 local tops back in 2014 and we marked them with horizontal dashed lines. Silver could move a bit higher, to the higher top before it declines (and the bearish outlook would not be invalidated by such action).
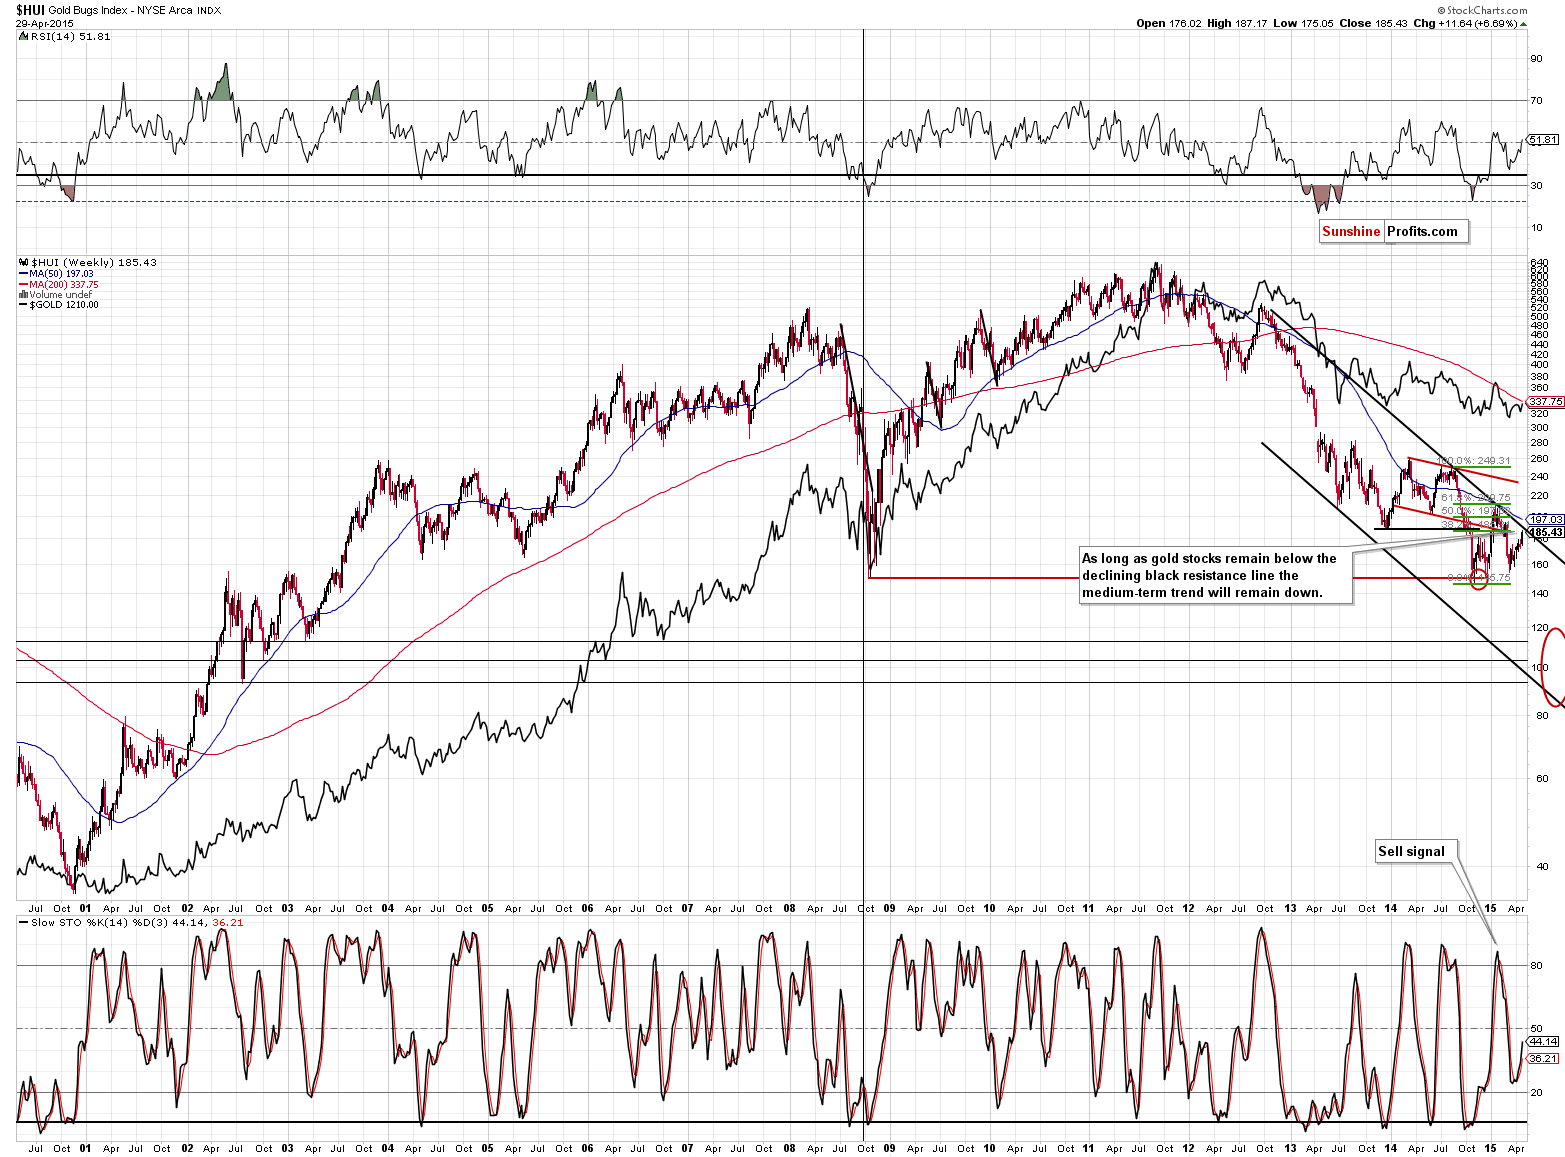
Similarly, the long-term picture featuring the HUI Index didn’t change much:
Gold stocks have a major resistance line just ahead so they are not likely to move significantly either, if at all. The declining long-term resistance line is currently at about 190, so if the rally continues, it’s not likely to move above this level. The medium-term trend remains down.
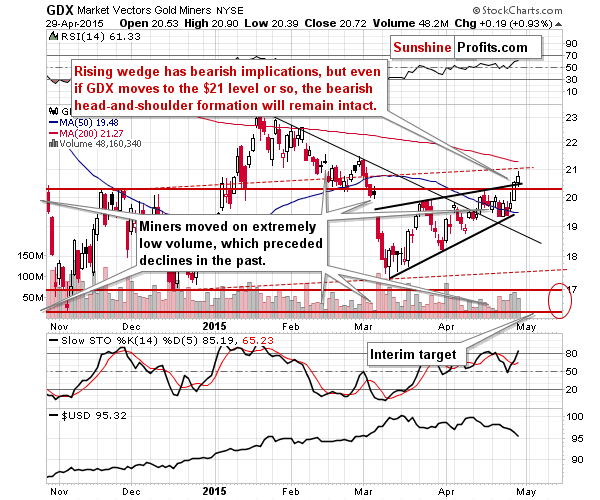
On the short-term chart, we see that miners managed to move higher, but the magnitude of their reaction to the dollar’s slide was rather limited. That’s a bearish sign. Miners moved higher on lower volume, too, which signals that the reversal is probably close.
In yesterday’s first alert, we wrote the following about the above chart:
On a short-term basis we see a small breakout above the November 2014 high, but that’s something that can happen. We previously wrote that the head-and-shoulders pattern could form in 2 ways: either with both shoulders at the same level in absolute terms or at analogous levels in relative terms. The latter means that the right shoulder would be higher than the left one just like it is the case with the December 2014 and March 2015 bottoms. Consequently, even if we see a move to $21, the head-and-shoulders formation and its bearish implications will remain in place.
We saw a move close to the $21 level, but not visibly above it, so the bearish outlook remains in place.
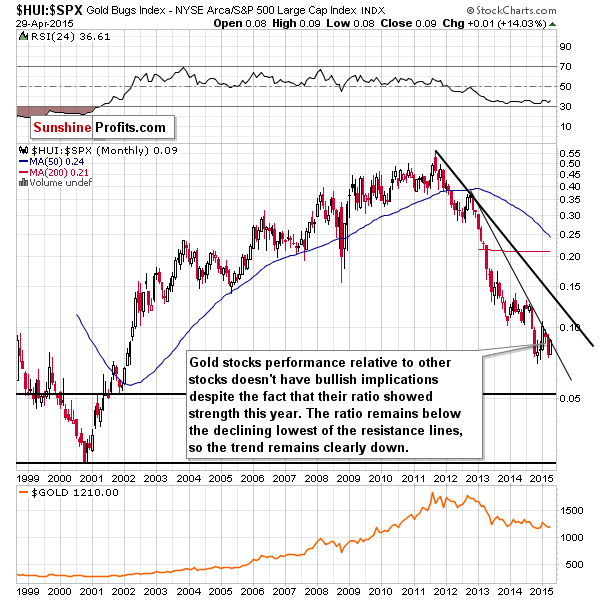
Finally, the long-term chart featuring gold stocks’ performance relative to other stocks confirms the bearish outlook – the medium-term trend simply remains down.
In yesterday’s alert, we emphasized that the decline in the USD Index could be the reason (either direct or indirect as the initial cause would be bullish expectations based on the recent weak economic data) behind the strength of PMs. These comments remain up-to-date:
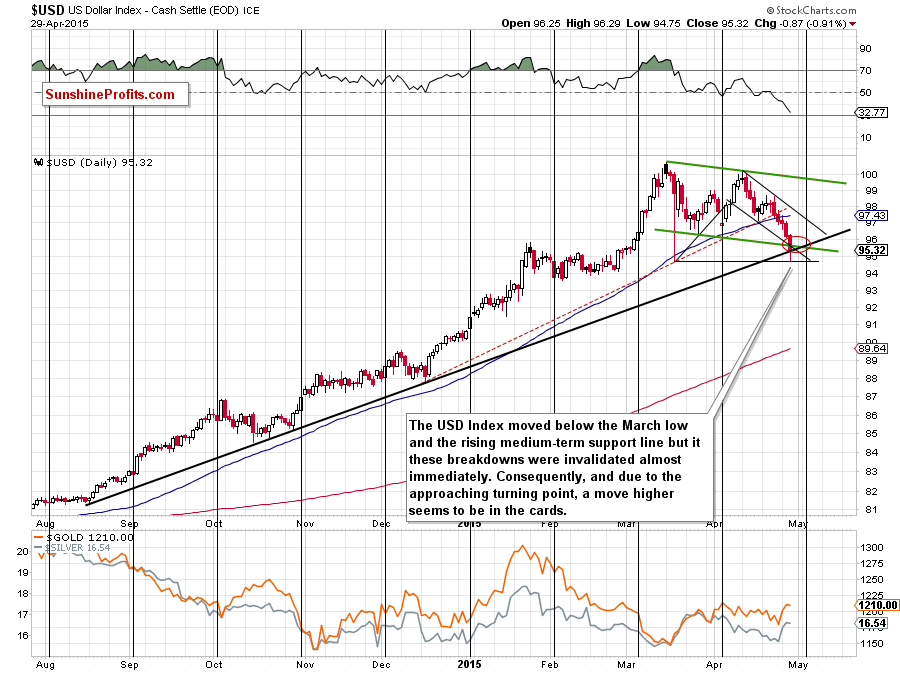
If this was the case, then we have another reason to believe that the days of this rally in PMs are numbered. The USD Index is about to reach the downside target area that is created by 3 support lines: lower borders of 2 declining trend channels and the medium-term support line. Additionally, the cyclical turning point is just around the corner, which makes a turnaround even more likely.
We even saw a move below our target area, but only on an intra-day basis. The USD Index moved below and back to the rising, medium-term support line – there was no true breakdown. Consequently, the outlook for the USD Index didn’t deteriorate for the following weeks and it improved for the short term. The short-term decline can be already over as the important support level was already reached and it seems that the price is about to reverse.
Overall, we can summarize today’s alert in a similar way to what we wrote yesterday:
Summing up, , the medium-term decline is not threatened by this week’s upswing – it seems it was simply delayed (and the USD’s reversal along with gold and silver’s decline suggests that we may not need to wait for much longer). Furthermore, please note that the precious metals sector could decline right away or move a bit higher (we have resistance levels a bit above the current prices of gold, silver and mining stocks) before the decline resumes. Because of the former scenario, we think that it’s justified from the risk/reward point of view to keep the short positions intact. We realize that temporary decreases in profits are not a pleasant thing to watch, but let’s not forget that this trade is not over and that the medium-term outlook hasn’t changed, so the odds are that the profits will become much bigger.
We will keep you – our subscribers – updated.
To summarize:
Trading capital (our opinion): Short (full position) position in gold, silver and mining stocks is justified from the risk/reward perspective with the following stop-loss orders and initial (!) target prices:
- Gold: initial target price: $1,115; stop-loss: $1,253, initial target price for the DGLD ETN: $87.00; stop loss for the DGLD ETN $63.78
- Silver: initial target price: $15.10; stop-loss: $17.63, initial target price for the DSLV ETN: $67.81; stop loss for DSLV ETN $44.97
- Mining stocks (price levels for the GDX ETN): initial target price: $16.63; stop-loss: $21.83, initial target price for the DUST ETN: $23.59; stop loss for the DUST ETN $10.37
In case one wants to bet on lower junior mining stocks' prices, here are the stop-loss details and initial target prices:
- GDXJ: initial target price: $21.17; stop-loss: $27.31
- JDST: initial target price: $14.35; stop-loss: $6.18
Long-term capital (our opinion): No positions
Insurance capital (our opinion): Full position
Please note that a full position doesn’t mean using all of the capital for a given trade. You will find details on our thoughts on gold portfolio structuring in the Key Insights section on our website.
As a reminder – “initial target price” means exactly that – an “initial” one, it’s not a price level at which we suggest closing positions. If this becomes the case (like it did in the previous trade) we will refer to these levels as levels of exit orders (exactly as we’ve done previously). Stop-loss levels, however, are naturally not “initial”, but something that, in our opinion, might be entered as an order.
Since it is impossible to synchronize target prices and stop-loss levels for all the ETFs and ETNs with the main markets that we provide these levels for (gold, silver and mining stocks – the GDX ETF), the stop-loss levels and target prices for other ETNs and ETF (among other: UGLD, DGLD, USLV, DSLV, NUGT, DUST, JNUG, JDST) are provided as supplementary, and not as “final”. This means that if a stop-loss or a target level is reached for any of the “additional instruments” (DGLD for instance), but not for the “main instrument” (gold in this case), we will view positions in both gold and DGLD as still open and the stop-loss for DGLD would have to be moved lower. On the other hand, if gold moves to a stop-loss level but DGLD doesn’t, then we will view both positions (in gold and DGLD) as closed. In other words, since it’s not possible to be 100% certain that each related instrument moves to a given level when the underlying instrument does, we can’t provide levels that would be binding. The levels that we do provide are our best estimate of the levels that will correspond to the levels in the underlying assets, but it will be the underlying assets that one will need to focus on regarding the sings pointing to closing a given position or keeping it open. We might adjust the levels in the “additional instruments” without adjusting the levels in the “main instruments”, which will simply mean that we have improved our estimation of these levels, not that we changed our outlook on the markets. We are already working on a tool that would update these levels on a daily basis for the most popular ETFs, ETNs and individual mining stocks.
Our preferred ways to invest in and to trade gold along with the reasoning can be found in the how to buy gold section. Additionally, our preferred ETFs and ETNs can be found in our Gold & Silver ETF Ranking.
As always, we'll keep you - our subscribers - updated should our views on the market change. We will continue to send out Gold & Silver Trading Alerts on each trading day and we will send additional Alerts whenever appropriate.
The trading position presented above is the netted version of positions based on subjective signals (opinion) from your Editor, and the Tools and Indicators.
As a reminder, Gold & Silver Trading Alerts are posted before or on each trading day (we usually post them before the opening bell, but we don't promise doing that each day). If there's anything urgent, we will send you an additional small alert before posting the main one.
=====
Latest Free Trading Alerts:
On Tuesday, crude oil gained 0.58% as ongoing tensions in Yemen and a weaker greenback supported the price. Despite this increase, light crude verified earlier breakdown under its support line. What does it mean for the commodity?
Oil Trading Alert: Verification of Breakdown
=====
Hand-picked precious-metals-related links:
CPM GROUP RELEASES SILVER YEARBOOK 2015
GFMS Q1 update confirms China as world No. 1 gold consumer
New highly sensitive method for detecting gold at drill sites
=====
In other news:
Fed's downgrade of economic outlook signals longer rate hike wait
Euro-Area Bonds Slump for Second Day, Extending $61 Billion Loss
Gross: Why Fed will have problems raising rates
Is the Kiwi about the hit the skids?
Goldman and IDG put $50 million to work in a bitcoin company
=====
Thank you.
Sincerely,
Przemyslaw Radomski, CFA
Founder, Editor-in-chief
Gold & Silver Trading Alerts
Forex Trading Alerts
Oil Investment Updates
Oil Trading Alerts

