

Please log in to read the entire text.
If you don’t have a login yet, please select your access package.
The global debt is rising at an alarming pace. According to the IMF, the median debt in 2021 is projected to jump by about 17 percent of GDP in advanced economies, 12 percent in emerging economies, and 8 percent in low-income countries.
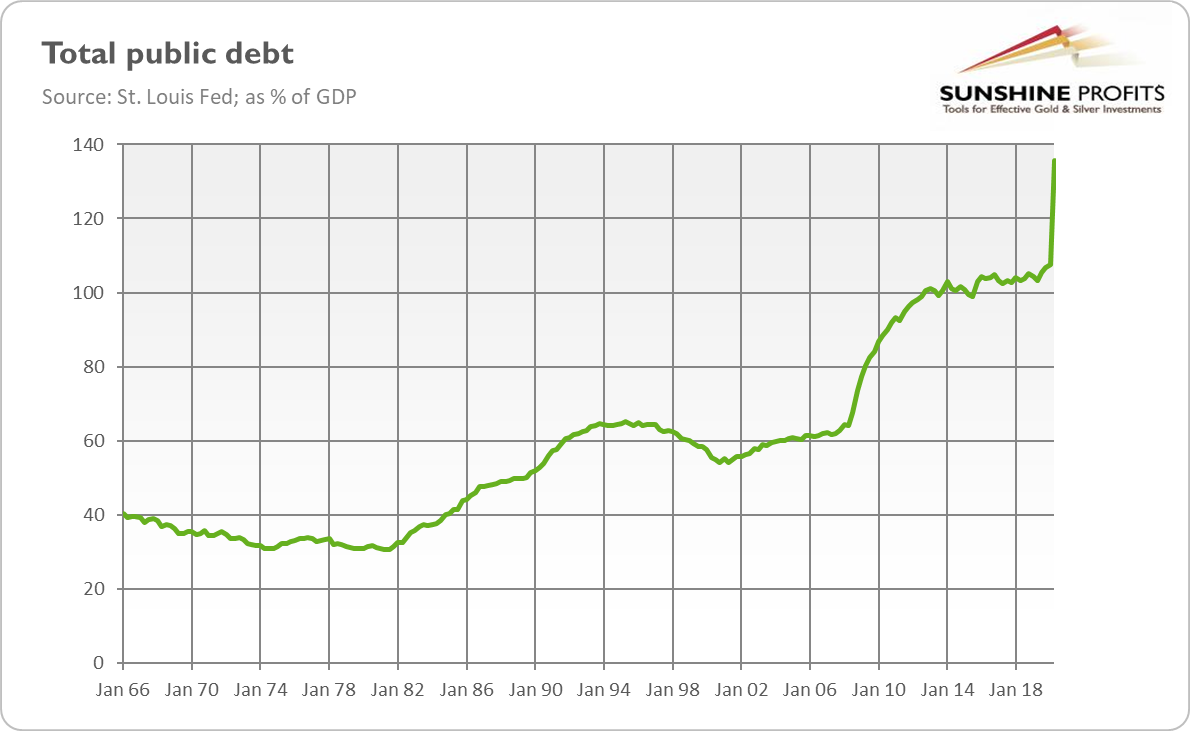
In particular, during the second quarter of 2020, the total US public debt has soared from 108 to 136 percent of the GDP, amid the massive spending in response to the pandemic. As the chart below shows, this is a record level in peacetime. It’s also among the highest debt-to-GDP ratios in the developed world: the US is behind only Japan, Greece, Italy, and Portugal. So, it seems that it’s modern monetary theory and not the coronavirus that has infected Washington, as nobody seems to worry about who will pay for all this spending and debt.
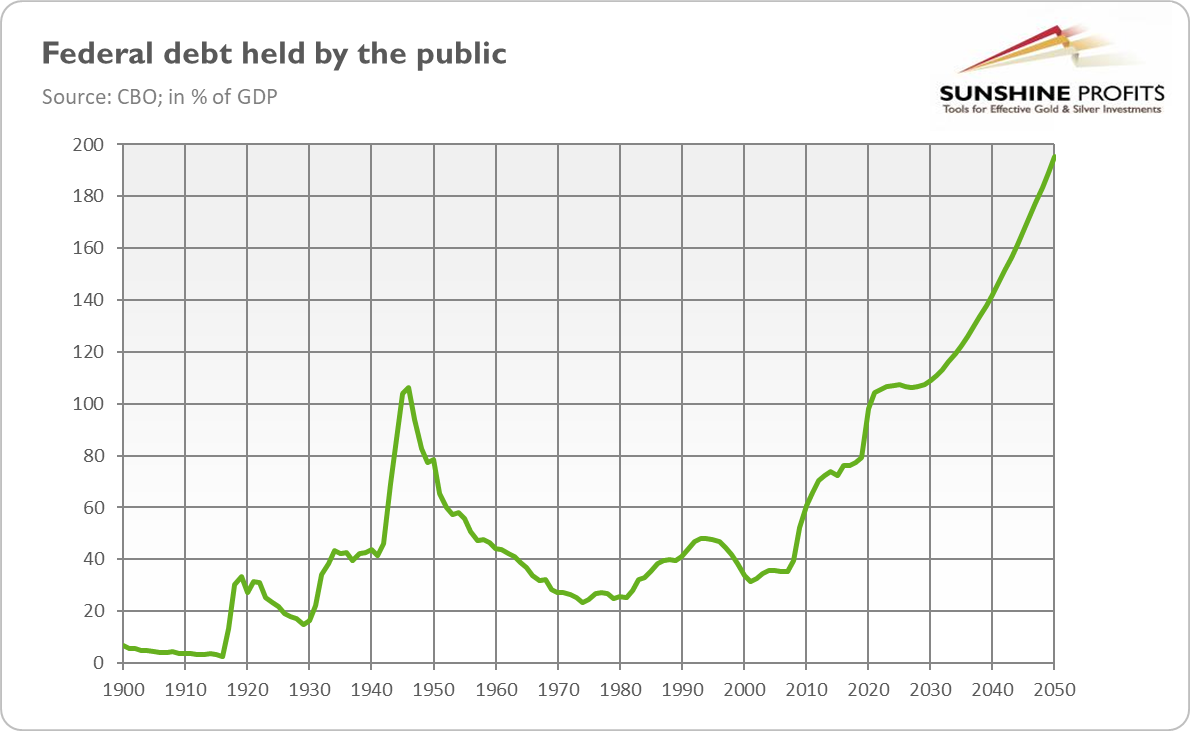
Most importantly, the federal debt held by the public is also skyrocketing. As the chart below shows, it is projected by the Congressional Budget Office to jump from 79 percent last year to 98 percent of GDP in 2020, to 107 percent by 2023 (the highest level in the history of the United States) and to soar even further, to 195 percent of GDP by 2050. So, the ballooning debt is not just a temporary problem caused by the epidemic – it’s an important structural problem of the American economy.
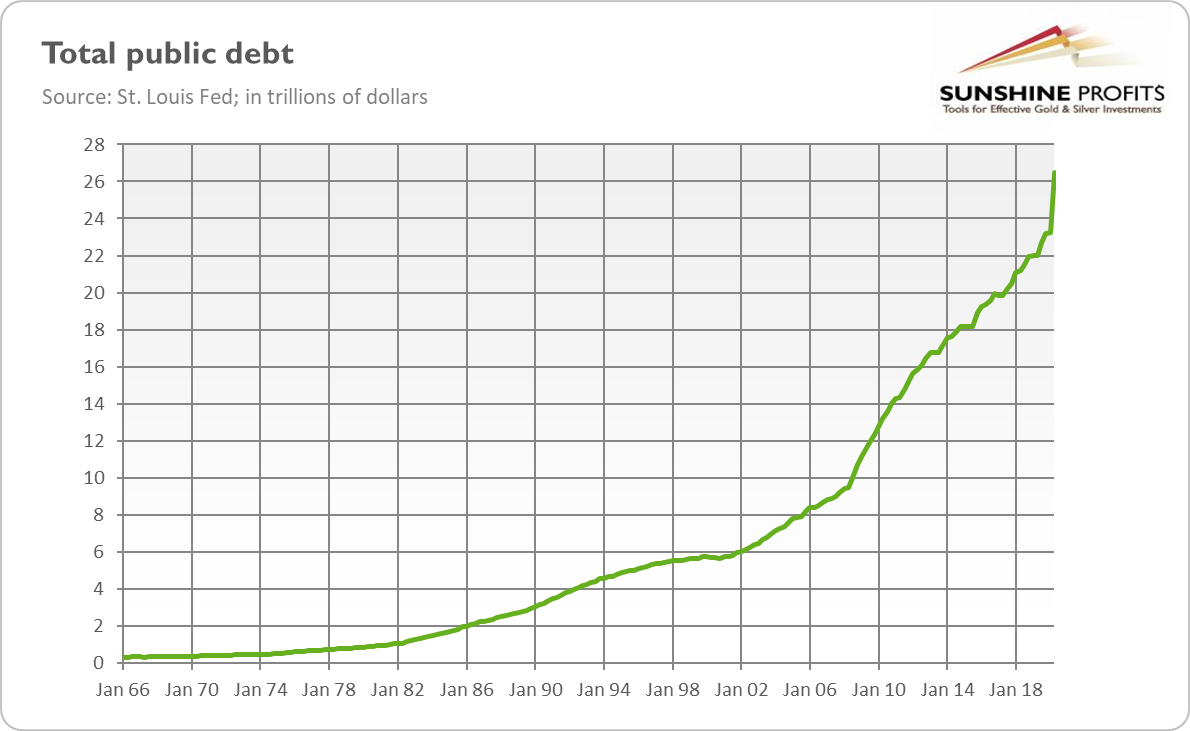
However, this is not the end of the government spending spree and ballooning federal debt. In the Q3, the budget deficit increased by $237 billion and in the upcoming months it is projected to soar even further. After all, both Republicans and Democrats want to increase the fiscal stimulus. The last White House offer stands at $1.8 trillion. If accepted, the total public debt would spike from the current $26.5 trillion in the second quarter of 2020 (see the chart below) to at least $28.5 trillion, or about 143 percent of the GDP, in the very near future.
How will this mammoth spike in the public debt affect the gold prices? That’s a good question! Let’s analyze the past relationship between these two variables to examine this. The chart below does not provide us with a clear answer. We can see that gold reacted positively to the rise in public debt in the 2000s and in 2020, but it failed to shine in the 1980s and early 1990s, when the federal indebtedness also increased.
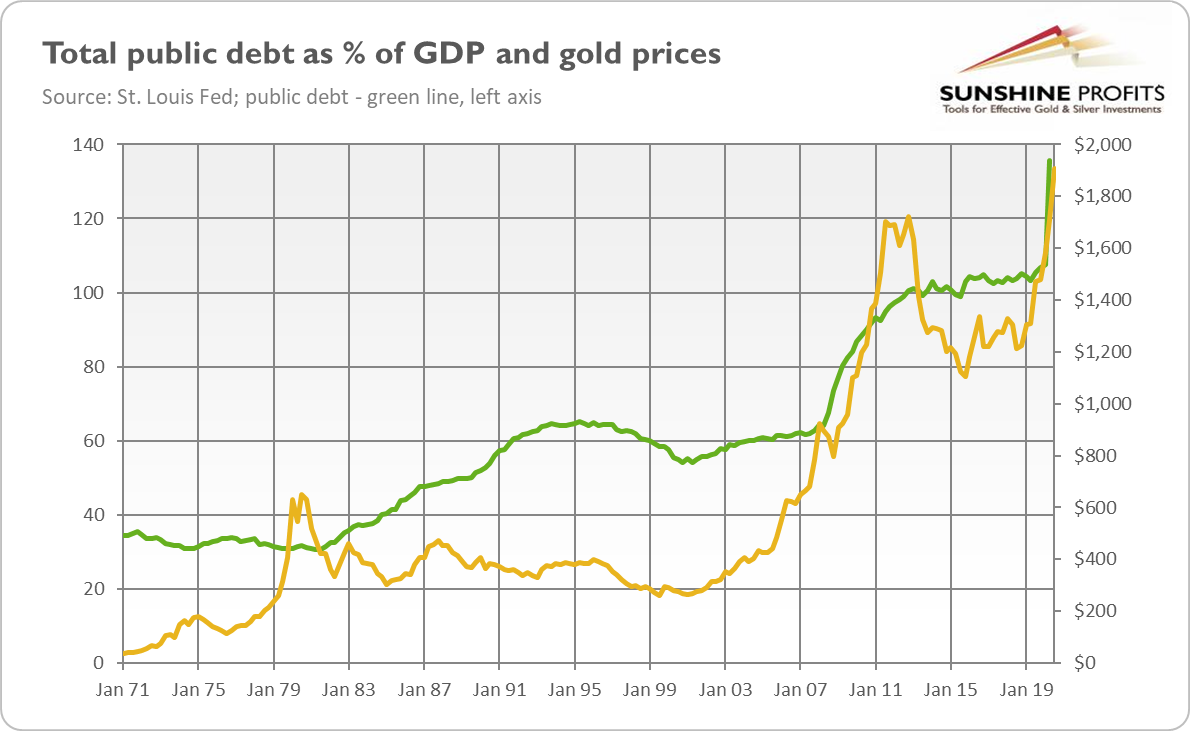
However, the correlation between the price of the yellow metal and the total public debt as a percentage of the GDP in Q1 1971 to Q2 2020 is significantly positive, as the correlation coefficient amounts to 0.89. This positive link comes mainly from the ballooning public debt in the aftermath of the Great Recession. The bailouts and fiscal stimulus provided by Bush and Obama boosted the public debt from 62 percent before the financial crisis to above 100 percent in 2012. In the same period, the price of gold skyrocketed from $680 to $1,722. And when the trajectory of the public debt has stabilized somewhat around 100-102 percent of GDP, the yellow metal entered a bear market.
But was it just a coincidence, a correlation, or a causal relationship? Well, it’s a difficult question. You see, the soaring American public debt raises worries about the sovereign debt crisis, the future value of the greenback and rising inflation. Thus, the concerns about the ballooning public debt make investors buy gold, which is considered to be both an inflation hedge and a safe-haven asset.
On the other hand, investors shouldn’t forget about the broader macroeconomic context, as soaring public debt never occurs on its own. Actually, the biggest spikes happened as a response to economic recessions (in 2007-2009 and in 2020). The public spending spree after the Great Recession coincided with the easy monetary policy, the decline in the real interest rates, and the U.S. dollar depreciation. As well, gold did not start its bearish trend only because the level of public debt stabilized somewhat, but rather because confidence returned to the marketplace, investors started to expect normalization of the monetary policy, the real interest rates begun to rise, and the greenback entered its bull market.
It means that gold should benefit from the current macroeconomic environment. The ballooning public debt should add to the concerns about the American economy and support the safe-haven demand for gold. Mainstream economists believe that given that the interest rates and debt-servicing costs are low and the US dollar remains a world reserve currency, the sovereign debt crisis is not likely. Well, last year pundits thought similarly that the pandemic was unlikely. And here we are…
Hence, rising indebtedness alone would probably be too little to make gold rally without other fundamental drivers being supportive for the yellow metal. The other side of this coin is that even when the U.S. public debt stabilizes somewhat (which is not very likely in the near future), gold does not have to plunge if other factors remain fundamentally positive.
Thank you for reading today’s free analysis. If you enjoyed it, and would you like to know more about the links between the economic outlook, the current (past?) crisis and the gold market, we invite you to read the November Gold Market Overview report. Please note that in addition to the above-mentioned free fundamental gold reports, and we provide premium daily Gold & Silver Trading Alerts with clear buy and sell signals. We provide these premium analyses also on a weekly basis in the form of Gold Investment Updates. In order to enjoy our gold analyses in their full scope, we invite you to subscribe today. If you’re not ready to subscribe yet though and are not on our gold mailing list yet, we urge you to sign up. It’s free and if you don’t like it, you can easily unsubscribe. Sign up today!
Arkadiusz Sieron, PhD
Sunshine Profits: Analysis. Care. Profits.
-----
Disclaimer: Please note that the aim of the above analysis is to discuss the likely long-term impact of the featured phenomenon on the price of gold and this analysis does not indicate (nor does it aim to do so) whether gold is likely to move higher or lower in the short- or medium term. In order to determine the latter, many additional factors need to be considered (i.e. sentiment, chart patterns, cycles, indicators, ratios, self-similar patterns and more) and we are taking them into account (and discussing the short- and medium-term outlook) in our Gold & Silver Trading Alerts.

