

Please log in to read the entire text.
If you don’t have a login yet, please select your access package.
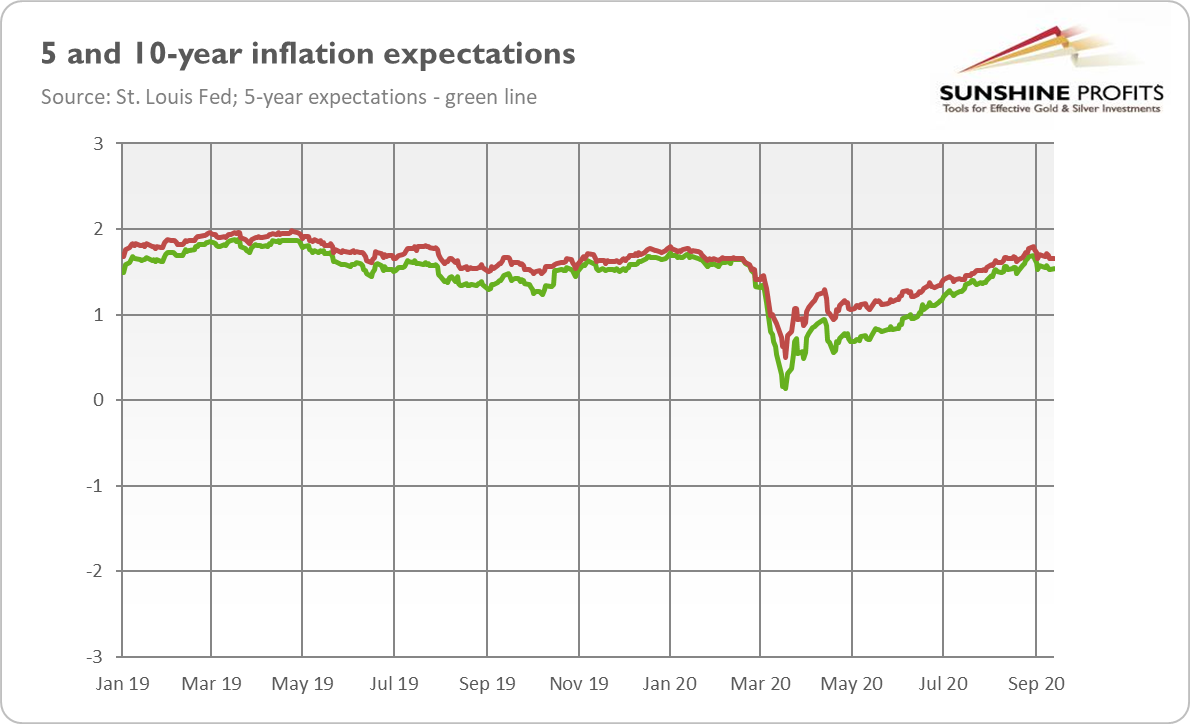
Inflation is back. OK, not inflation, but inflation expectations. As the chart below shows, they plunged during the coronavirus crisis, but they have already recovered. Currently, and based on the inflation-protected Treasury yields, Mr. Market expects that inflation will be, on average, 1.5 percent in the next five years and 1.7 percent in the next ten years.
Meanwhile, the real bond yields have continued their downward trend. As the chart below shows, the yields of 5 and 10-year Treasury Inflation-Protected Securities plunged from around zero in January to around -1.15 in mid-September.
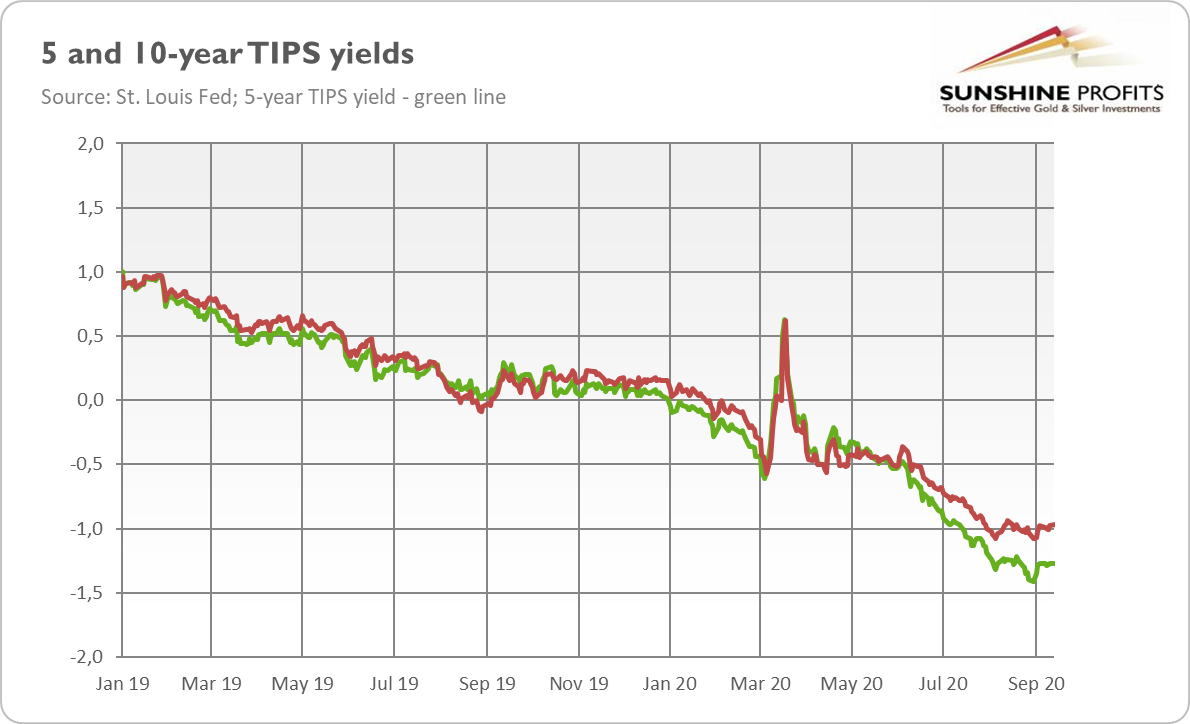
Do you already see the implications? Yes, you are right. The charts above show the rebound in inflation expectations and the sharp decline in real interest rates. Such a combination indicates that stagflation is coming. Or, at least, that investors worry about the simultaneous occurrence of stagnation and inflation.
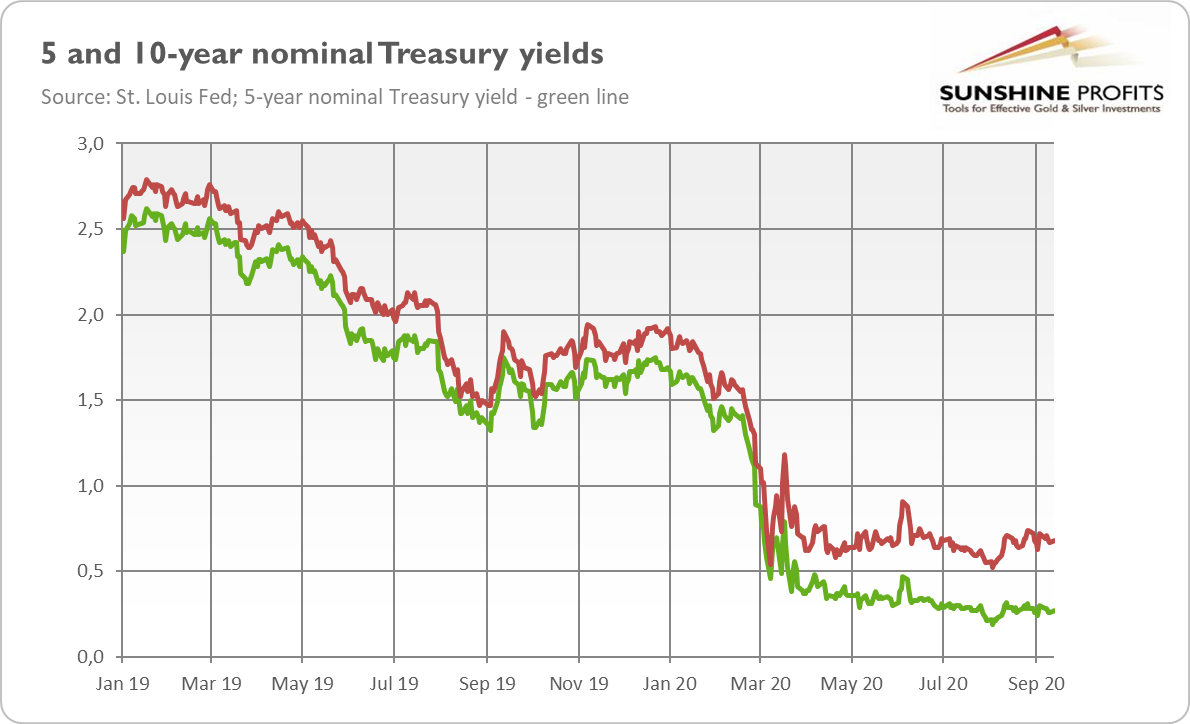
To understand this better, let’s take a look at the chart below. It presents nominal Treasury bond yields. As you can see, they have remained in a sideways trend since April, even though inflation expectations have rebounded. So, the only reason why nominal interest rates did not increase in tandem with inflation expectations is that the growth expectations have declined. In other words, investors expect both economic slowdown and a rebound in inflation to occur simultaneously, i.e., stagflation.
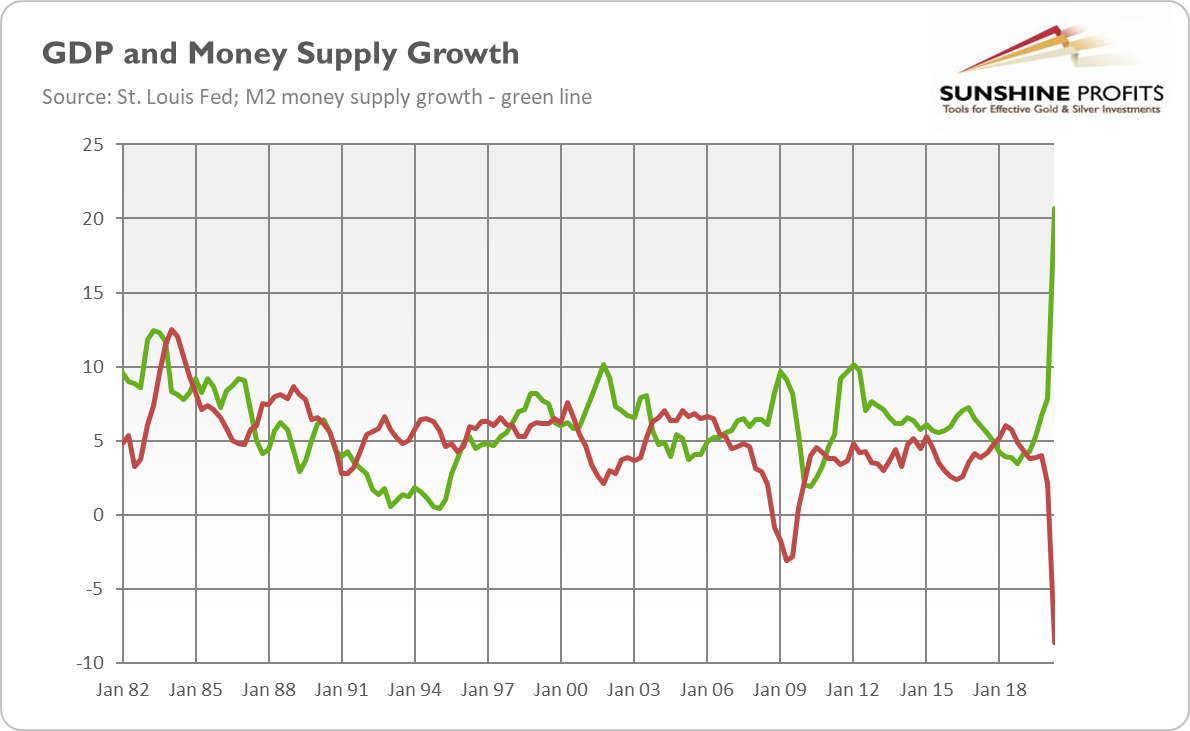
These expectations are fueled by the coronavirus crisis and following supply-chain disruptions and shortages, the Fed’s new monetary regime that allows for overshooting the inflation target, and the significant expansion in the public debt and the broad money supply. Driven by the quantitative easing and the increase in bank deposits, the M2 money supply growth pace has increased from about 7 percent before the pandemic to about 24 percent in July, as the chart below shows.
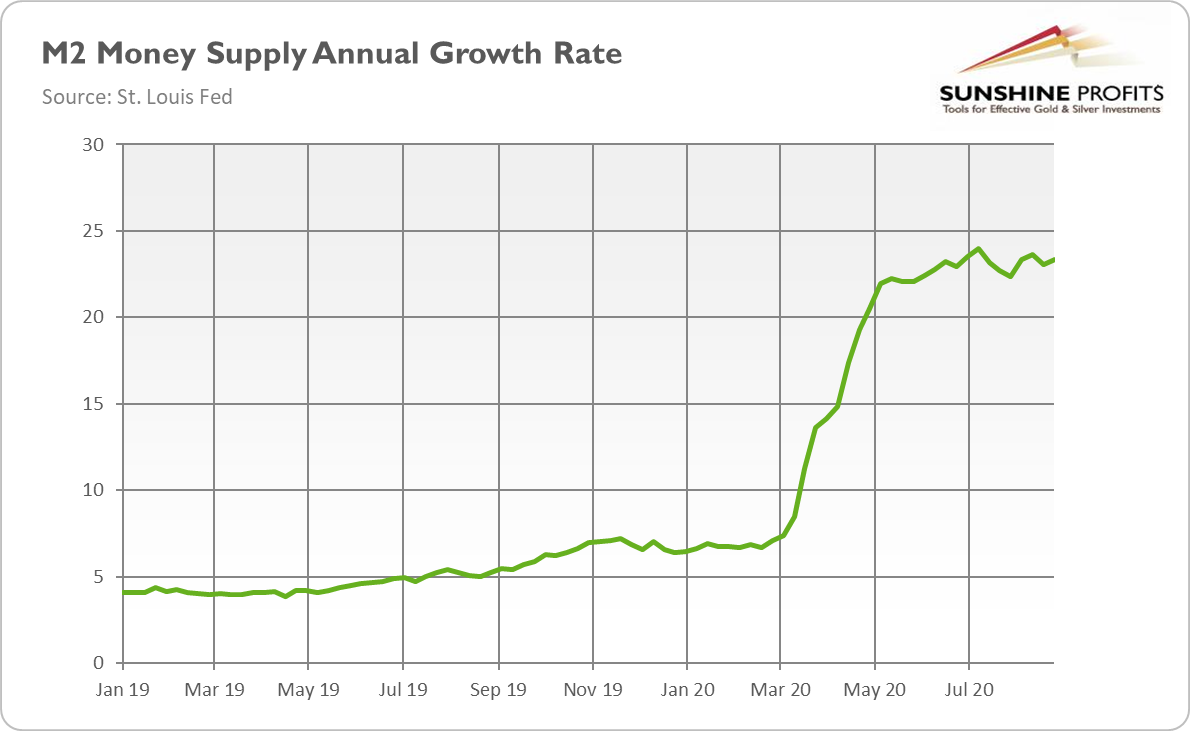
The unprecedented spike in the broad money supply – and not only in the monetary base controlled by the central bank – is the reason why the coronavirus crisis was more inflationary than the Great Recession, and it can translate into higher price inflation in the future.
However, the money supply acceleration has been matched by a plunge in the velocity of money or the number of times a dollar is spent in the economy (see the chart below). So maybe there is nothing to worry about?
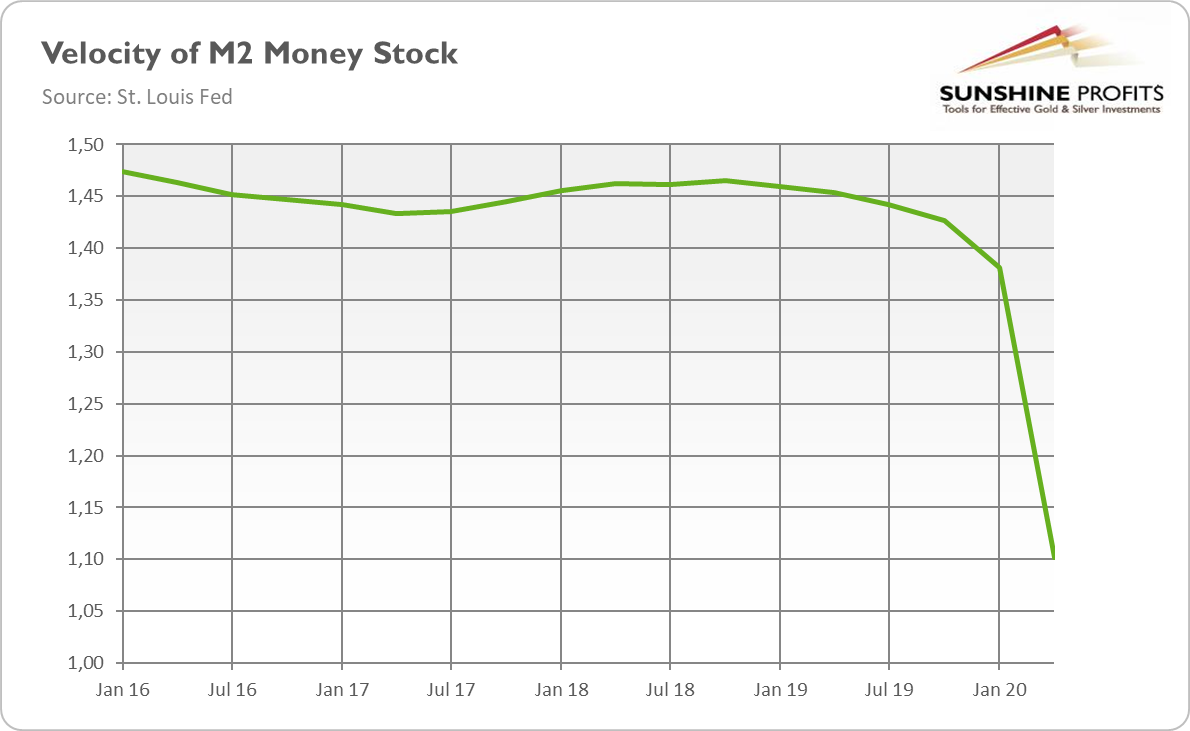
Actually, there is! You see, the velocity of money is a vague concept. It is defined as a nominal GDP divided by the money supply. So, it does not have a life of its own, and it is not defined independently of the other terms in the famous equation of exchange: M*V = GDP = P*(real GDP).
Hence, the velocity of money had to decline simply because the economy shrank, while the money supply expanded during the Great Lockdown (see the chart below). But it means that the money supply has been growing faster than the economy, which is a recipe for inflation, which is described precisely as „too much money chasing too few goods”.
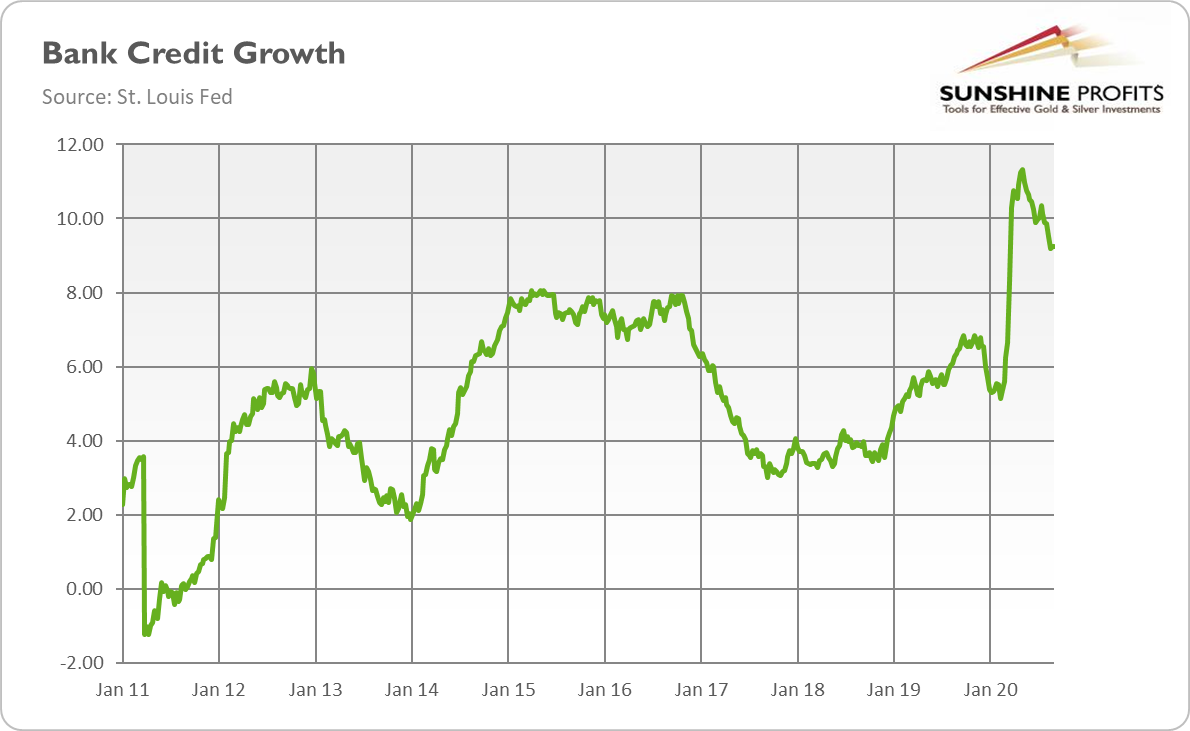
And please note that in the aftermath of the Great Recession, the ballooning Fed’s balance sheet and monetary base were accompanied by slowing M2 money supply growth. Because of the financial crisis, loan growth declined sharply. In contrast, today, the banking system is in a healthier position, and commercial banks substantially expanded the credit creation.
Of course, the rise in the broad money supply was partially a result of companies’ drawing down on pre-arranged credit lines, not the irrational exuberance of the commercial banks (although government guarantees make banks to provide loans to many sub-marginal companies), but the end result is the same: the rapid expansion in the bank credit and the broad money supply. As the chart below shows, the total bank credit growth accelerated from about 5.3 at the beginning of the year to 11.3 percent in May. Hence, the risk of inflation is higher than in the aftermath of the economic crisis of 2008. It makes the current macroeconomic environment even better for gold.
To sum up, although the increase in the mere monetary base does not have to translate into higher inflation, the record fast expansion in the broad money supply is disturbing, and it increases the risk of inflation or stagflation sometime in the future. The supply chain distortions, ballooning federal debt, and more dovish Fed, which is eager to accept inflation above its 2-percent target for some time, also add to this risk. As higher inflation increases the appeal of gold as an inflation hedge, and decreases the real interest rates, the heightened stagflationary risk should support the gold prices.
Of course, the coronavirus crisis has also resulted in a massive drop in GDP growth and an increase in spare capacity that can keep consumer price inflation low for some time. However, when the economy recovers somewhat, while the large monetary and fiscal stimulus program continues, the broad money supply's unprecedented fast growth could end up being inflationary after a certain lag. When gold sniffs out the smell of inflation, it should shine.
Thank you for reading today’s free analysis. If you enjoyed it, and would you like to know more about the links between the economic outlook, the current (past?) crisis and the gold market, we invite you to read the October Gold Market Overview report. Please note that in addition to the above-mentioned free fundamental gold reports, we provide premium daily Gold & Silver Trading Alerts with clear buy and sell signals. We provide these premium analyses also on a weekly basis in the form of Gold Investment Updates. In order to enjoy our gold analyses in their full scope, we invite you to subscribe today. If you’re not ready to subscribe yet though and are not on our gold mailing list yet, we urge you to sign up. It’s free and if you don’t like it, you can easily unsubscribe. Sign up today!
Arkadiusz Sieron, PhD
Sunshine Profits: Analysis. Care. Profits.
-----
Disclaimer: Please note that the aim of the above analysis is to discuss the likely long-term impact of the featured phenomenon on the price of gold and this analysis does not indicate (nor does it aim to do so) whether gold is likely to move higher or lower in the short- or medium term. In order to determine the latter, many additional factors need to be considered (i.e. sentiment, chart patterns, cycles, indicators, ratios, self-similar patterns and more) and we are taking them into account (and discussing the short- and medium-term outlook) in our Gold & Silver Trading Alerts.

