

Briefly: gold and the rest of the precious metals market are likely to decline in the next several weeks/months and then start another powerful rally. Gold’s strong bullish reversal/rally despite the USD Index’s continuous strength will likely be the signal confirming that the bottom is in.
Welcome to this week's Gold Investment Update, which we're publishing just before Christmas arrives. Predicated on last week’s price moves, our most recently featured outlook remains the same as the price moves align with our expectations. On that account, there are parts of the previous analysis that didn’t change at all in the earlier days, which will be written in italics.
Additionally, please make sure to check out the dedicated section to leveraged ETFs as well as the updated publication schedule for the Holidays (found near the bottom of today's Gold Investment Update).
Yesterday’s session took the precious metals sector higher, but the way in which gold, silver, and mining stocks rallied was in tune with the previous patterns and in tune with my previous comments.
Let’s take a closer look.
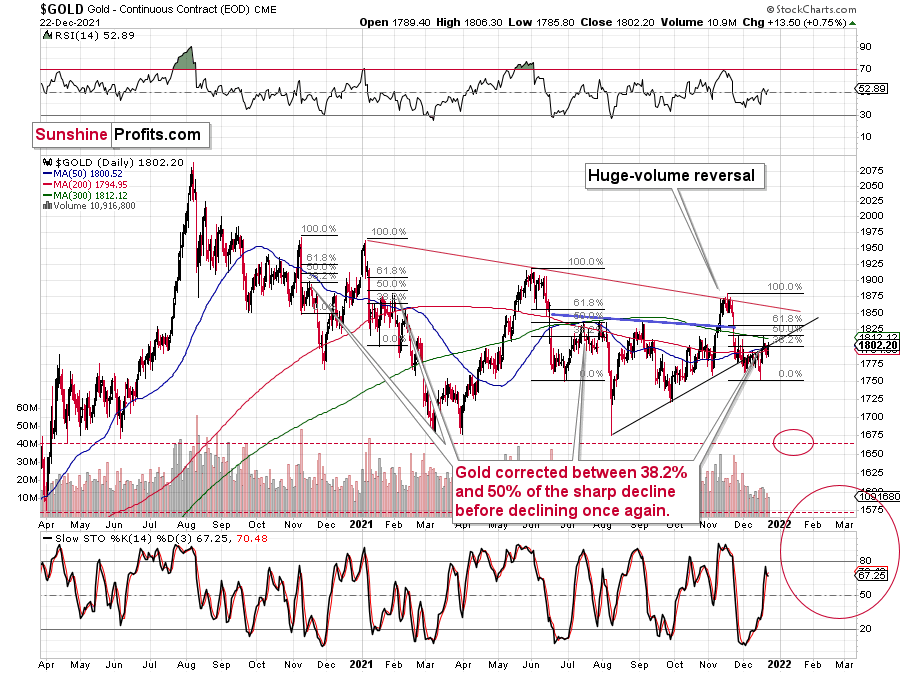
Gold ended the day about $13 higher, but the closing price was still practically right at the rising resistance line. The implications continue to be bearish, as the previous attempt to break higher was invalidated, and gold corrected about 50% of the preceding decline (and it moved very close to its 50-day moving average), just like it did in mid-2021 and early-2021 before sliding once again.
Please note that in early 2021 and mid-2021 gold formed two / three individual tops before sliding. Consequently, yesterday’s and today’s pre-market attempt to move higher doesn’t change much, if anything.
The analogy to the precious bearish patterns remains intact.
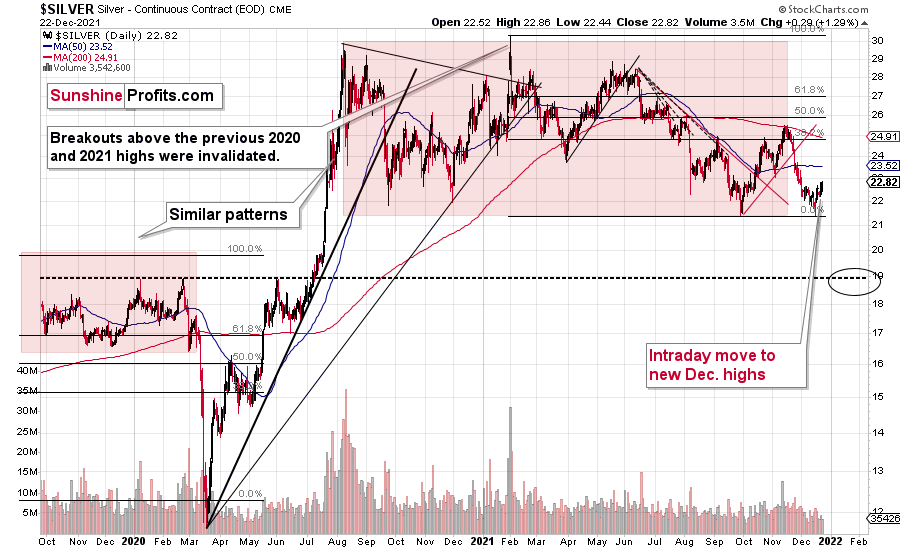
Silver ended the session higher, at new monthly highs. Gold didn’t move to new monthly highs, so silver outperformed gold on an immediate-term basis, and my previous comments on that remain up-to-date:
This is very interesting, because silver is showing strength and weakness at the same time. How is that possible – one might ask.
It’s the same as with trends or forecasts for silver. They can be bearish and bullish simultaneously, depending on the time frame that one focuses on. For example, I think that the very long-term outlook for silver is extremely bullish, but I also think that the medium-term trend is bearish. The short-term trend is also bearish, but the immediate-term trend is bullish. So, am I bullish or bearish on silver? Answering this without specifying the time frame is bound to create misunderstandings.
Getting back to silver’s relative performance, it’s been weak when taking into account the last couple of weeks – please note how little of the recent monthly decline silver has corrected compared to gold. Gold recently moved to its October highs, but silver topped a few dollars below its October high. What does it tell us? Silver is likely to fall hard, also compared to gold, probably in tune with the general stock market – similarly to what happened in 2008 and 2020. That’s the same kind of performance that we saw in the very early parts of the huge declines.
At the same time, silver is strong compared to gold on an immediate-term basis. This means that we’re likely at or close to a short-term top. Why? Because that’s what the precious metals market tends to do when it’s topping, and it’s one of the great gold trading tips to monitor the PM market for these situations. One could debate why this is really the case, and there are quite a few theories (the silver market is smaller, so more prone to sudden moves, etc.), but the point is that it simply works. Please note that some things – like the Pareto principle (a.k.a. the 20:80 rule) – can work and be very useful, even if it’s not clear why they work.
Consequently, it seems that the days of this short-term corrective upswing are either over or about to be over, and that the precious metals sector will return to its medium-term decline any day now.
“But what about mining stocks’ rally?” – one might ask.
Well, it was yet another day when the miners’ daily rally was smaller than the one that we saw in silver.
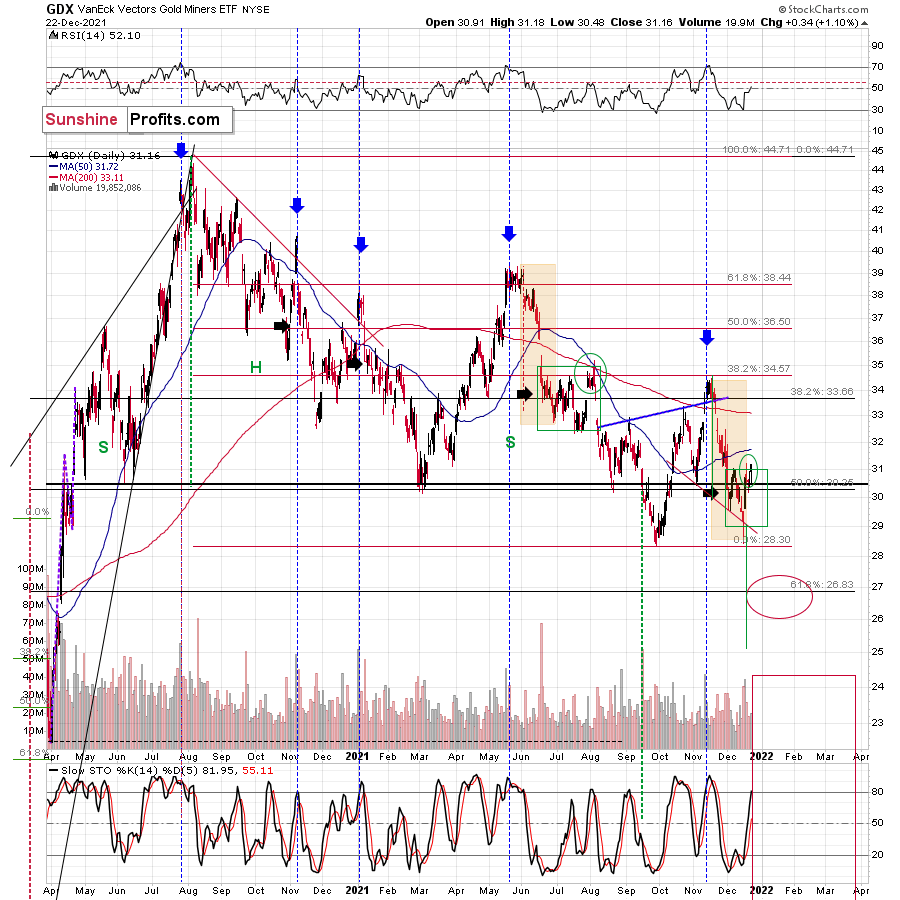
Moreover, unlike silver, mining stocks didn’t move to new intraday monthly highs, and that they are behaving very much in tune with what they did in late July and early August at the situation that I had marked as similar to the current one several days ago. I marked both situations with green rectangles and green ellipses.
And if mining stocks are repeating their performance that preceded the declines, then why should this movement be considered as something bullish? It shouldn’t.
And what’s happening in the USD Index?
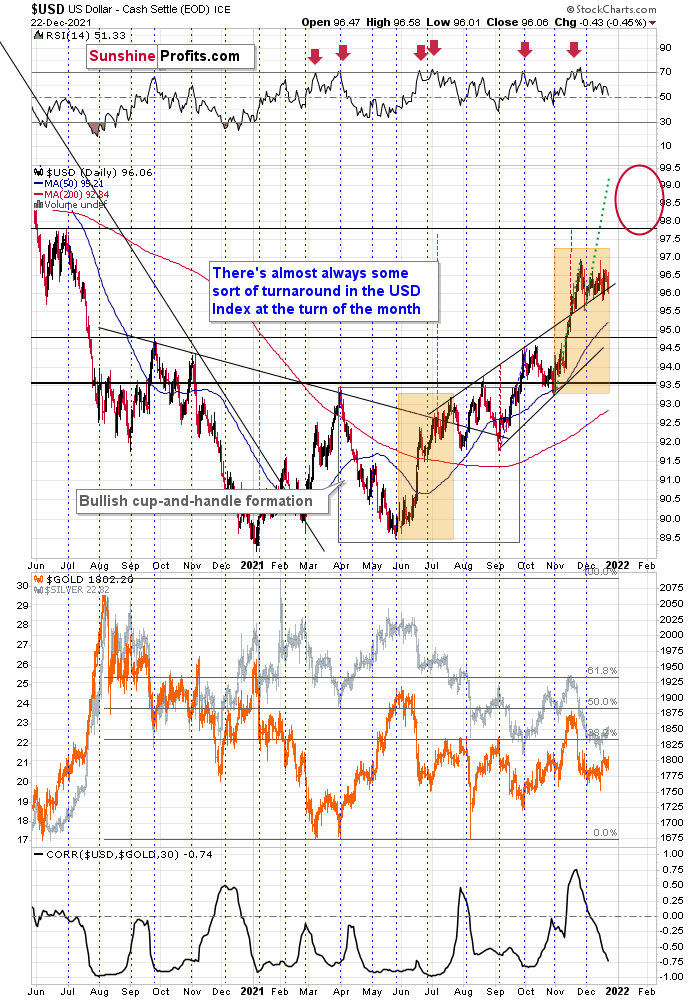
In short, not much. The USD Index is moving sideways, consolidating after a powerful short-term rally.
I previously wrote about the mid-2020 highs being the likely target for the next short-term upswing, but after seeing this consolidation taking place for so long, I’m no longer that certain. You see, consolidations cause the emotions to cool down, and people to accept a certain price range as “normal” instead of being “excessive”. Therefore, when things get moving (a new trend starts), the price can get to “new excessive” levels, thus becoming overbought once again, before topping.
The thing is that since the consolidation was so broad (from the short-term point of view), it seems that a rally of less than a single index point after the previous 2021 high, might not be enough to make the situation “too excessive” once again.
One technique that aims to detect how high a price could go after a consolidation is to check how big the rally preceding the consolidation was and then to expect this kind of move to be repeated. As with most technical techniques, there’s no clear logical explanation behind it, other than it’s based on emotionality and that it’s been observed to work in this way over and over again.
I applied the above-mentioned technique using green, dotted lines. It points to the next target being above 99. So, while it’s unclear if the USD Index will top at the above level, or at the earlier target of about 98, I’m broadening the target area for the next USDX top.
This doesn’t change anything for gold, though, which is still likely to form a short-term bottom close to its previous 2021 lows.
The USD Index moved lower yesterday, stopping at its rising support line. Depending on the chart provider and scale used, this line was either not broken, or broken very slightly (not as much as it was on Dec. 16 and Dec. 17, after which it rallied once again). Consequently, the bullish implications for the USD Index remain intact for the following weeks, which has bearish implications for the precious metals sector.
Having said that, let’s take a look at the markets from a more fundamental angle.
A Bridge Too Far
With Fed officials increasingly hawked up, the narrative shifted from a tapering of asset purchases to potential interest rate hikes. And now, with whispers of the Fed plotting to normalize its balance sheet, questions have arisen over the potential impact on the PMs.
To explain, I wrote on Dec. 20:
After admitting that inflation “is alarmingly high, persistent, and has broadened to affect more categories of goods and services,” Waller implored the Fed to sell some of its bond holdings.
For context, tapering means that bonds are purchased at a slower pace or not at all. However, even zero purchases result in the Fed’s nearly $8.76 trillion in bond holdings remaining constant. Conversely, if the Fed reduces its balance sheet by selling bonds to private investors, it’s akin to a taper on steroids. Waller said:
“If we start doing some balance sheet runoff by summer, that’ll take some pressure off, you don’t have to raise rates quite as much. My view is we should start doing that by summer.”
 Source: Bloomberg
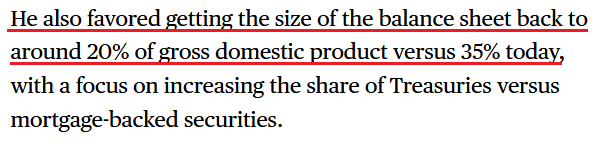
However, is this a plausible path for the Fed over the medium term? In a word: no. While the prospect is profoundly bullish for the USD Index and profoundly bearish for the PMs, Chairman Jerome Powell will likely avoid quantitative tightening.
For one, if the Fed tries to reduce its balance sheet from 35% to 20% of GDP, the financial markets will freak out. Currently, the Fed has such a large stockpile of bonds that private investors can’t absorb that kind of supply. Thus, another taper tantrum will likely unfold if the Fed tries to ‘normalize’ its balance sheet through the open market.
Second, the Fed’s only hawkish goal is to calm inflation. To explain, when inflation was running hot and most Americans bought into the “transitory” narrative, Fed officials exuded confidence. However, when consumer confidence sunk to a 10-year low and inflation became political, the Fed changed its tune. As a result, Powell wants to reduce inflation while tightening as little as possible (3% to 4% inflation may be considered acceptable in 2022). Thus, normalizing the balance sheet is likely a bridge too far.
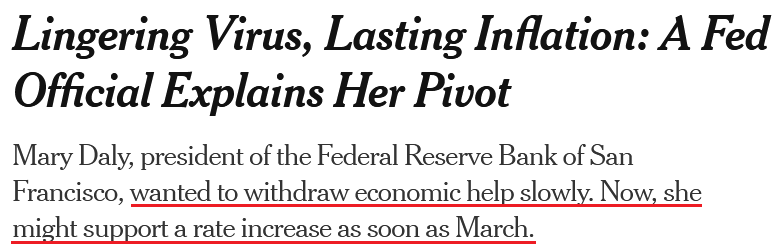
However, please remember that if quantitative tightening is a ten on the hawkish scale, hitting a seven or an eight is still profoundly bearish for the PMs. To explain, I highlighted on Dec. 20 how San Francisco Fed President Mary Daly had a come-to-Jesus moment. I wrote:
Daly – a major dove that urged patience in November – admitted on Dec. 17 that “I have adjusted my stance.”
And conducting another interview with The New York Times on Dec. 21, Daly said:
“My community members are telling me they’re worried about inflation. What influenced me quite a lot was recognizing that the very communities we’re trying to serve when we talk about people sidelined” from the labor market “are the very communities that are paying the largest toll of rising food prices, transportation prices and housing prices….
“I’m comfortable with saying that I expect us to need to raise rates next year. But exactly how many will it be – two or three – and when will that be – March, June, or in the fall? For me it’s just too early to know, and I don’t see the advantage of a declaration.”
However, with her slip of “two or three” rate hikes offering a window into her thought process, it’s clear that more hawkish policy will materialize over the medium term.
Please see below:
 Source: The New York Times
To that point, many short and medium-term gold bulls support the narrative that “the Fed is trapped.” For context, we’re bullish on the PMs over the long term. However, we expect sharp medium-term corrections before their uptrends resume.
Moreover, the narrative implies that the Fed can’t tighten monetary policy without crashing the U.S. economy. Thus, Fed officials are “trapped,” and the PMs should soar as inflation runs wild. However, this hyper-inflationist theory is much more semblance than substance.
To explain, adopters assumed that the Fed couldn’t taper its asset purchases without crashing the U.S. economy. However, the Fed tapered, then accelerated the taper, and the U.S. economy remained resilient. Now, the new narrative is that the Fed can’t raise interest rates without crashing the U.S. economy. However, it’s simply misleading.
As evidence, anxiety has increased with U.S. monetary and fiscal spending stuck in reverse/neutral. For example, the Fed is tightening monetary policy and Americans are no longer receiving stimulus checks and enhanced unemployment benefits. Moreover, U.S. President Joe Biden’s $1.75 trillion stimulus package was torpedoed by Senator Joe Manchin. As a result, who knows if it will pass in 2022?
However, while “the Fed is trapped” crew cites these issues as reasons for an economic calamity, they often miss the forest through the trees. For example, while the fiscal spending spree may end, U.S. households are still flush with cash.
Please see below:
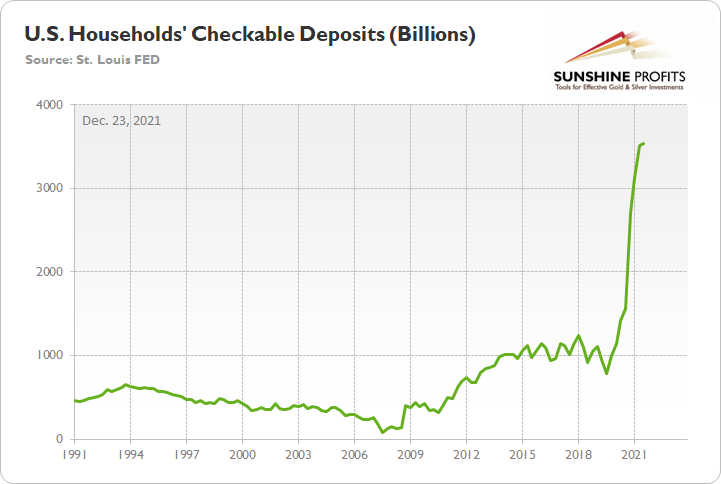
To explain, the green line above tracks U.S. households’ checkable deposits (data released on Dec. 9). In a nutshell: it’s the amount of money that U.S. households have in their checking accounts and/or demand deposit accounts.
If you analyze the vertical ascent on the right side of the chart, you can see that U.S. households have nearly $3.54 trillion in their checking accounts. For context, this is 253% more than Q4 2019 (pre-COVID-19).
Likewise, even though U.S. stimulus has disproportionately flowed to the top, the bottom 50% of American households (based on wealth percentiles) still have plenty of money to spend.
Please see below:
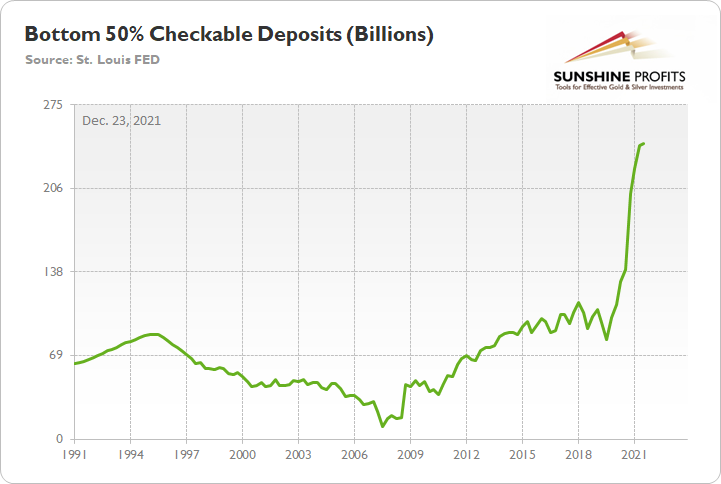
To explain, the green line above tracks the checkable deposits held by the bottom 50% of U.S. households (again, data released on Dec. 9). And with these individuals sitting on nearly $243 billion in cash, it's 142% more than Q4 2019.
Finally, it's important to remember that more than 75% of Canada's exports are sent to the United States. And with the former's exports to the latter hitting an all-time high in October (data released on Dec. 7), it's another indicator that U.S. consumer demand remains resilient.
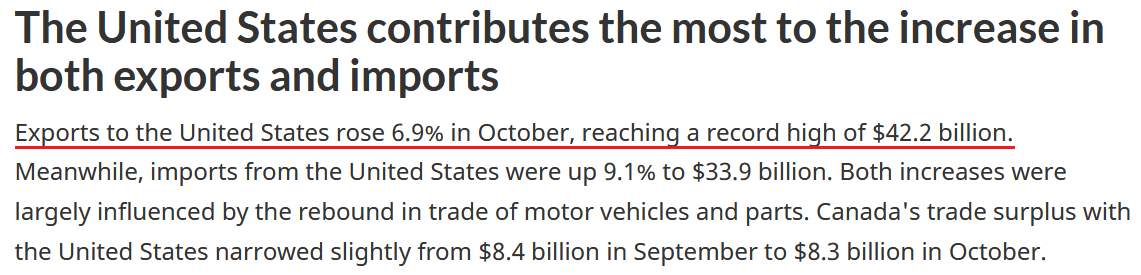 Source: Statistics Canada
The bottom line? While some investors expect a dovish 180 from the Fed, they shouldn’t hold their breath. With U.S. economic growth still resilient and the U.S. consumer in much better shape than some portray, the Fed can raise interest rates without crashing the U.S. economy. As a result, Powell will likely stick to his hawkish script and forge ahead with rate hikes in 2022.
Conversely, the only wild card is the Omicron variant. If the latest strain severely disrupts economic activity, the Fed could slow its roll. However, this is extremely unlikely. For one, the strain’s spread has been violent, but so far, the data shows it’s much milder than Delta. Second, the Fed needs to solve its inflation problem. And with the FOMC’s dot plot and officials’ rhetoric nodding in agreement, they likely realize that a continuation of 6%+ inflation will do more harm to the U.S. economy than raising interest rates.
Also, please note that when the Fed called inflation “transitory,” I wrote for months that officials were misreading the data. As a result, I don’t have a horse in this race. However, now they likely have it right. Thus, if investors assume that the Fed won’t tighten, their bets will likely go bust in 2022.
In conclusion, the PMs rallied on Dec. 22, as FDA approval of Pfizer’s coronavirus treatment pill helped uplift sentiment. However, the next several months will likely test their mettle. With the Fed hawked up and little stopping interest rate hikes in 2022, the pace of the current liquidity drain should surpass the precedent set in 2013/2014. As a result, more downside likely confronts the PMs over the medium term.
Overview of the Upcoming Part of the Decline
- It seems to me that while the corrective upswing might still continue, it might not be significant in case of junior mining stocks. After the corrective upswing is over, I think that gold will decline once again taking silver and mining stocks lower as well.
- It seems that the first stop for gold will be close to its previous 2021 lows, slightly below $1,700. Then it will likely correct a bit, but it’s unclear if I want to exit or reverse the current short position based on that – it depends on the number and the nature of the bullish indications that we get at that time.
- After the above-mentioned correction, we’re likely to see a powerful slide, perhaps close to the 2020 low ($1,450 - $1,500).
- If we see a situation where miners slide in a meaningful and volatile way while silver doesn’t (it just declines moderately), I plan to – once again – switch from short positions in miners to short positions in silver. At this time, it’s too early to say at what price levels this could take place, and if we get this kind of opportunity at all – perhaps with gold close to $1,600.
- I plan to exit all remaining short positions once gold shows substantial strength relative to the USD Index while the latter is still rallying. This may be the case with gold close to $1,350 - $1,400. I expect silver to fall the hardest in the final part of the move. This moment (when gold performs very strongly against the rallying USD and miners are strong relative to gold after its substantial decline) is likely to be the best entry point for long-term investments, in my view. This can also happen with gold close to $1,375, but at the moment it’s too early to say with certainty. I expect the final bottom to take place near the end of the year, perhaps in mid-December. It is not set in stone that PMs have to bottom at that time. If not then, then early 2022 would become a likely time target.
- As a confirmation for the above, I will use the (upcoming or perhaps we have already seen it?) top in the general stock market as the starting point for the three-month countdown. The reason is that after the 1929 top, gold miners declined for about three months after the general stock market started to slide. We also saw some confirmations of this theory based on the analogy to 2008. All in all, the precious metals sector is likely to bottom about three months after the general stock market tops. The additional confirmation will come from the tapering schedule, as markets are likely to move on the rumor and reverse on the fact as they tend to do in general.
- The above is based on the information available today, and it might change in the following days/weeks.
You will find my general overview of the outlook for gold on the chart below:
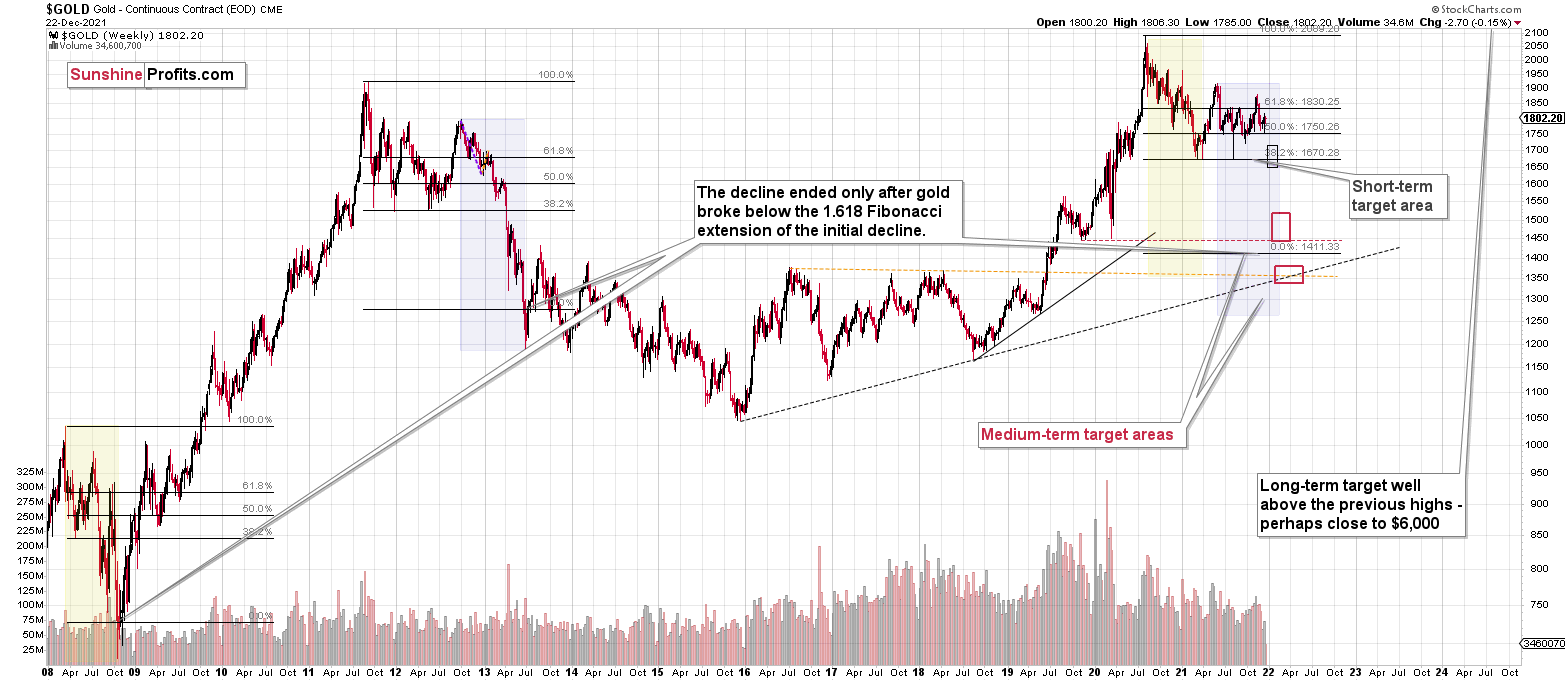
Please note that the above timing details are relatively broad and “for general overview only” – so that you know more or less what I think and how volatile I think the moves are likely to be – on an approximate basis. These time targets are not binding or clear enough for me to think that they should be used for purchasing options, warrants or similar instruments.
Leveraged ETFs – the Details
I’ve received a very interesting message discussing the specific trait of the popular leveraged ETFs. It’s based on the discussion of what it is that is actually being leveraged and what one can do about it.
The message was quite long, so I won’t quote it in its entirety, but I’ll address the key points in it. It starts with this comparison of recent performance. Let’s use this year’s up-to-date performance as a reference point.
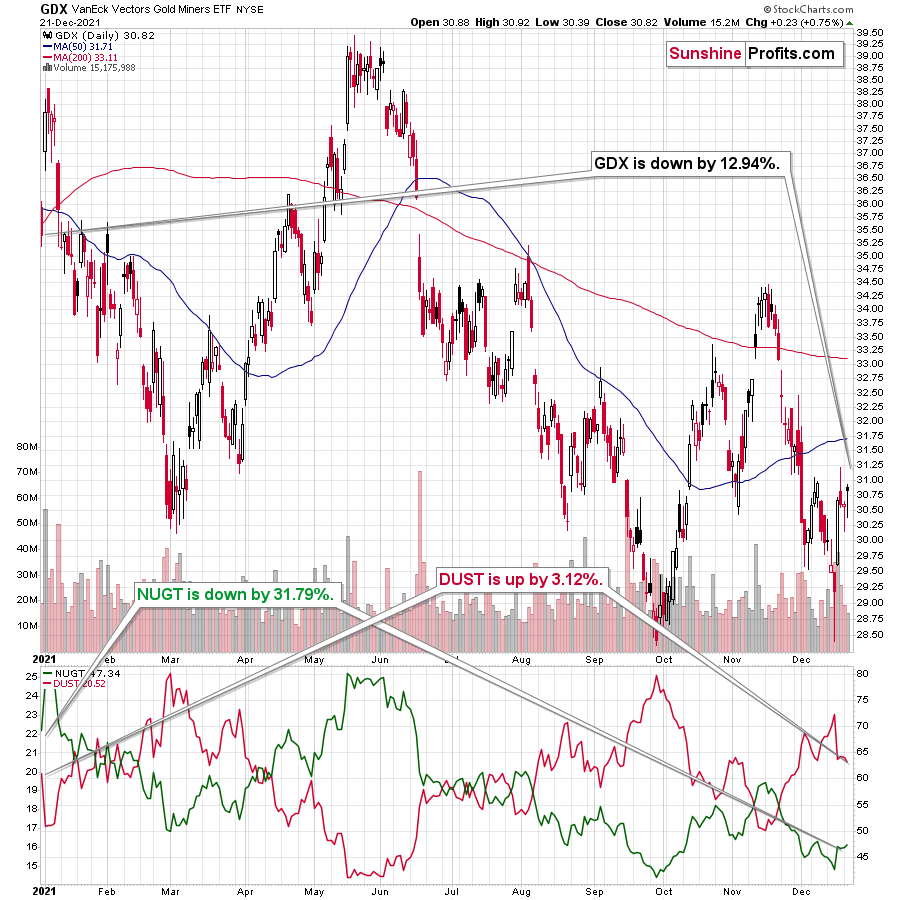
Briefly:
- GDX is down by 12.94% so far this year.
- NUGT is down by 31.79% so far this year.
- DUST is up by 3.12% so far this year.
It seems that the leveraged products are stealing people’s money! The possible losses on long positions were magnified (31.79 / 12.94 = 2.46) 2.46 times, but at the same time, the possible gains, thanks to correctly betting on lower GDX prices, were greatly diminished (3.12 / 12.94 = 0.24) about 4 times.
Why on Earth would anyone be using those products if they present so unfavorable returns?!
Let’s keep two things in mind.
One thing is that the leveraged is based on daily price moves and not on weekly, monthly, or yearly moves. This has profound implications, as what happens doesn’t just depend on where the price moves, but also on the way it gets there.
The second thing is that this year has been just moderately bearish so far. I mean, the decline that we’ve seen was visible, but it’s not that significant. Miners declined by less than 13%, and the decline that I’ve been describing (as my expectation) was supposed to take miners much lower – perhaps cutting their prices in half or more.
So, if something that I was writing about hasn’t happened yet, is it fair to judge what kind of proxy was good to bet on this move? It would be fine if NUGT’s and DUST’s (and JNUG’s and JDST’s) performances didn’t depend on the shape of the move, but they do.
Before providing you with another example, let me present you with an alternative idea.
Since NUGT performed so much worse than GDX (2.46x leverage year-to-date), then why not… simply short NUGT instead of going long DUST? (Or, in the case of junior miners, why not short the JNUG instead of going long the JDST?)
This way, one would be on the side that actually benefits from the day-to-day leverage and its implications.
- “Wait a minute. You’re telling me that you can actually do that? Can you can short the ETF that’s dedicated to magnifying gains from long positions?”
Yup.
- “I can’t believe it. Really?”
Yup.
- “Nah, there has to be some kind of catch!”
There is! You can do it, but you’re absolutely right that there’s a catch. A quite important one, if you really want to profit from a major, volatile price move.
Let’s take a look at what happened in 2020 during the volatile slide in the GDX.
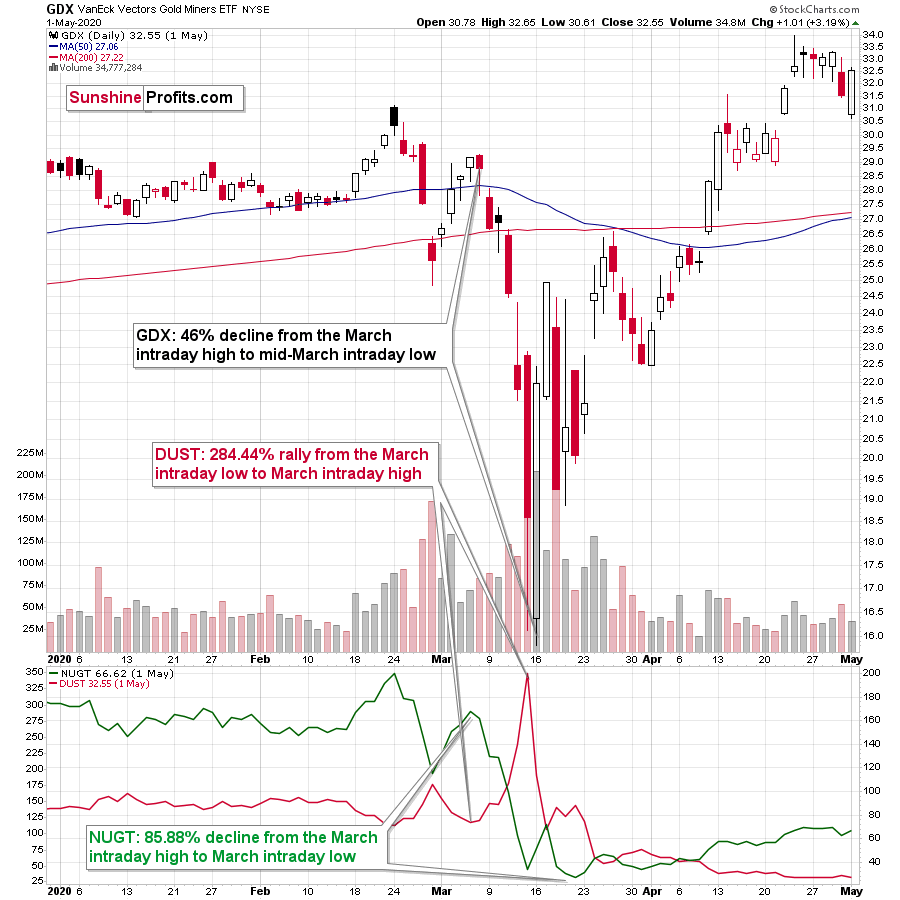
Briefly:
- GDX was down by 46% from its March intraday high to its March intraday low.
- NUGT was down by 85.88% from its March intraday high to its March intraday low.
- DUST was up by 284.44% from its March intraday low to its March intraday high.
In other words: NUGT provided about (85.88 / 46 = 1.87) 1.87 leverage, but DUST provided about (284.44 / 46 = 6.18) 6.18 leverage!
Putting aside the transaction costs, interest, taxes, etc., if one shorted the GDX ETF during the March slide, they would have gained about 46%. If they shorted NUGT, they would have gained about 86%, and if they bought DUST, they would have gained almost 300%.
By shorting GDXJ or NUGT (or GDX or JNUG), one is effectively capping the maximum profits on the trade at 100%. This doesn’t apply to a long position in DUST or JDST.
In the case of the junior mining stocks, GDXJ, JNUG, and JDST, the analogous numbers would have been:
- GDXJ – (hypothetical, but based on real data) gain from shorting: 52.72%
- JNUG – (hypothetical, but based on real data) gain from shorting: 95.11%
- JDST – (hypothetical, but based on real data) gain from a long position: 404.75%
So, in the case of the junior miners, the leverage gained on the March 2020 decline (if one entered and exited positions right at the price extremes), would have been (404.75 / 52.72 = 7.68) 7.68.
In general, the bigger and more volatile the move would be, the bigger the leverage would have become.
Would you prefer a 400% gain on the JDST-powered price move or a “fair” 2x leverage for the entire move that would yield 52.72% x 2 = 105.44% gains?
Even if the position was initially cut in half through time decay, one would still come out about twice as profitable than from the
One might think that the day-to-day leverage works against them, and that’s true most of the time. However, just because it’s true most of the time, it doesn’t mean that it’s the most important thing that should be considered (on the other hand, it shouldn’t be ignored, either). It’s difficult psychologically to see the price move in a rather steady manner, making one’s positions less than perfectly appealing in the case of the DUST or JDST. However, if the upcoming move is really likely to be very significant and volatile, it could be the case that a week or month of strong performance would make up for the temporary underperformance and then increase the gains several times over.
So, what’s the take-away here?
Be sure to understand how a given product’s leverage works before using it. In general, if the price moves are likely to be huge (preferably: epic) in the not-too-distant future, buying leveraged ETFs can provide handsome profits. However, if the price moves are likely to be rather normal, then buying leveraged ETFs might be useful only in the case of the short-term price moves. In the case of medium-term moves, if one seeks leverage, one might use either CFDs (if they are available, that is – that’s not something available in the U.S. or Canada, and it’s also unavailable in many other jurisdictions). Alternatively, one might consider shorting the leveraged ETF that magnifies the moves that are the opposite of what one expected (so, instead of going long GDX, or buying NUGT, one could short DUST). The latter approach still has some risks. For example, it would not work well if there was a huge (epic) move in the adverse direction.
I can’t tell you what you should do with your capital, as that depends on your preferences, ability and willingness to take risk, etc. I can only tell you what I think the market is going to do and why I think so. I can also tell you who I prefer to take advantage of the upcoming price moves. Right now, I think that the junior mining stocks are going to decline profoundly in the following weeks or months, and I’m long the JDST.
This doesn’t mean that it’s the best approach for you – but thanks to being informed (for example, based on my above explanation), you can take the decision that suits you the most.
Summary
Summing up, it seems to me that while we the corrective upswing might still continue, it might not be significant in case of junior mining stocks. After the corrective upswing is over, I think that gold will decline once again taking silver and mining stocks lower as well.
From the medium-term point of view, the key two long-term factors remain the analogy to 2013 in gold and the broad head and shoulders pattern in the HUI Index. They both suggest much lower prices ahead.
It seems that our profits from the short positions are going to become truly epic in the following months.
After the sell-off (that takes gold to about $1,350 - $1,500), I expect the precious metals to rally significantly. The final part of the decline might take as little as 1-5 weeks, so it's important to stay alert to any changes.
Most importantly, please stay healthy and safe. We made a lot of money last March and this March, and it seems that we’re about to make much more on the upcoming decline, but you have to be healthy to enjoy the results.
As always, we'll keep you - our subscribers - informed.
YEAR-END PUBLICATION SCHEDULE:
- The analyses will continue to be published normally until Thursday, December 23, 2021.
- There will be no regular analyses posted on Friday, Dec. 24, 2021 (the markets are closed in the U.S., so probably nothing important will happen on that day, anyway), and there will be no regular analyses posted between Monday, Dec. 27, 2021 and Friday, Dec. 31, 2021.
- The regular analyses will be back on Monday, Jan. 3, 2022, and the first Gold Investment Update will be posted on Tuesday, Jan. 4, 2022.
- In other words, we are taking a break from regular publication between Christmas Eve and the end of the year.
It’s been a volatile year, and it seems that 2022 will be even more so. Consequently, it’s a good idea to take this opportunity to recharge batteries. The nature of the service that we’re providing is extremely person-specific, as I (PR here) can’t just re-assign managing my own analysis, my outlook, and my opinions, to someone else. I also can’t ignore the fact that in order to provide you with the highest quality service, periodic breaks from the regular schedule are necessary. I can’t even remember when I took a weekly break from the regular publication schedule. Probably a few years ago.
Still, the emphasis is on “regular”, since just because there will be no regular, daily analyses posted, it doesn’t mean that I’m going to stop monitoring the situation on the markets entirely. I think that the precious metals market is on the verge of a major move lower. I will keep monitoring the markets, and if anything changes, I will send you a quick note, anyway. Consequently, despite the break from the regular schedule, I will keep you informed and up-to-date, to the extent that the market situation warrants it.
Thank you for understanding.
To summarize:
Short-term outlook for the precious metals sector (our opinion on the next 1-6 weeks): Bearish
Medium-term outlook for the precious metals sector (our opinion for the period between 1.5 and 6 months): Bearish initially, then possibly Bullish
Long-term outlook for the precious metals sector (our opinion for the period between 6 and 24 months from now): Bullish
Very long-term outlook for the precious metals sector (our opinion for the period starting 2 years from now): Bullish
As a reminder, Gold Investment Updates are posted approximately once per week. We are usually posting them on Monday, but we can’t promise that it will be the case each week.
Our preferred ways to invest in and to trade gold along with the reasoning can be found in the how to buy gold section. Additionally, our preferred ETFs and ETNs can be found in our Gold & Silver ETF Ranking.
Moreover, Gold & Silver Trading Alerts are posted before or on each trading day (we usually post them before the opening bell, but we don’t promise doing that each day). If there’s anything urgent, we will send you an additional small alert before posting the main one.
Thank you.
Przemyslaw Radomski, CFA
Founder, Editor-in-chief

