

Briefly: Outlook for the precious metals market remains bearish for the following few weeks, and bullish for the following months and years.
Welcome to this week's Gold Investment Update.
The outlook that we featured latest, didn't change based on last week's price moves as prices generally moved in tune with our expectations. Consequently, there are parts of the previous analysis that didn't change in the previous days - we will put them in italics.
Before discussing the technical picture, we'd like to write a few words on the recent fundamental developments. The most recent news is that the Fed - while being already dovish, became much more so.
Generally speaking, the Fed declared that it will focus more on the job market and won't worry about higher inflation. This is because "a robust job market can be sustained without causing an unwelcome increase in inflation", as Powell explained in his remarks discussing the policy shift.
Being more specific, the most significant changes to the framework document are:
- The Fed explicitly acknowledges the decline in the neutral interest rates and challenges for monetary policy in an environment of persistently low interest rates, in particular the effective lower bound. And, of course, these challenges will create excellent excuse to adopt even more dovish policies than currently implemented. After all, to overcome these challenges, the Fed is prepared to "use its full range of tools to achieve its maximum employment and price stability goals",
- On maximum employment, the FOMC announced that its policy decision will be informed by the shortfalls rather than deviations of employment from its the maximum level. Oh boy, this is such a radical change! It means that the Fed will cease to worry about the overheating of the economy. In other words, the U.S. central bank drops the Philips curve. You see, in the past, the strong labor market meant that higher inflation could be just around the corner, which would be a reason to hike the federal funds rate. Now, the Fed could print money and ease its monetary stance like there's no tomorrow! A great triumph of doves!
- And finally, on price stability, the FOMC adjusted its strategy for achieving its longer-run inflation goal of 2 percent by noting that it "seeks to achieve inflation that averages 2 percent over time." It means that after periods of inflation rates below the target, the Fed would accept inflation rates above the target! As the revised statement states "following periods when inflation has been running persistently below 2 percent, appropriate monetary policy will likely aim to achieve inflation moderately above 2 percent for some time." It's a great change (at least in rhetoric, as we doubt whether the Fed ever worried about inflation since Volcker left the U.S. central bank), as it means de facto adopting price-level targeting. Undershoots of inflation are not forgotten, but they are made up for later. Of course, we are yet to see whether the Fed will manage to trigger higher official inflation rates (as successfully as asset price inflation), but shift allows the Fed to ease its monetary policy even further and to implement its dovish bias even stronger!
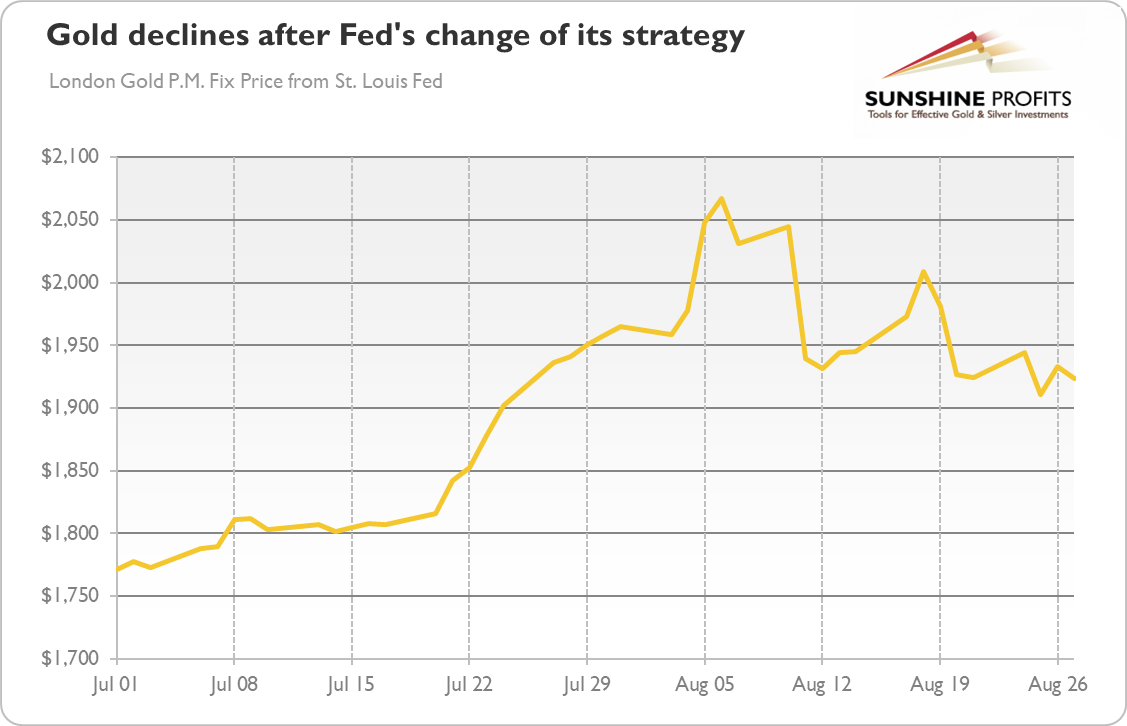
What does it all mean for the gold market? Well, the updated Fed's strategy opens the door for easier monetary policy, ultra low interest rates for longer, and higher inflation. So, the shift is fundamentally positive for the gold prices. Actually, it could be the trigger that gold needed to continue its rally further north. However, the initial gold's reaction has been negative (i.e., after a spike, there was a sharp reversal), as the chart below shows.
Of course, investors should remember that the updated strategy does not mean that we will see double-digit inflation tomorrow. The inflation has been under the Fed's target for years, so it does not have to rise just because the Fed changed its monetary framework. And the FOMC wrote about inflation "moderately" above the target - yeah, we know that they couldn't write otherwise, but we really doubt whether the Fed officials really want to see double-digit inflation rates.
However, the current economic crisis is more inflationary that the Great Recession. The recent fast increase in the broad money supply increases the risk of higher inflation in the future. Now, the Fed's announcement that it will welcome and embrace the rise in inflation, should increase inflation expectations, increasing the demand for gold as an inflation-hedge. Higher inflation expectations would also lower the real interest rates, also supporting the gold prices.
All in all, there are multiple fundamental reasons due to which gold is likely to soar in the upcoming years, however, even the most profound bull markets can't move up in a straight line and some corrections will take place. After big rallies, we're likely to see big corrections, and one is long-overdue in case of the precious metals market.
Just as it was in March, it seems that the visible worsening in the economic situation might trigger a sell-off.
At this point we would like to quote what we wrote about the aspects of the virus scare and how the market reacts to them. In short, gold (and other markets) reacted when people started to strongly consider the economic implications and this topic was ubiquitous in the media.
The particularly important factor for gold will likely be the economic implications of the second Covid-19 wave. How do we know that? Because we compared what people were searching for (online) with how gold prices shaped. There's a lot more data available on https://searchingcovid19.com/ but we'll focus on the chart that shows when people were getting interested in what aspects of the pandemic and we'll compare them to gold.
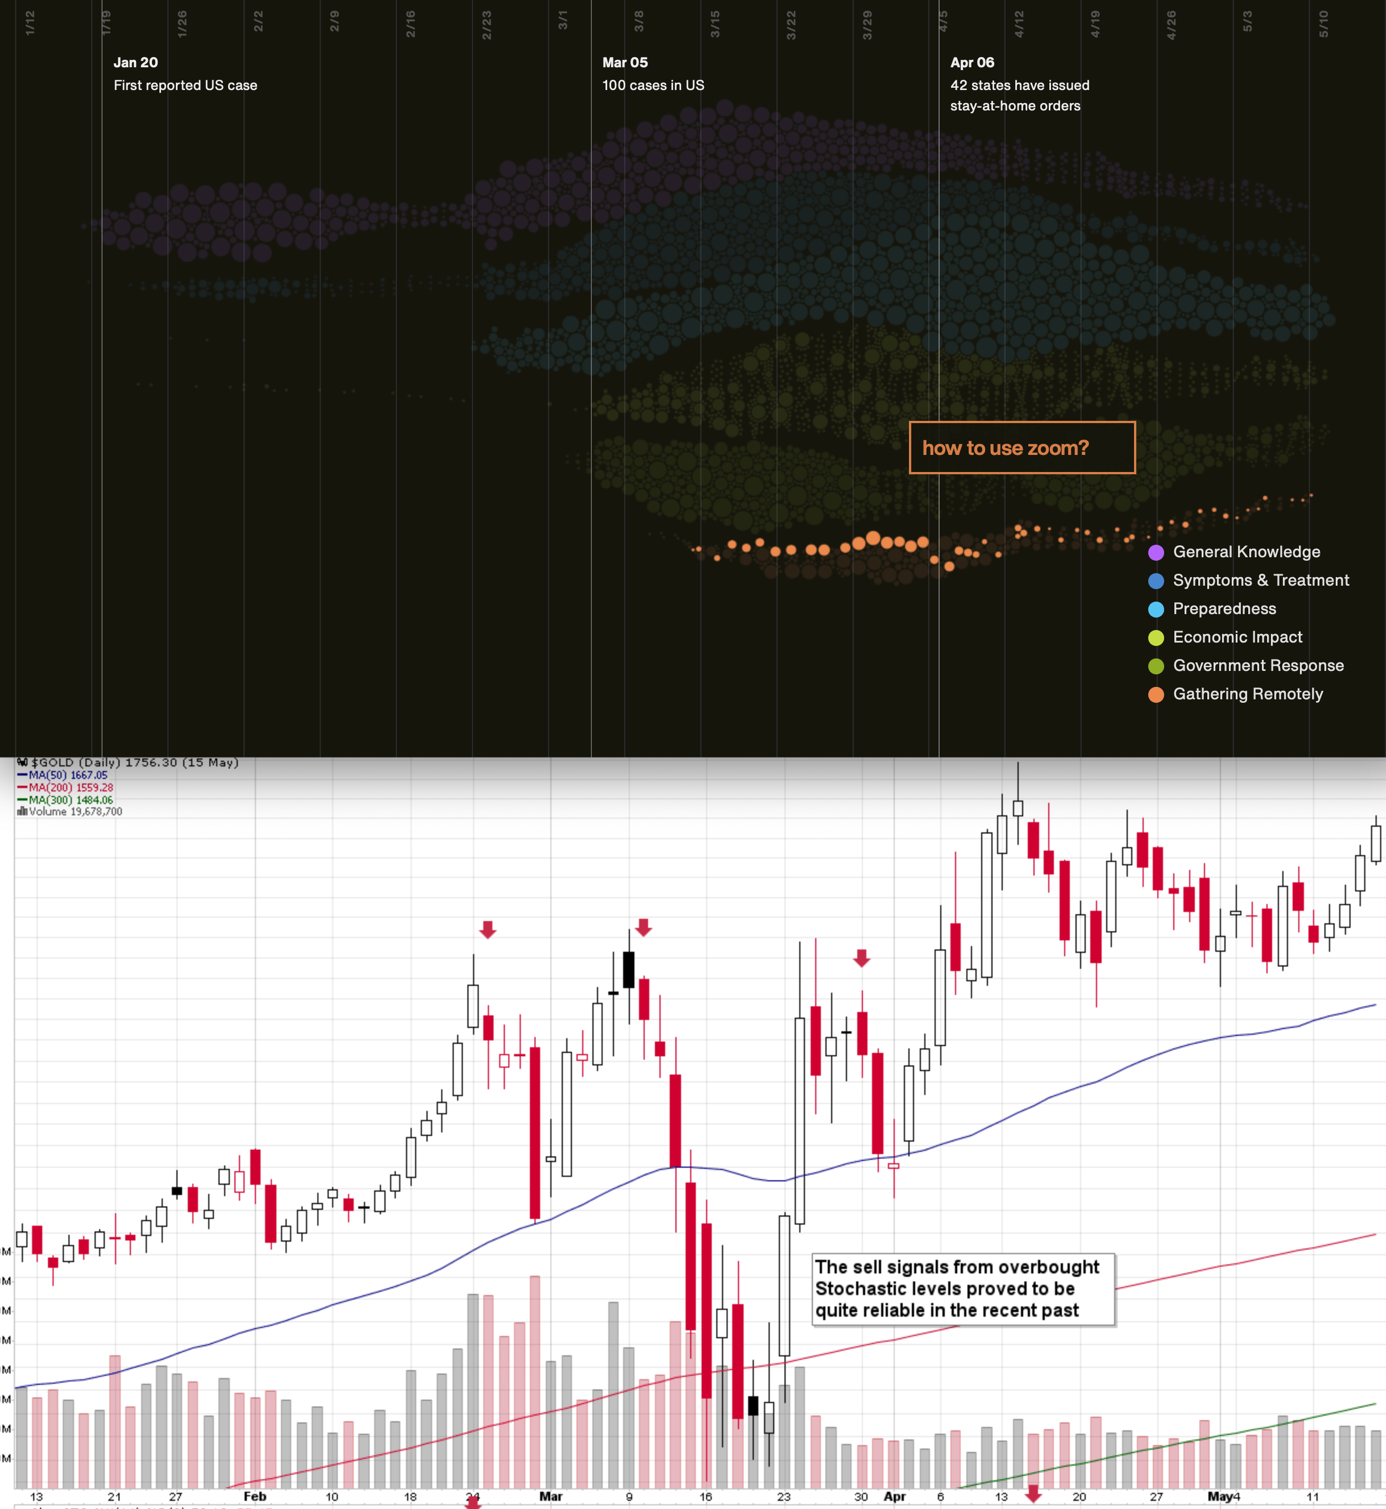
We aligned both charts with regard to time. The chart on the bottom is from Stockcharts.com and it features gold's continuous futures contract. The gold price (and the USD Index value) really started to move once people got particularly interested in the economic impact of the pandemic and in the government's response.
In the recent days (and weeks) the news is dominated by other issues. Once people start considering the economic implications of the second wave of this coronavirus, the prices would be likely to move.
The news coming from the Fed is positive for gold in the long run, but in the short term, they continue to indicate risk for the economy. This risk is likely to translate into lower stock values and initially gold is likely to slide given the above - just like it did in March.
All in all, gold is likely to rally far in the long run, but in the short run it's vulnerable to a sizable decline, when the economic implications of the pandemic's continuation become obvious to investors.
Stocks and the Dollar Weigh In
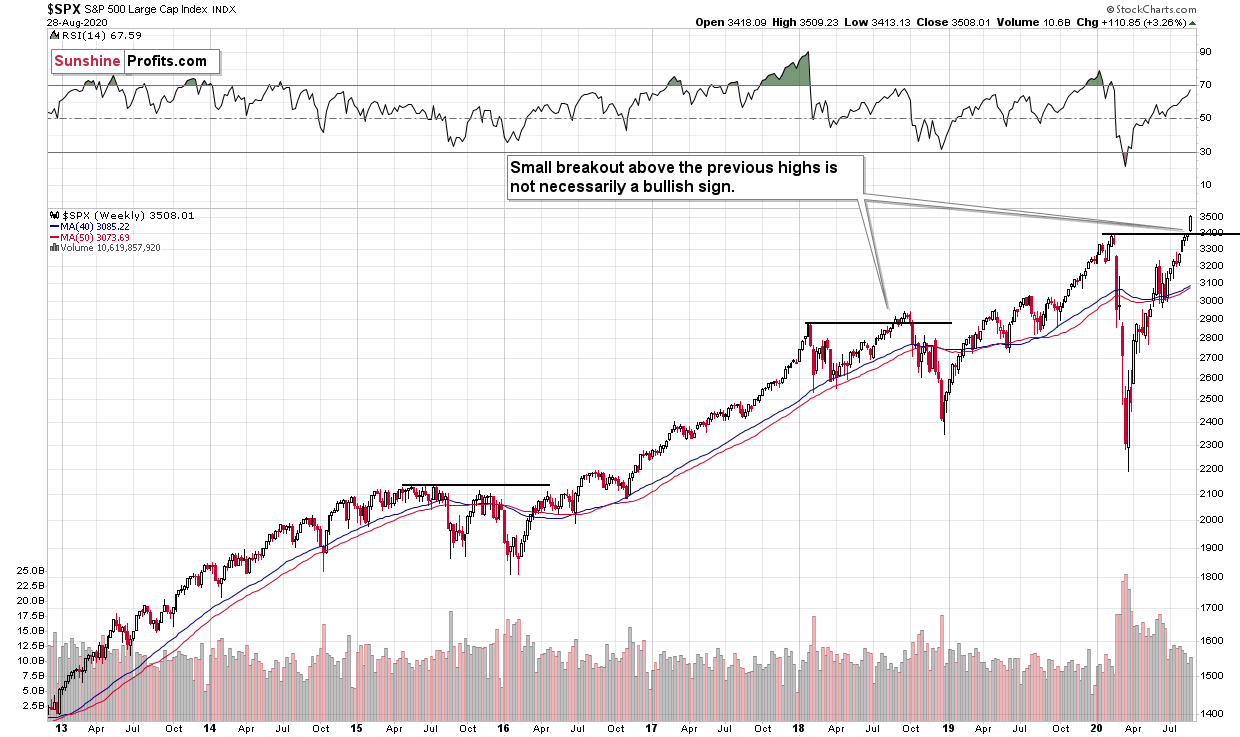
The S&P 500 has just moved sharply above previous 2020 high.
Given the economic background, I find this performance unfounded. But the markets can stick to a certain emotional trend for longer than many investors can remain logical, which would fit the above picture.
Back in 2018 stocks topped a bit above their previous highs, so the recent breakout is not yet a fully bullish sign. The invalidation of the breakout would, however, be a clear bearish indication.
Do you remember what happened in February when the S&P 500 lost its upward momentum? Stocks plunged, and that was when tops in mining stocks and silver formed. Gold made another attempt to move higher but ultimately declined profoundly in the following days.
It appears that on one hand, everything that could have gone well for gold on the fundamental front, has already gone well, and it already rallied, and on the other hand, we have many signals pointing to the situation being excessive. This means that as some of the bullish factors ease (perhaps temporarily) and investors get scared about economy's ability to really recover, gold is likely to correct significantly, before continuing its upward march.
Speaking of indications pointing to the situation being excessive, let's take a look at the USD Index.
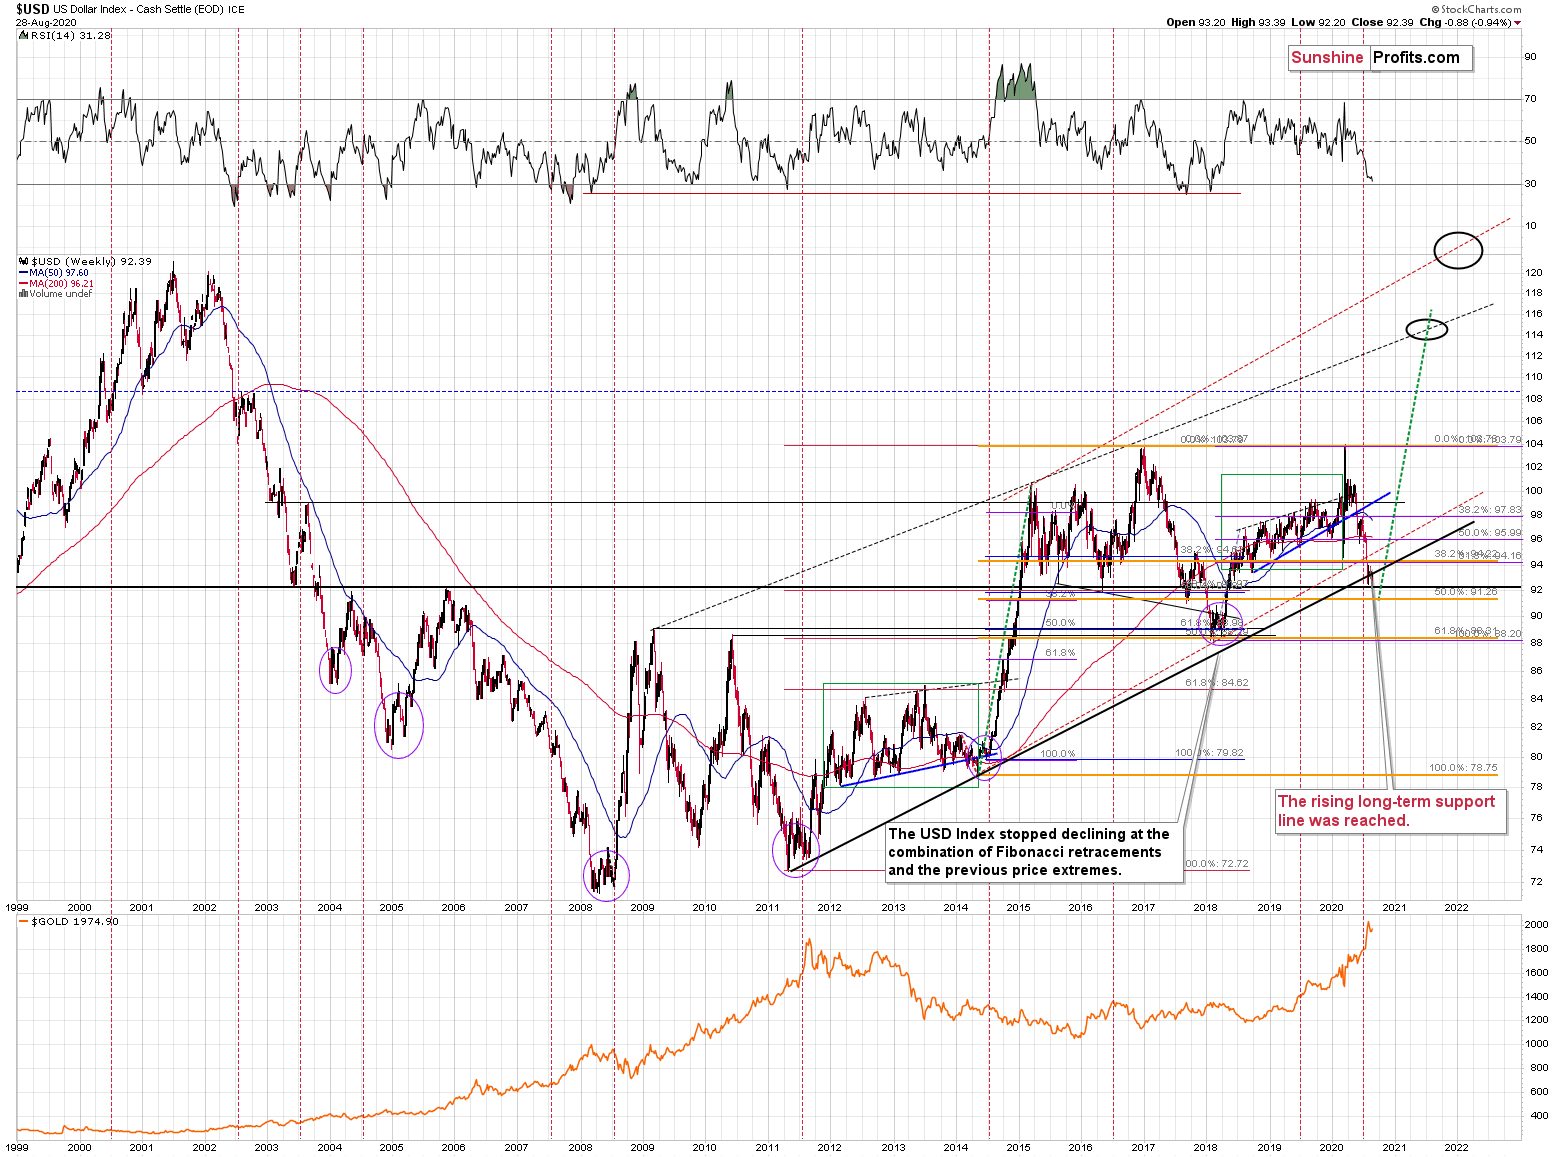
Remember when in early 2018 we wrote that the USD Index was bottoming due to a very powerful combination of support levels? Practically nobody wanted to read that as everyone "knew" that the USD Index is going to fall below 80. We were notified that people were hating on us in some blog comments for disclosing our opinion - that the USD Index was bottoming, and gold was topping. People were very unhappy with us writing that day after day, even though the USD Index refused to soar, and gold was not declining.
Well, it's the same right now.
The USD Index is at a powerful combination of support levels. One of them is the rising, long-term, black support line that's based on the 2011 and 2014 bottoms.
The other major, long-term factor is the proximity to the 92 level - that's when gold topped in 2004, 2005, and where it - approximately - bottomed in 2015, and 2016.
The USDX just moved to these profound support levels, and it's very oversold on a short-term basis. It all happened in the middle of the year, which is when the USDX formed major bottoms on many occasions. This makes a short-term rally here very likely.
While it might not be visible at the first sight (you can click on the chart to enlarge it), the USD Index moved briefly below the long-term, black support line and then it invalidated this breakdown before the end of the week. This is a very bullish indication for the next few weeks.
Based on the most recent price moves, the USDX is once again below the above-mentioned strong rising support line, but we doubt that this breakdown would hold. We expect to see an invalidation thereof that is followed by a rally.
Before moving to the short-term chart, please note that the major bottoms in the USD Index that formed in the middle of the previous years often took form of broad bottoms. Consequently, the current back and forth trading is not that surprising. This includes the 2008, 2011, and 2018 bottoms.
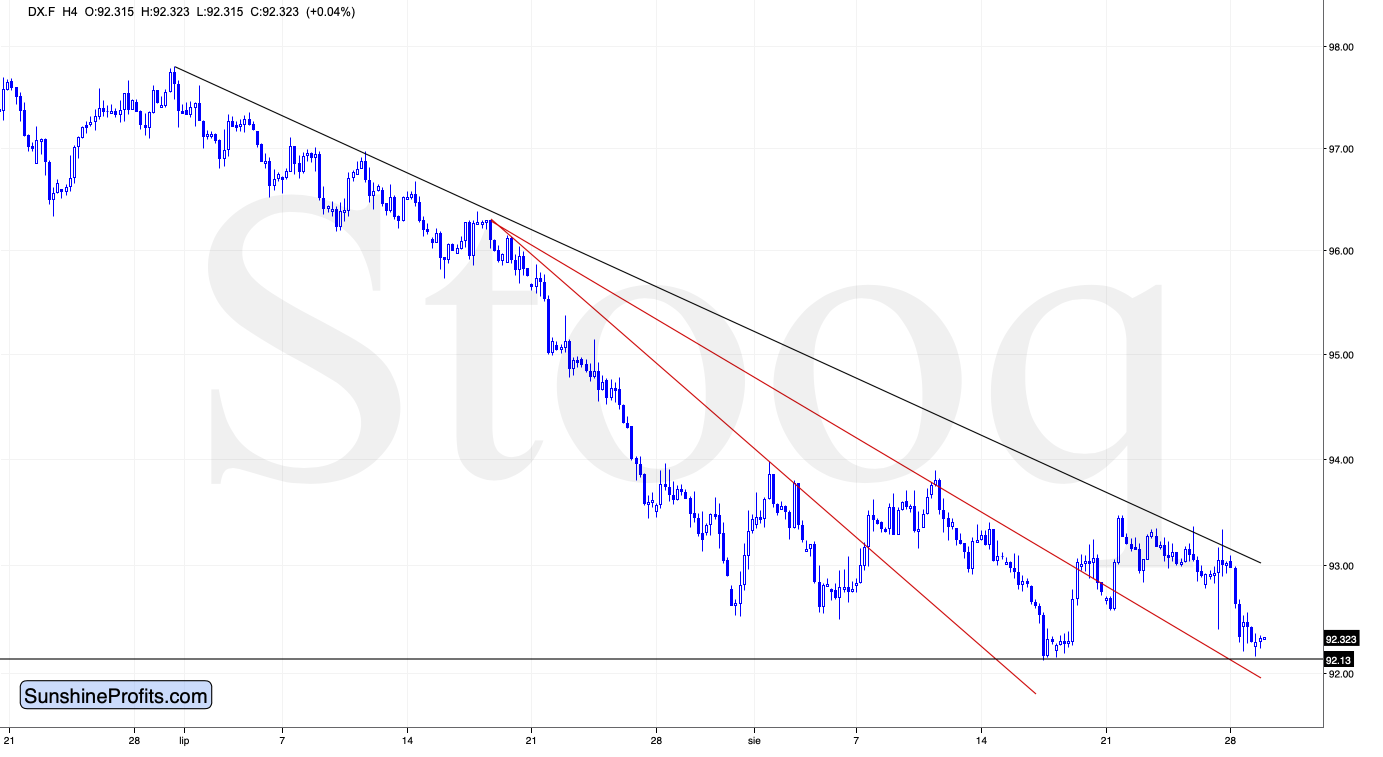
On the above short-term USD Index chart, we see that it just tested the previous lows and at the same time it moved to the previously broken resistance line. Both actions are similar to what the USDX did in the middle of August - before rallying.
The USD Index keeps getting bearish news (like the even more dovish turn in Fed's policy), and yet it refuses to move lower, only testing its previous lows. It seems that it has fallen too much too fast and the market is no longer willing to react to the news. Once we get bullish news - or the number of bearish news diminishes, the USDX is likely to rally.
Exactly the opposite is likely for gold and the rest of the precious metals sector. In fact, please note that while the USD Index is testing its mid-August low, gold is not testing its mid-August high - it does not want to rally without declining first.
Back in March, the short-term breakout in the USD Index was the thing that triggered the powerful rally in it, as well as a powerful plunge in the precious metals market. It's generally a good gold trading tip to monitor the USD Index's performance.
Consequently, based on this analogy, the implications for the near term are bearish for the PMs. Especially, when we consider the fact that Gold Miners Bullish Percent Index showed the highest possible overbought reading recently.
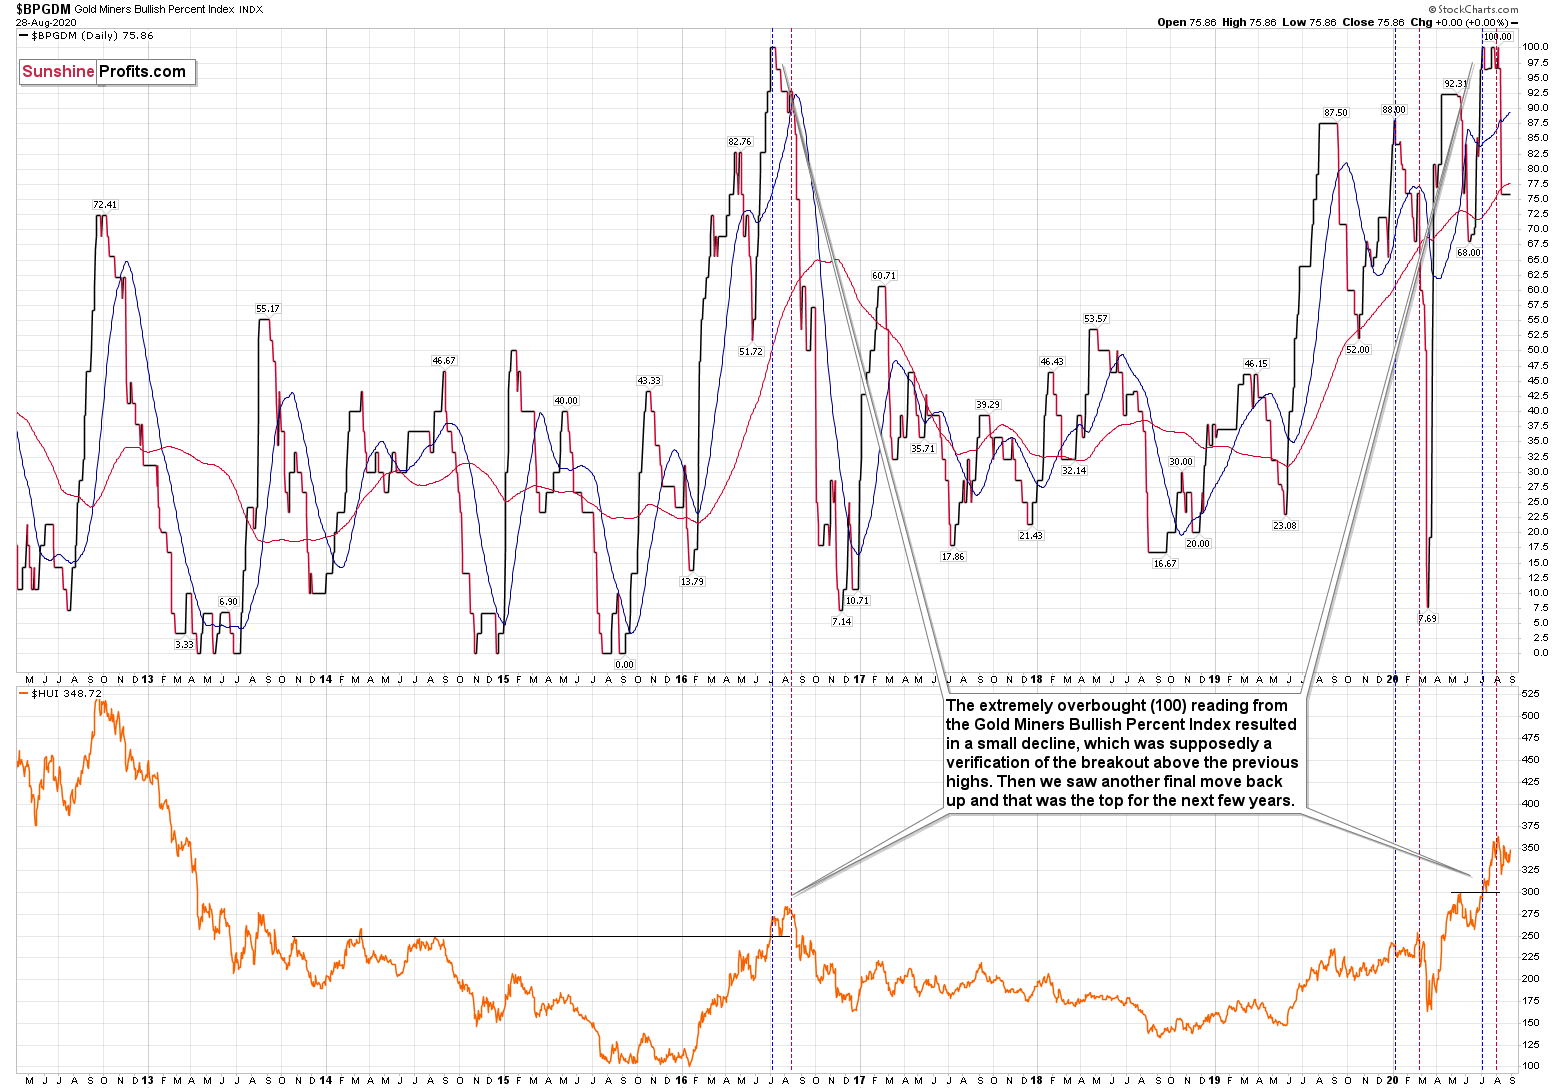
The excessive bullishness was present at the 2016 top as well and it didn't cause the situation to be any less bearish in reality. All markets periodically get ahead of themselves regardless of how bullish the long-term outlook really is. Then, they correct. If the upswing was significant, the correction is also quite often significant.
Please note that back in 2016, there was an additional quick upswing before the slide and this additional upswing has caused the Gold Miners Bullish Percent Index to move up once again for a few days. It then declined once again. We saw something similar also this time. In this case, this move up took the index once again to the 100 level, while in 2016 this wasn't the case. But still, the similarity remains present.
Back in 2016, when we saw this phenomenon, it was already after the top, and right before the big decline. Given the situation in the USD Index, it seems that we're seeing the same thing also this time.
Please note that back in 2016, after the top, the buying opportunity didn't present itself until the Gold Miners Bullish Percent Index was below 10. It's currently above 70, so it seems that miners have a long way to go before they bottom.
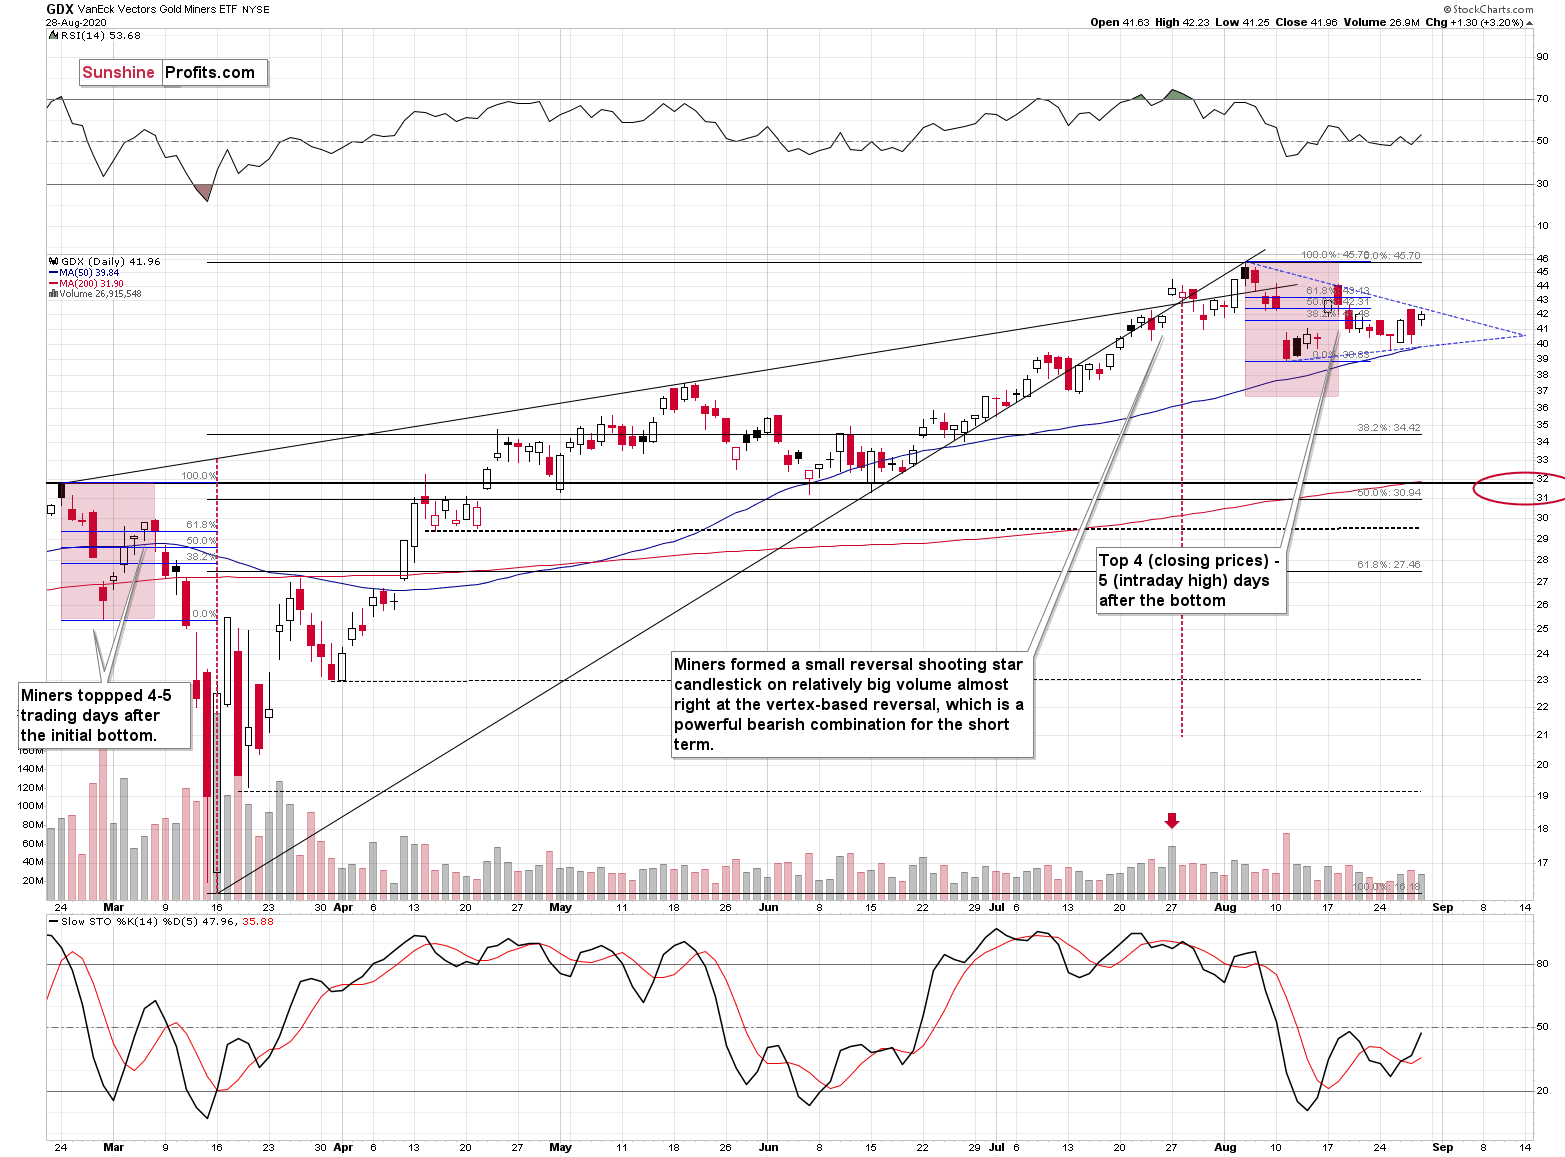
Last week, we commented on the above chart in the following way:
Now, since the general stock market moved above the previous highs and continues to rally, we might or might not see a sizable decline early this week. Back in March, the slide in miners corresponded to the decline in the general stock market, and this could be repeated, or we could see some sideways trading after the slide resumes, once stocks finally decline.
That's exactly what happened. The general stock market continued to move higher, and mining stocks have been trading sideways instead of declining - or rallying. Before miners' pause (and S&P's breakout) miners were repeating their late-February and early-March performance. The implications of the self-similar pattern were bearish and they continue to be bearish, only the timing changed.
Also, let's not forget that the GDX ETF has recently invalidated the breakout above the 61.8% Fibonacci retracement based on the 2011 - 2016 decline.
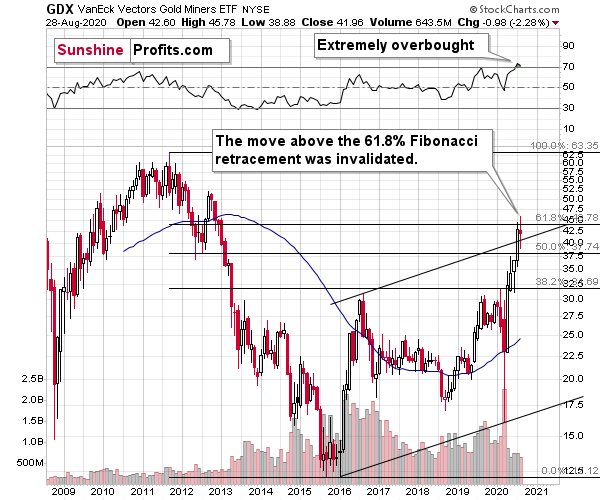
When GDX approached its 38.2% Fibonacci retracement, it declined sharply - it was right after the 2016 top. Are we seeing the 2020 top right now? This is quite possible - PMs are likely to decline after the sharp upswing, and since there are only several months left before the year ends, it might be the case that they move north of the recent highs only in 2021.
Either way, miners' inability to move above the 61.8% Fibonacci retracement level and their invalidation of the tiny breakout is a bearish sign.
Let's turn to metals themselves.
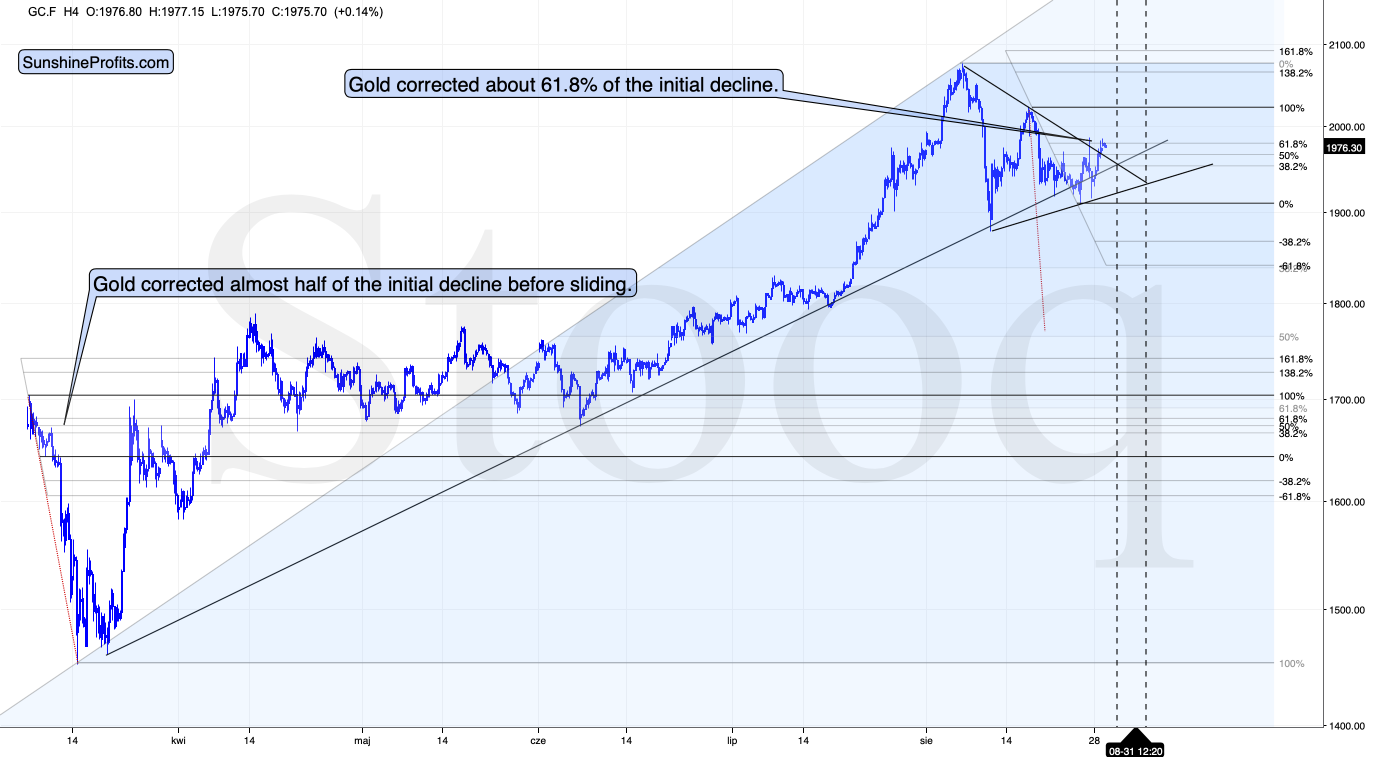
Back in March, after its final top and the initial decline, gold corrected a bit less than half of the downswing, before topping and moving lower.
Right now, gold corrected about 61.8% of the preceding downswing, which is still similar to how it performed in March. What is more notable than the lack of 100% similarity, is the fact that gold didn't move to mid-August high despite the USD Index's move to its mid-August lows. The implications of this short-term underperformance are bearish.
Also, as you can see on the chart above, there's a vertex-based reversal "scheduled" for the next several days. In fact, there are two such reversals. This means that gold's recent upswing is likely to be reversed rather sooner than later. A tiny move below the previous lows in the USD Index and then its profound invalidation would serve as a perfect trigger for gold's decline.
To be clear, we could still see a move back to the previous high, but it seems more likely that since we already saw two distinct tops, there would be no third top. In this way, the double-top pattern would be similar to what happened in March and in 2011, but we wouldn't have the similarity in terms of the price levels that were reached.
As a reminder, here's what happened in 2011.
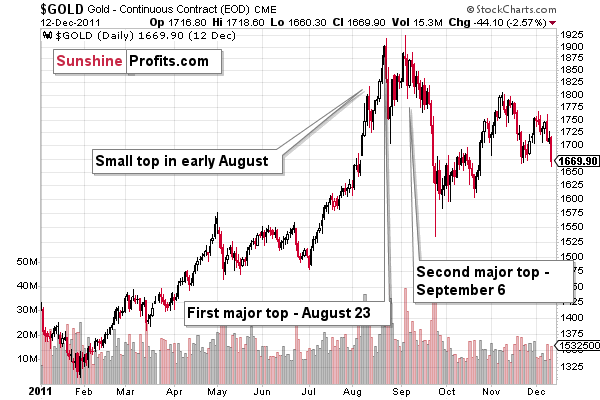
The additional similarity between now, March 2020, and the 2011 top, is that gold's pace of decline diminished after the second top.
The next support is at $1,700, which is where - approximately - gold topped and bottomed multiple times earlier this year.
The $1,700 level is additionally confirmed by the 61.8% Fibonacci retracement based on the entire 2015 - 2020 rally.
There's also possibility that gold would decline to the $1,500 - $1,600 area or so (50% Fibonacci retracement and the price level to which gold declined initially in 2011), but based on the size of the recent upswing, we no longer think that this scenario is the most likely one.
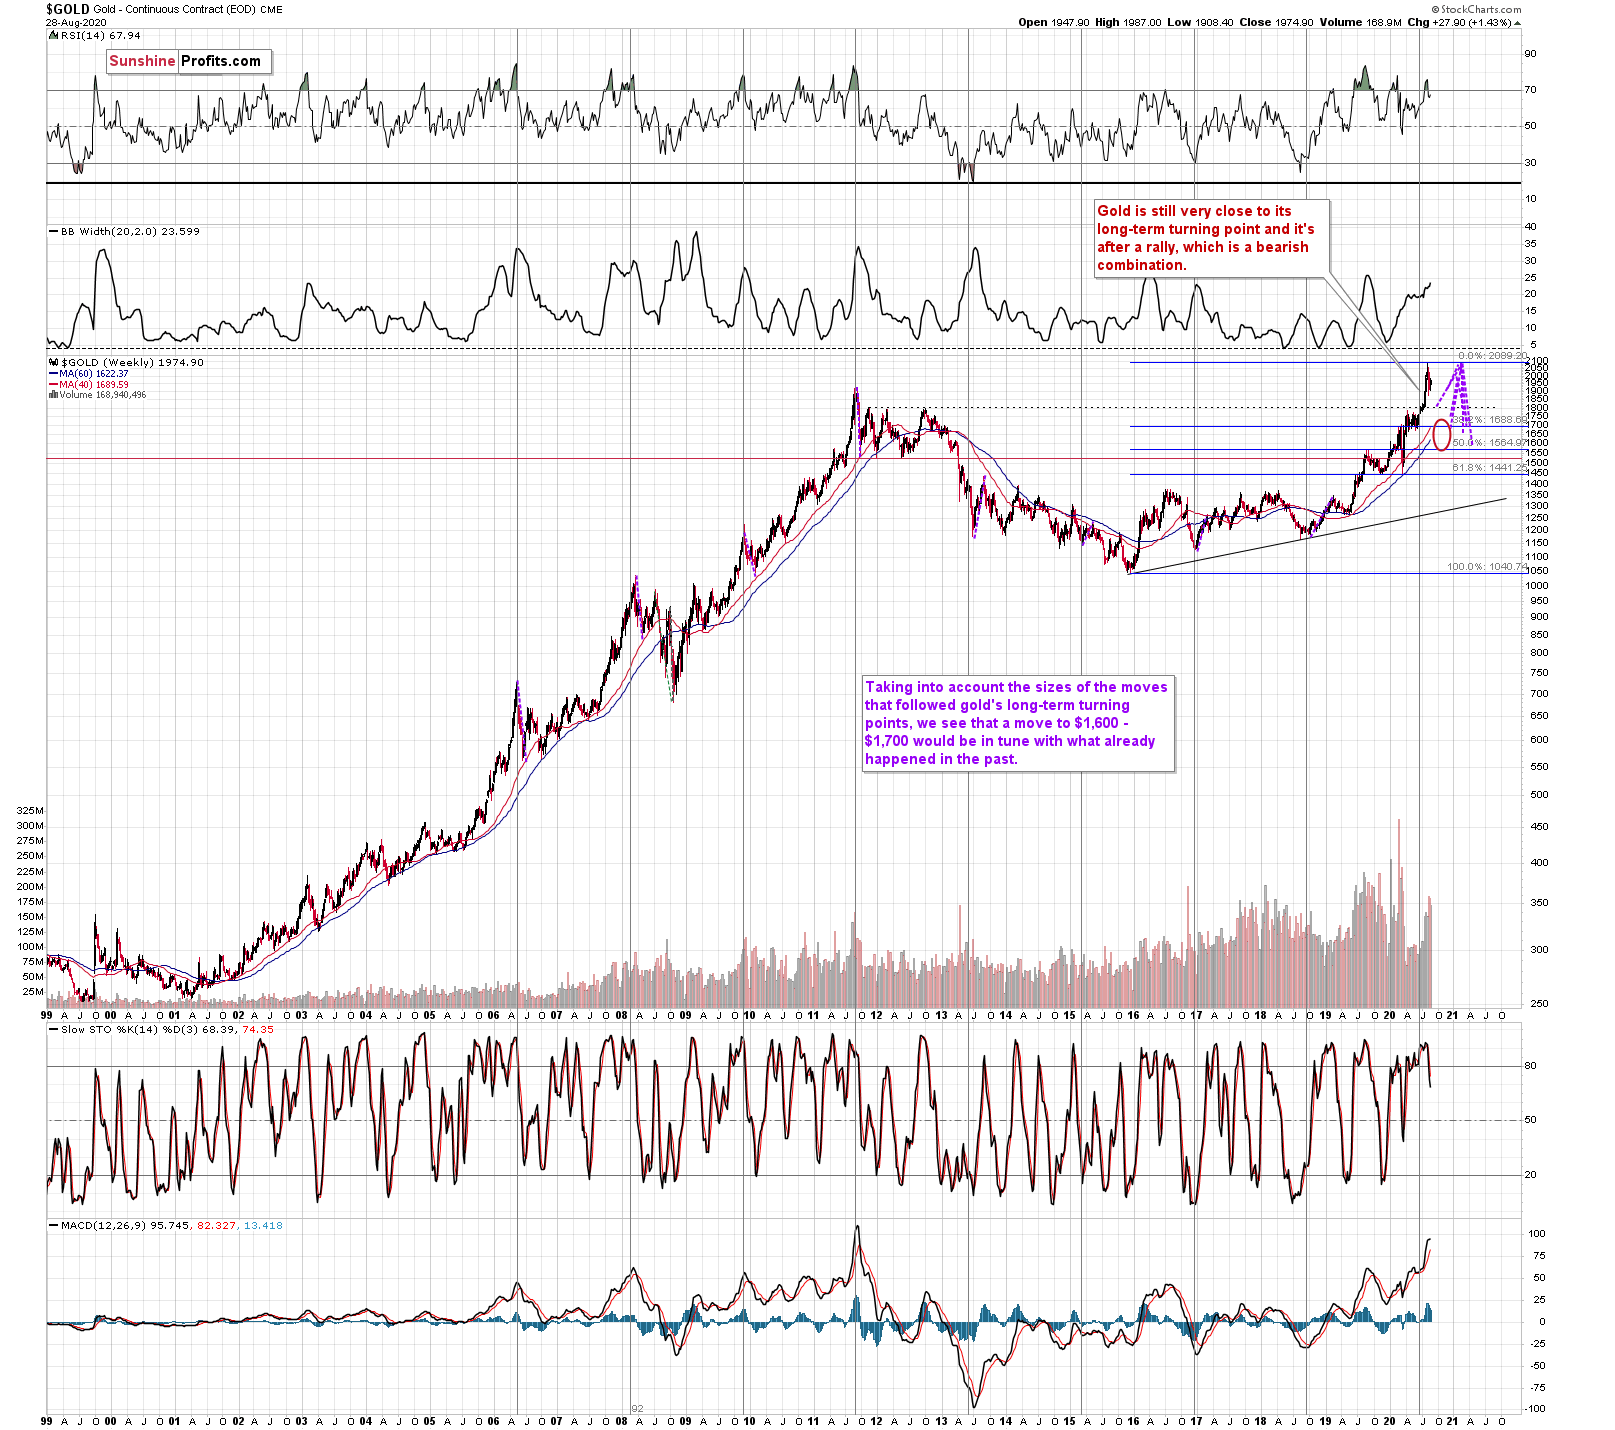
Gold's very long-term turning point is here and since the most recent move has definitely been to the upside, its implications are bearish.
We used the purple lines to mark the previous price moves that followed gold's long-term turning points, and we copied them to the current situation. We copied both the rallies and declines, which is why it seems that some moves would suggest that gold moves back in time - the point is to show how important the turning point is in general.
The big change here is that due to gold's big rally, we moved our downside target for it higher. Based on the information that we have available right now, it seems likely that gold will bottom close to the $1,700 level. That's very much in tune with how much gold moved after the previous long-term turning points.
Also, while we're discussing the long-term charts, please note the most important detail that you can see on the gold, silver, and mining stock charts, is hidden in plain sight. Please note how much silver and miners rallied.
The analogy to the price moves after the previous turning points didn't change, but since the starting point is much higher, the downside target is also higher.
Speaking of upside targets, two weeks ago, we wrote the following:
Based on gold's Fibonacci extensions and the previous major highs and lows (the 2018 high and late-2019 low along with the 2020 low), we get a nearby upside target of $2085. At the moment of writing these words, gold is trading at $2044. Given this week's volatility, it could even be a matter of hours before gold reaches the above-mentioned target and reverses. Taking closing prices into account, gold is up by $35, so if it reverses significantly, we would be likely to see a powerful weekly reversal candlestick and one that causes gold to decline in the following weeks.
That's more or less what happened. Gold topped at $2,089.20. It then declined quite visibly and closed last week at about $1,950.
And what about silver?
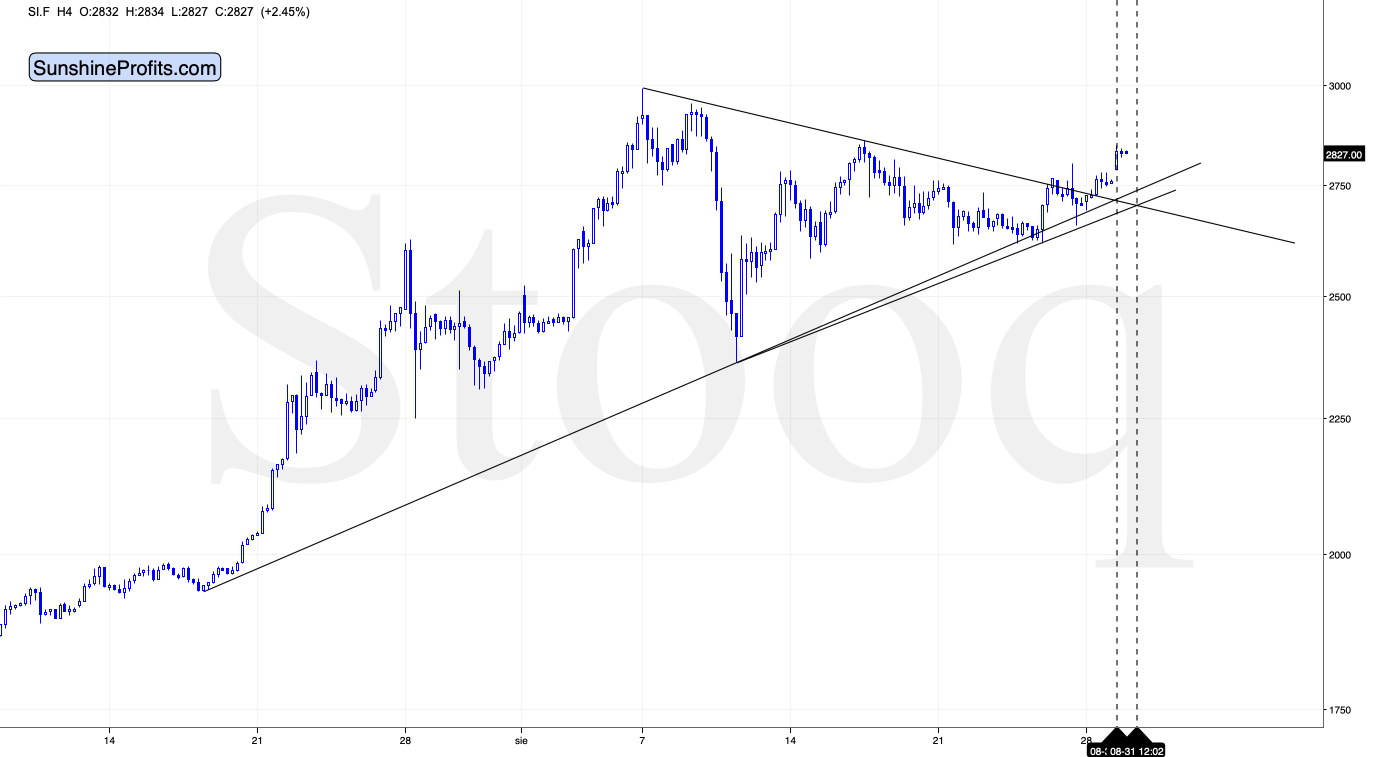
From the short-term point of view, silver is pointing to a reversal earlier - perhaps we saw it just several hours ago.
The white metal is stronger than gold is right now, as it approached its mid-August high (while gold didn't), but it's not something bullish. After all, silver tends to be particularly strong relative to gold before the biggest declines.
From the long-term point of view, we see that silver is not that strong.
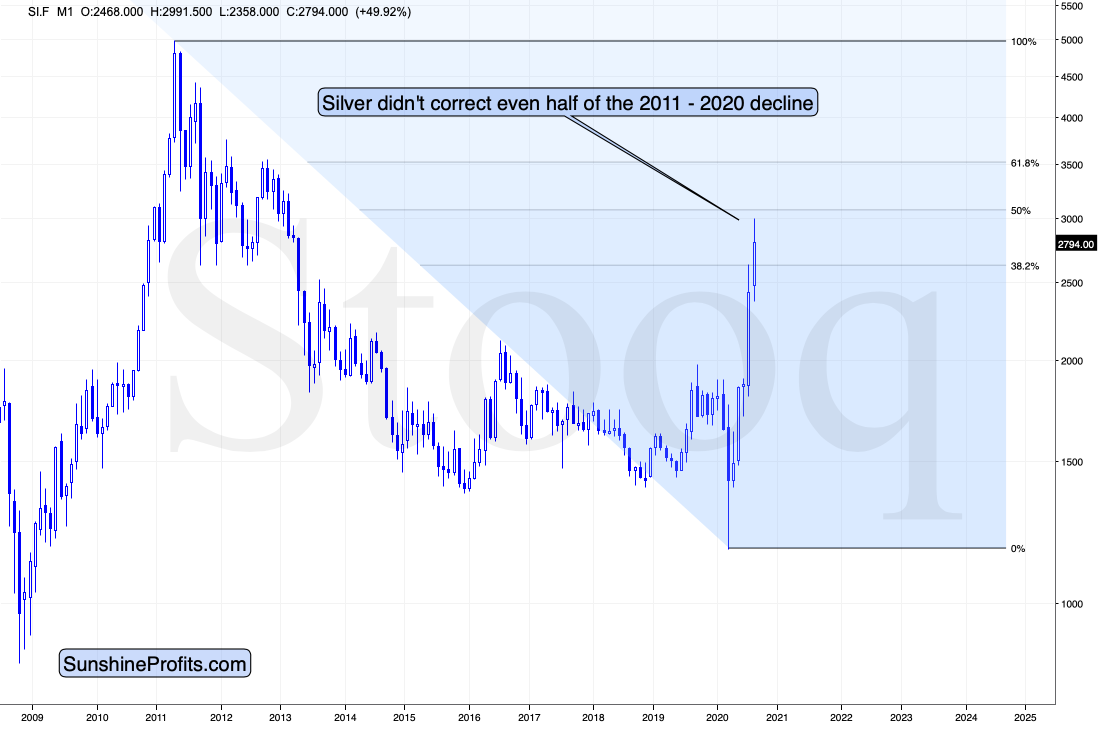
While gold moved to new highs, silver - despite its powerful short-term upswing - didn't manage to correct more than half of its 2011 - 2020 decline.
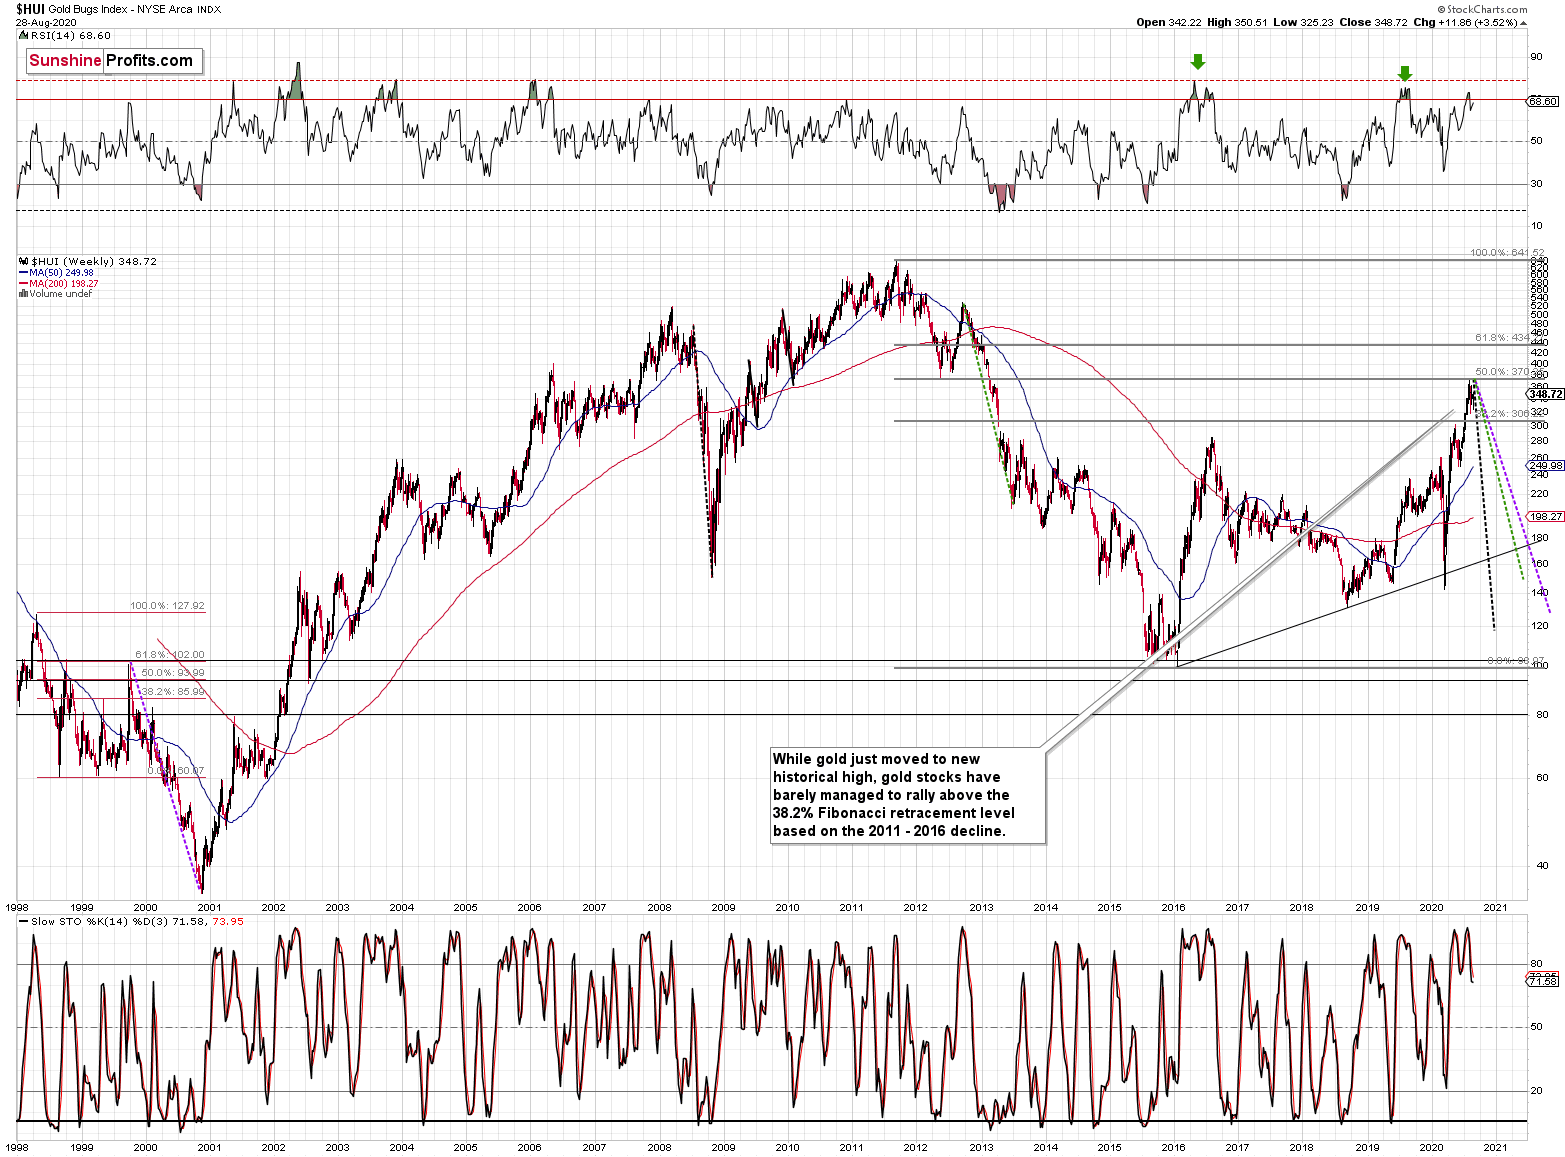
We see something similar in the HUI Index. The latter corrected half of its 2011 - 2016 decline and nothing more, while gold moved well above its 2011 high.
All in all, it's mostly gold that is making the major gains - not the entire precious metals sector.
Before completing today's analysis, we would like to reply to a question that we received recently, and one more time discuss the alternatives to the precious metals ETFs that are being retired (like DSLV).
From the Readers' Mailbag
Q: Do you mean S&P 500 will decline first , only then there is chance of gold to decline or is there any other posibility also for gold to decline.
What is the linkage between usd index and S&P index .
A: Gold seems to have already topped - over $100 above the current price level, while the S&P continues to climb. What I think is likely that once the S&P 500 declines in a meaningful way, the decline in the precious metals sector is likely to accelerate. This is especially likely for mining stocks (initially) and silver (in the final part of the decline).
The link between the USD Index and S&P 500 changes over time but it's often (and this seems to be the case currently) negative. As the value of the U.S. currency erodes, the U.S. exports become more competitive and the U.S. stocks get a boost. Also, both markets are impacted by the monetary policy: more dovish policy is bearish for the USD (as there is likely to be more supply thereof) and bullish for the stock market (stimulus money in various forms for both: consumers and companies).
Moving to the leveraged proxies for the precious metals sector:
In general, as far as using leverage or shorting gold and/or silver is concerned through ETF/ETNs, I think that ProShares instruments are worth looking at. By that I don't mean that they are appropriate for everyone, and this should not be treated as an investment advice, but these investment vehicles are liquid, and they provide significant exposure for the prices of the underlying metals.
The symbols are:
- UGL - 2x long gold
- GLL - 2x short gold
- AGQ - 2x long silver
- ZSL - 2x short silver
The ETFs that were previous available, for instance the DSLV are no longer available (precisely, they have been delisted and further issuance has been suspended). The DSLV has been moved to pink sheets as DSLVF, so the trading is becoming less and less liquid. We suggest that anyone who has any remaining positions in DSLVF or DGLDF moves out of it and uses the much more liquid alternatives listed above regardless of the market moves and regardless of the status of their position. The odds of completing the trade successfully are higher in case of the liquid instruments (like ZSL or GLL) than in case of the less and less liquid instruments like DSLVF or DGLDF.
Naturally, this doesn't change our general suggestion to focus on mining stocks for the current trade - what we are writing above, is for those who wanted to participate in investment vehicles linked to gold or silver. As always - you will find details in the "trading" part below the summary of each premium analysis.
Overview of the Upcoming Decline
As far as the current overview of the upcoming decline is concerned, I think that it has already begun, at least in case of the mining stocks. It's still relatively unclear if gold makes another attempt to move to new highs before plunging below $1,800, but it now appears more likely that it won't.
During the final part of the slide, we expect silver to decline more than miners. That would be in tune with how the markets initially reacted to the Covid-19 threat.
The impact of all the new rounds of money printing in the U.S. and Europe on the precious metals prices is very positive in the long run, but it doesn't make the short-term decline unlikely. In the very near term, markets can and do get ahead of themselves and then need to decline - sometimes very profoundly - before continuing their upward march.
Summary
Summing up, it seems that after reversing $4 above our upside target, gold has finally topped, and that it formed the second top from the double-top pattern in mid-August. The USD Index appears to be forming a broad bottom, just like it did in 2008, 2011, and 2018. It's worth keeping in mind that while the USDX just moved to its recent lows, gold didn't move to its recent highs. This relative underperformance, along with the specific juncture at which the USD Index currently is, creates a very bearish environment for the precious metals market, especially for mining stocks. The decline in the latter is likely to accelerate once the general stock market finally declines.
Naturally, everyone's trading is their responsibility, but in our opinion, if there ever was a time to either enter a short position in the miners or to increase its size if it wasn't already sizable, it's now. We made money on the March decline and on the March rebound, and it seems that another massive slide is about to start. When everyone is on one side of the boat, it's a good idea to be on the other side, and the Gold Miners Bullish Percent Index literally indicates that this is the case with mining stocks.
After the sell-off (that takes gold to about $1,700 or lower), we expect the precious metals to rally significantly. The final decline might take as little as 1-6 weeks, so it's important to stay alert to any changes.
Most importantly - stay healthy and safe. We made a lot of money on the March decline and the subsequent rebound (its initial part) price moves (and we'll likely make much more in the following weeks and months), but you have to be healthy to really enjoy the results.
As always, we'll keep you - our subscribers - informed.
To summarize:
Short-term outlook for the precious metals sector (our opinion on the next 1-6 weeks): Bearish
Medium-term outlook for the precious metals sector (our opinion for the period between 1.5 and 6 months): Bullish
Long-term outlook for the precious metals sector (our opinion for the period between 6 and 24 months from now): Bullish
Very long-term outlook for the precious metals sector (our opinion for the period starting 2 years from now): Bullish
Our preferred ways to invest in and to trade gold along with the reasoning can be found in the how to buy gold section. Additionally, our preferred ETFs and ETNs can be found in our Gold & Silver ETF Ranking.
As a reminder, Gold Investment Updates are posted approximately once per week. We are usually posting them on Monday, but we can't promise that it will be the case each week.
Please note that this service does not include daily or intraday follow-ups. If you'd like to receive them, we encourage you to subscribe to our Gold & Silver Trading Alerts today.
Thank you.
Sincerely,
Przemyslaw Radomski, CFA
Editor-in-chief, Gold & Silver Fund Manager

