

Gold stocks just ended the week at a new 2019 high, while gold confirmed its breakdown in the most important - weekly closing price - terms. Who should one believe? Are gold miners leading gold higher just like it was the case many times, or "this time is different"? Let's delve into both the gold downswings and upswings. Sure, gold is likely to break above $2,000 eventually, but when and how this is going to happen will likely have profound impact on your savings. And it's up to you to make it affect you in a very positive way. So, are things this time really different?
Actually, this time does indeed appear to be different. Why? Because all the other important markets and gold stocks' own long-term perspective point to lower prices, just like gold does. Let's take a closer look.
Topping Signs in Gold and Silver

First of all, we see that gold has broken below the rising support line based on Friday's closing prices. It can be clearly seen on the above chart, even though the previous several days' action is particularly clear. On a side note, on Friday we featured a gold chart from another provider, and already showed our subscribers that gold had already broken and confirmed this breakdown in the previous days. Either way, we know have the most profound confirmation of the breakdown - the weekly closing price, and the implications are very bearish.
Also, please note that the volume that accompanied Friday's upswing was the lowest that we've seen in about a month. It was not small in absolute terms, but the relative comparison suggests that the buying power for gold is drying up.
Let's check what's happening in the silver world.
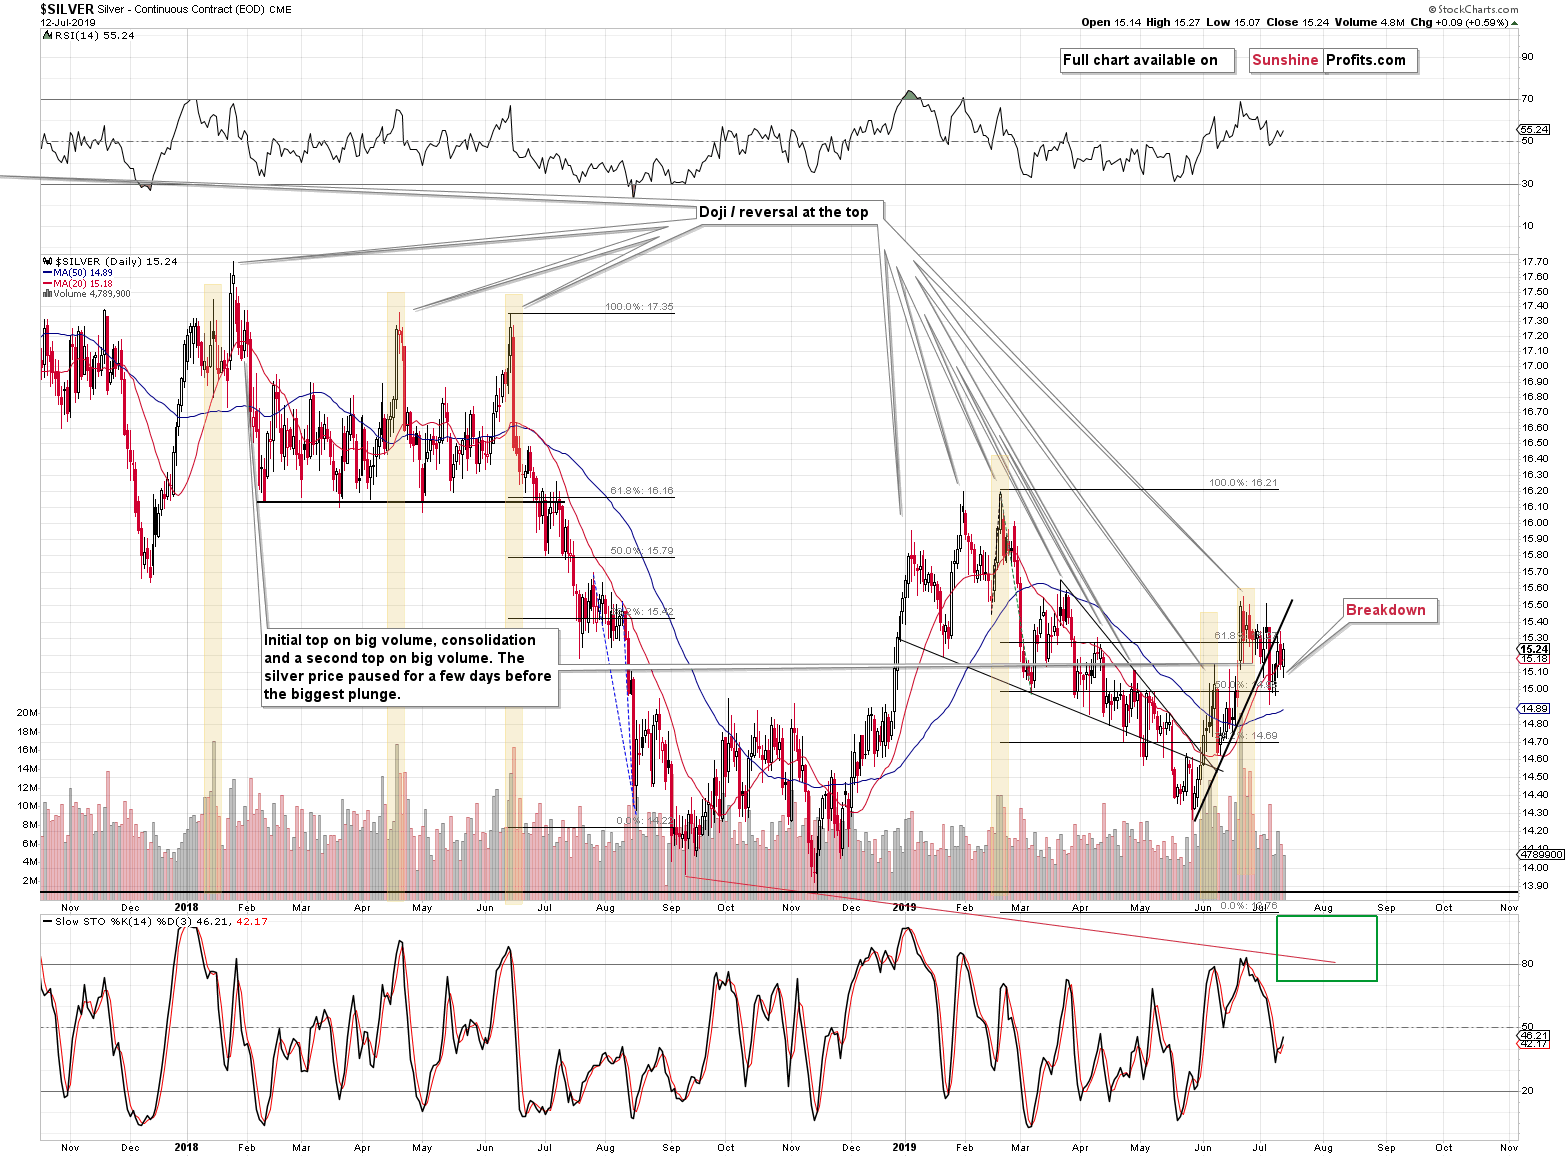
Pretty much the same thing. Silver confirmed the breakdown below its rising support line, then confirmed it in all possible ways, including by last week's weekly closing price. The implications are clearly bearish, especially that the breakdown materialized right after the highly effective topping sign - silver's outperformance of gold that was accompanied by huge volume. We marked similar cases with yellow rectangles, and they were all major tops.
The outlook based on the short-term gold and silver charts is clearly bearish. But that's not the case when one looks at the gold stocks' chart.
Meanwhile in the Mining Stocks...
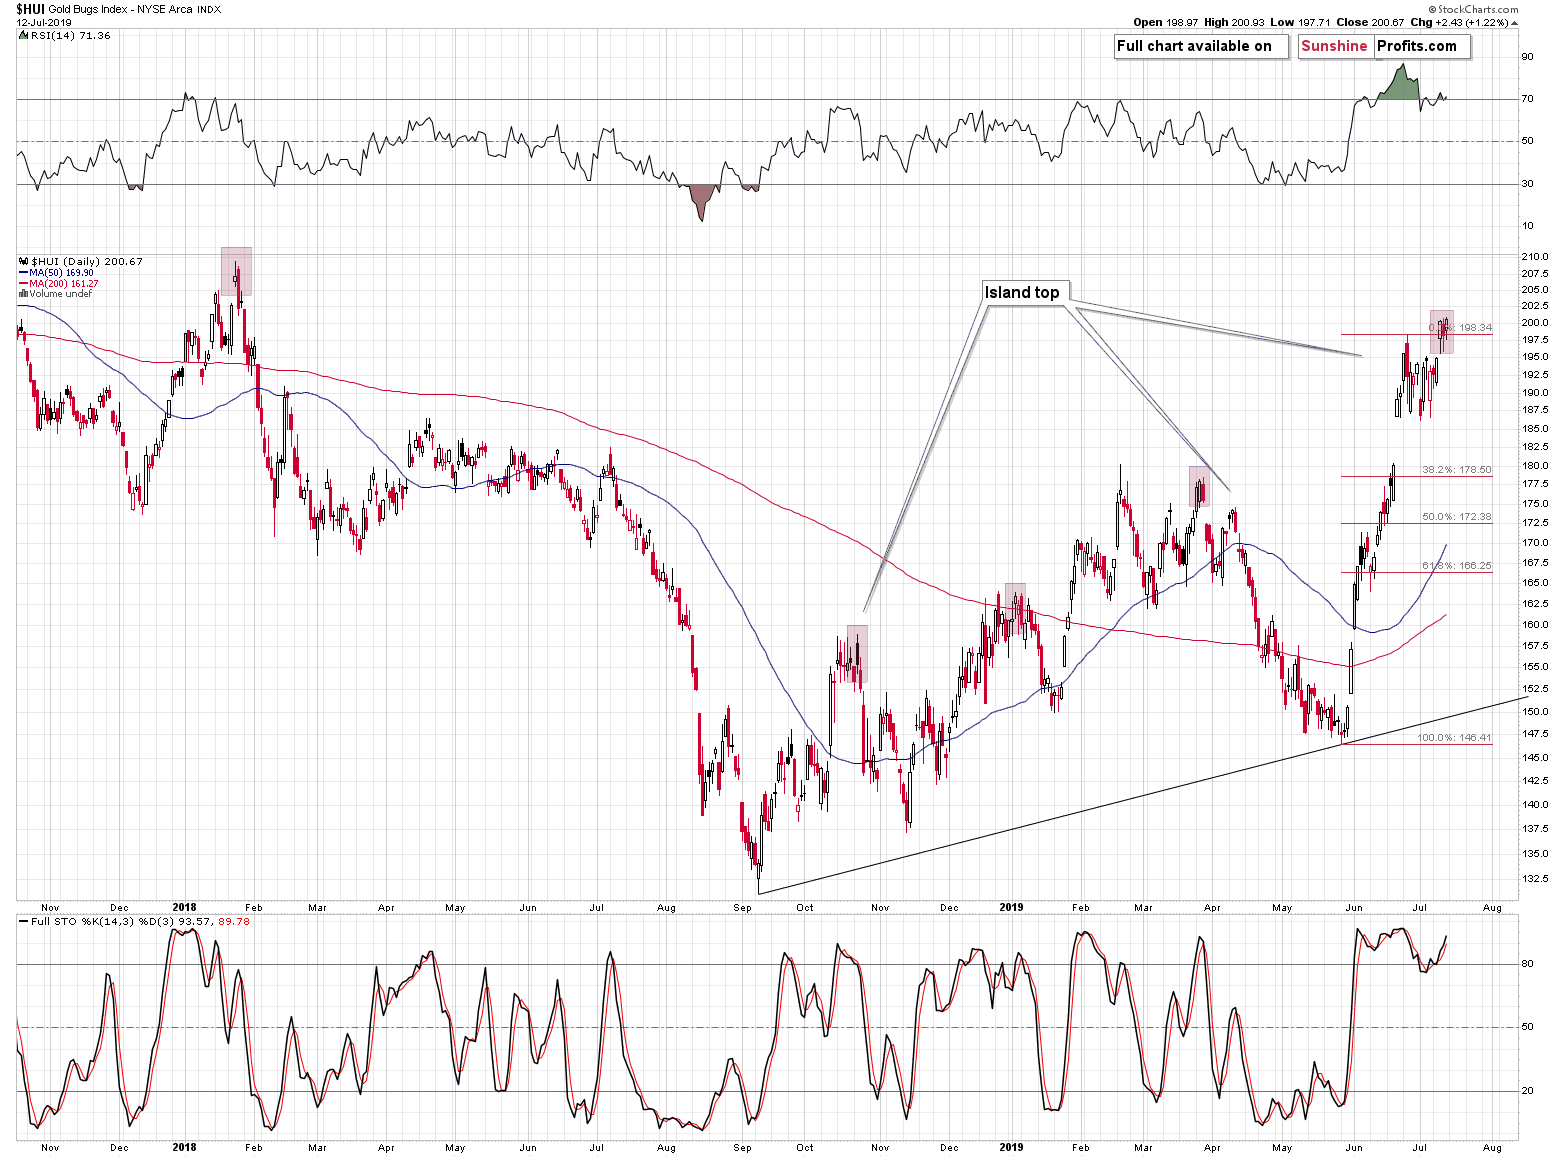
The HUI Index closed above the previous highs, and most importantly, it closed above the June high for three consecutive trading days. It also closed above it in terms of the weekly prices. Whatever bearish words we wrote about the breakdowns in gold and silver, turns to bullish in case of the gold mining companies.
Either metals, or miners will have to give in to the other.
But, is the mining stock sector comprised of just gold miners that are included in the HUI Index? Absolutely not. In case of the broader (i.e. covering more stocks) GDX ETF, there was no confirmed breakdown. We saw just another daily attempt to break above the June high after Wednesday's attempt was invalidated on Thursday. GDX does not confirm the bullish nature of the HUI's breakout.
And what about the silver stocks?
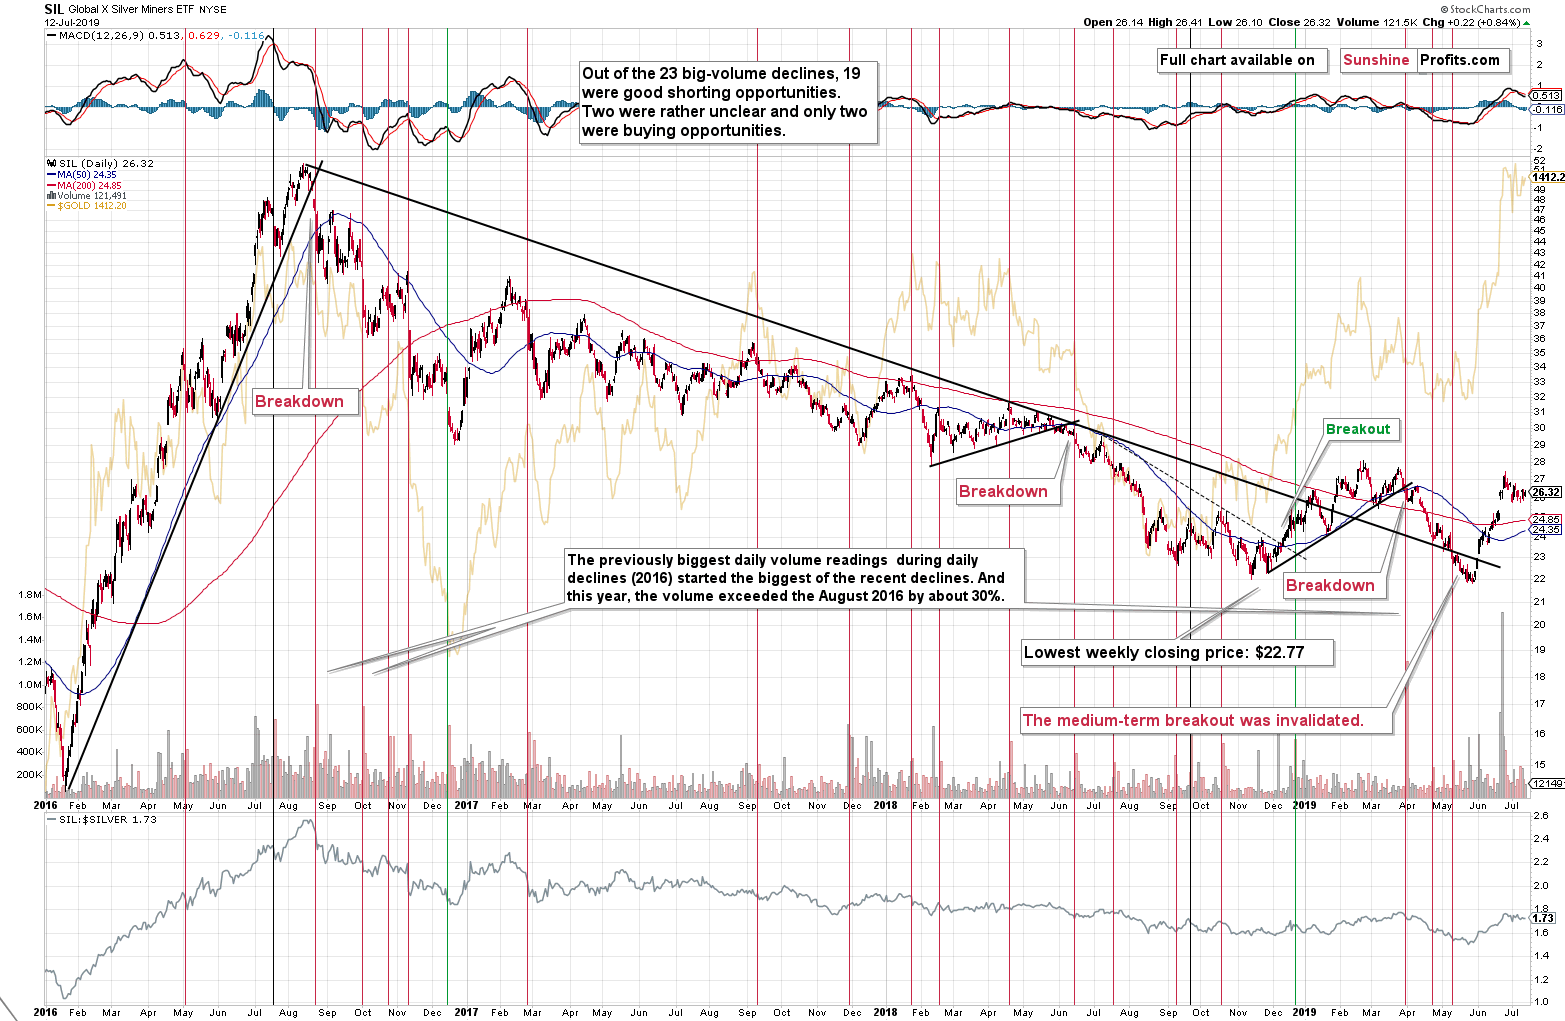
There was no breakout to speak of and the outlook in this case remains strongly bearish. Strongly, because of several factors, one of the most important being the extreme volume reading that we just saw.
It happened after a sizable rally and at that time we emphasized that it very likely marked the end of the rally. It appears that it was indeed the case. Silver miners didn't move above the extreme-volume high ever since.
Another reason for the situation to be bearish is the recent very overbought reading from the RSI indicator. It was above 80 and that happened only several times in the previous years. The only two bullish cases when that happened, were during 2016 and when we saw breakout to new highs in 2010. The size of the current upswing clearly shows that this move is not like the 2016 move and the situation in gold and silver clearly shows that this situation doesn't look like what we saw in 2010 either.
What we see now, is much more similar to what happened in late 2012 or mid-2014, which is where silver miners topped along with gold stocks, and the underlying precious metals: silver and gold.
With such meaningful bearish indications from the silver miners, should one trust the confirmation of the breakout in gold stocks, especially in light of no confirmation from the GDX ETF? Absolutely not.
Let's see how it all looks from the broad perspective.
The Big Picture in Gold and Silver
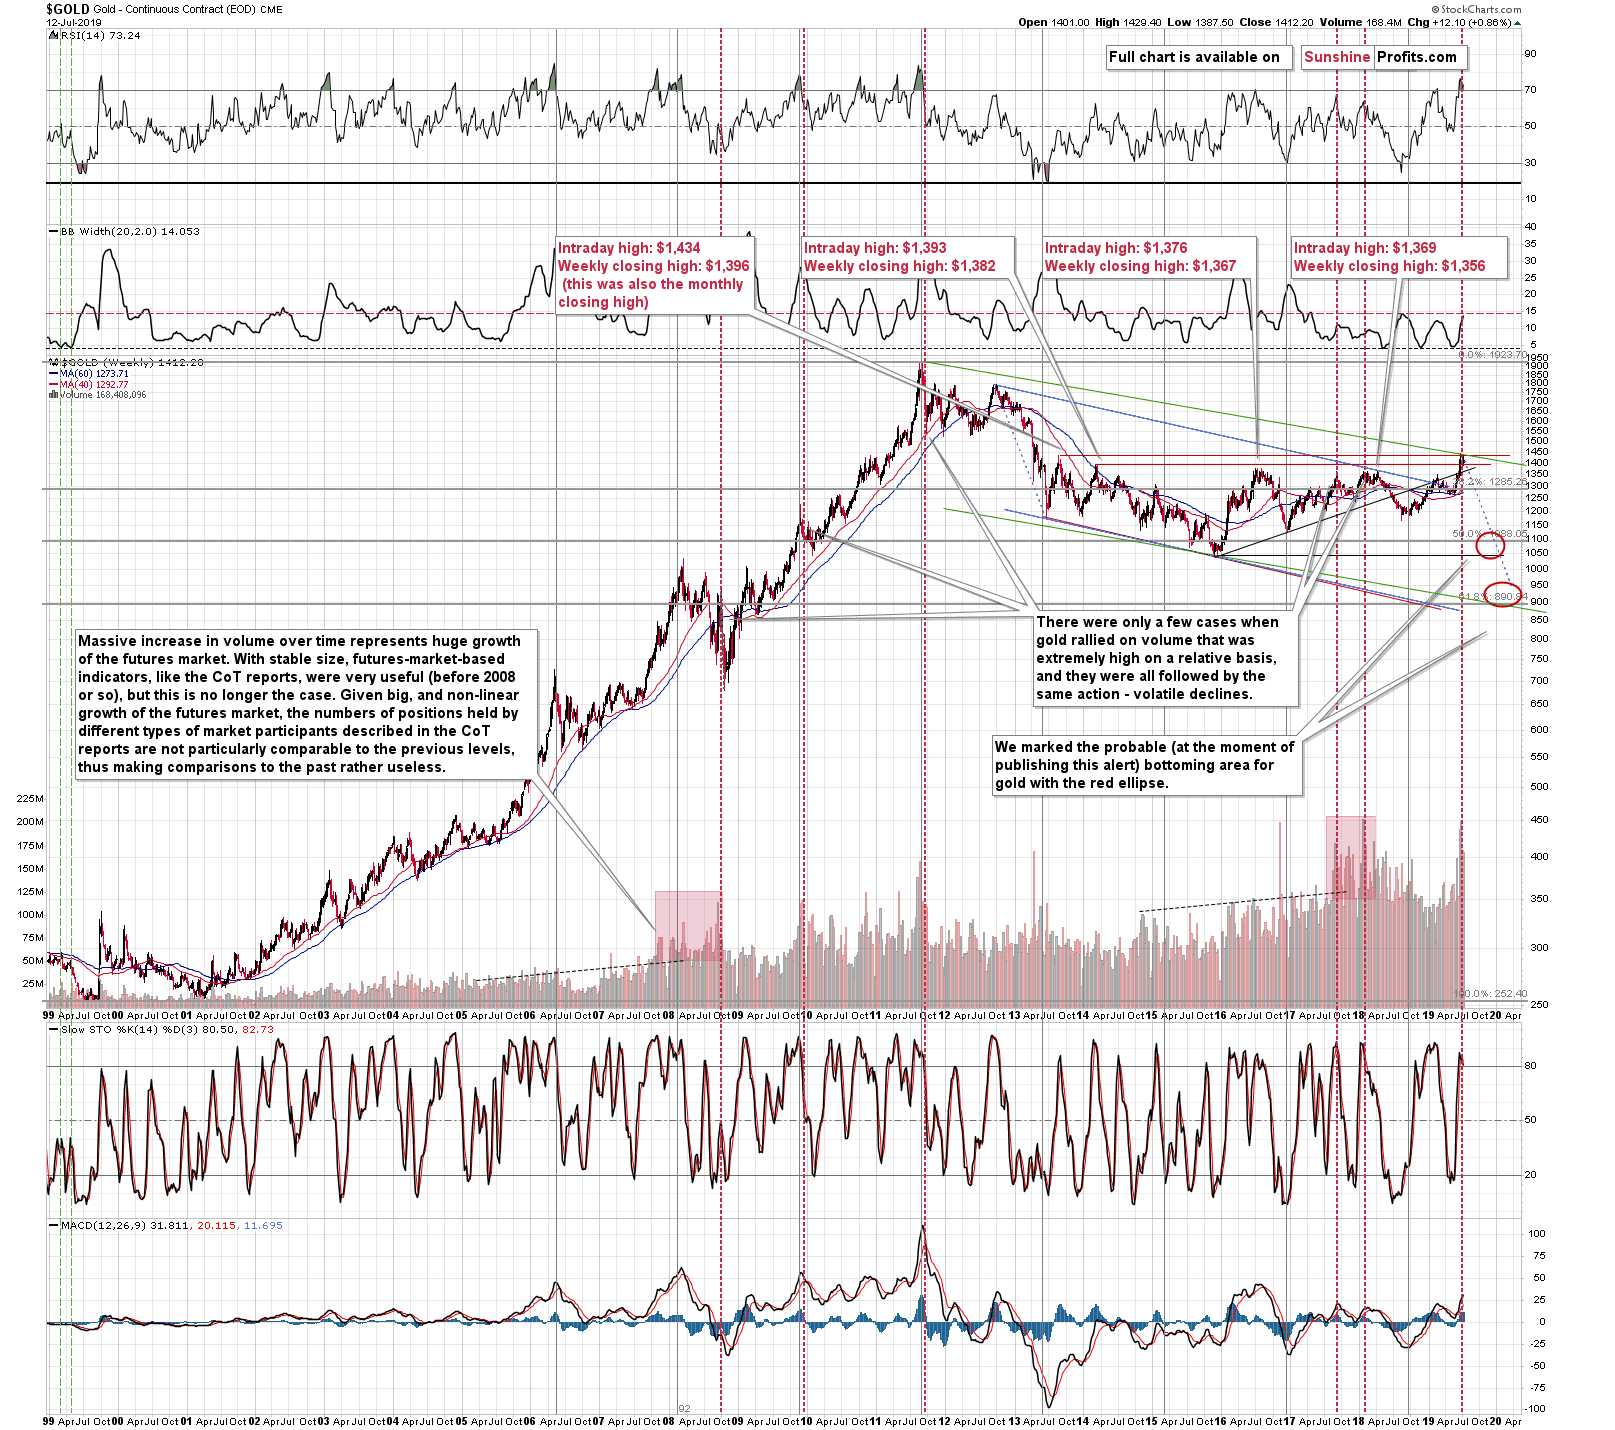
Gold is after a powerful weekly reversal that materialized on huge volume, which took place while gold failed to break above the mid-2013 high and while the RSI recorded very overbought readings.
Does the above look bullish at all? No, it's one of the most bearish combinations imaginable.
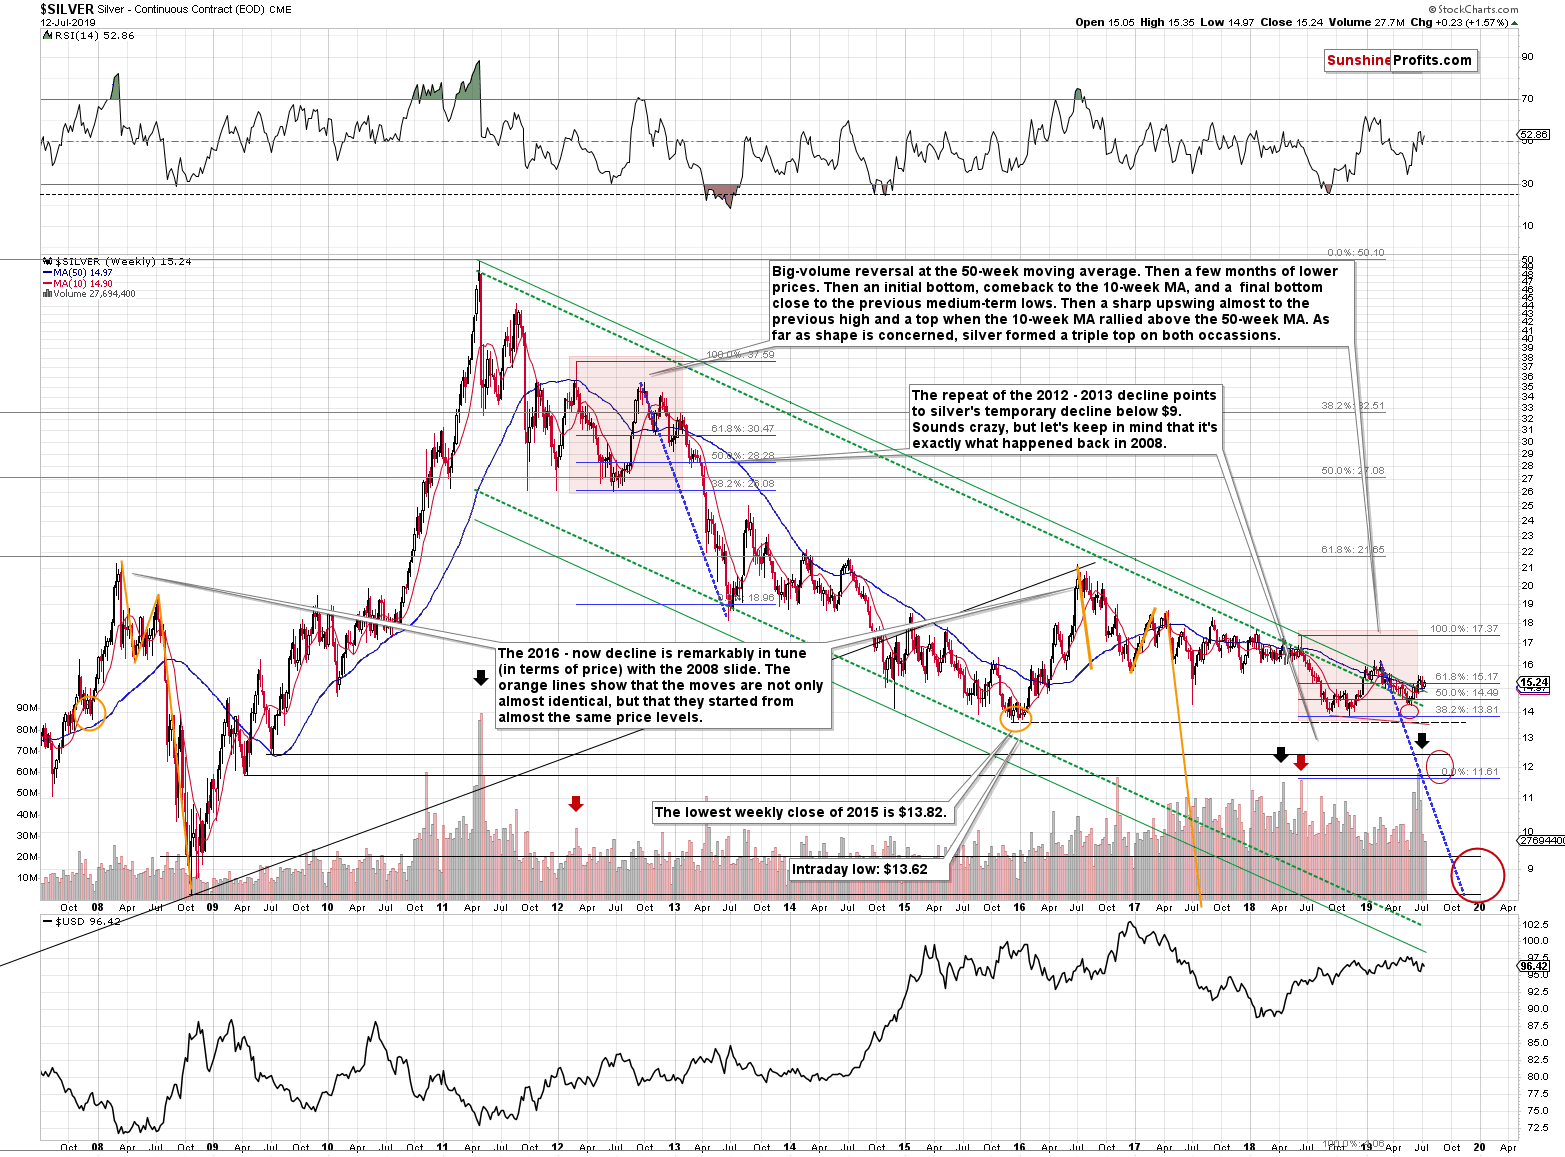
If you had to look at the above chart for just a second, and then recall from memory where silver price was trading, you'd probably say that it's at the multi-year lows. And that's true - from the long-term point of view, the recent move higher is barely visible and given silver's volatility, the 2015 low is within the range of a single day's decline. This may seem impossible if you've been drawn to the silver market just recently, but there have been many times in the last several years, when silver moved a few dollars in just one day.
There will definitely be days when silver moves more than $1 during the session or even outside of it. There will also likely be days when silver moves more than $10 in one day, but we will most likely have to wait silver to break above the 2011 high first.
If the second most popular precious metal refuses to confirm the most popular metal's rally, can the latter really be trusted? When Charles Dow formulated his Theory, he emphasized that in order for a primary trend buy or sell signal to be valid, both: the Industrial- and the Rail Average must confirm each other. The same principle can be applied to the precious metals market and the bullish picture for the PM sector simply doesn't hold when looking at silver, and the silver price prediction tools.
Before moving further, please make sure that you take note of and keep in mind that near-perfect analogy in terms of price to what happened in 2008. The 2015 bottom and the late-2017 bottom are the staring points of the analogy and the following size of rallies and declines are almost identical. The same goes for the price levels that were reached. This analogy currently suggests that silver will need to move below $10, and most likely below $9, before it can rally profoundly once again.
And what about the gold miners?
The Miners' Big Picture
In short, our previous comments on the above chart, remain up-to-date:
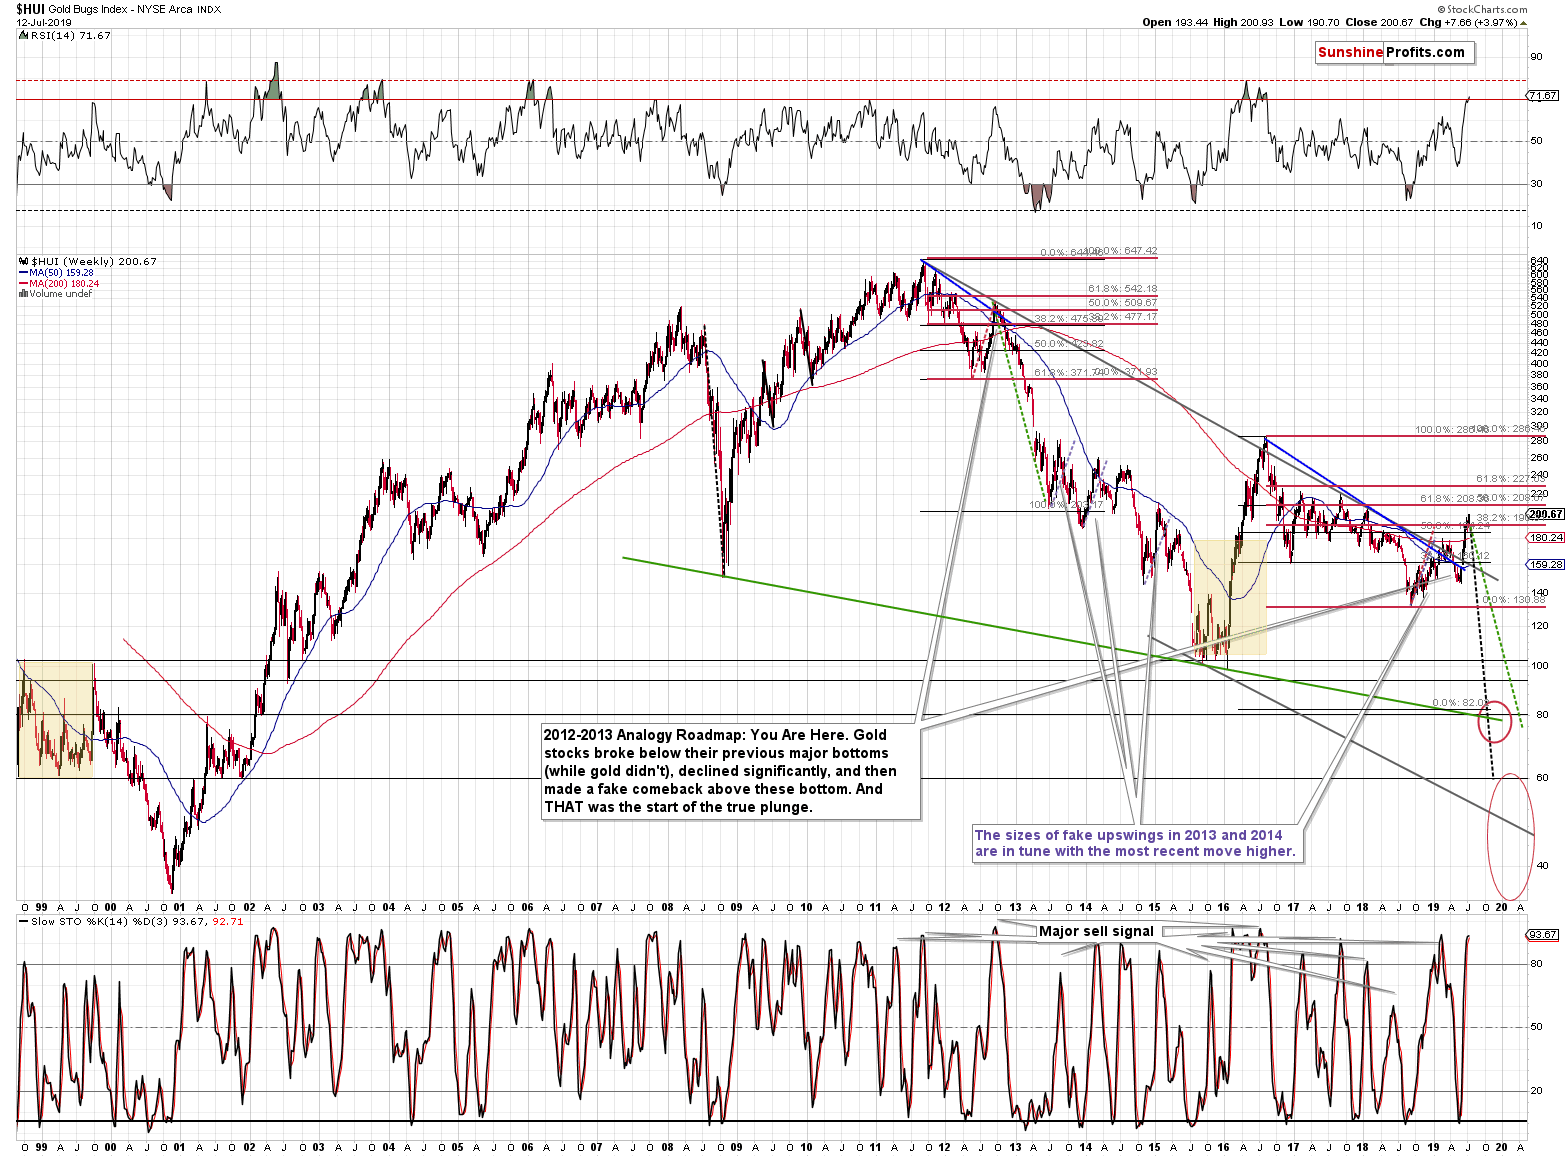
Even taken together, this and last years' rally in the gold miners is very small to compare to the 2016 upswing, let alone to the enormous 2011 - 2016 decline. It's just a relatively small correction within a much bigger downtrend. By being bearish here, we are not against the major trend - we are in tune with it.
Some may say that the HUI Index broke above the very long-term declining resistance line based on the 2011 and 2012 tops, which makes the outlook bullish. However, they forget that the same thing happened at the very top that we saw in 2016. And they forget that given where gold is right now (above its 2016 high) the size of the recent upswing in the miners is very weak.
The current move is much more similar to the 2014 or 2015 corrective upswings than it is to the 2016 rally or to the beginning of the 2000s bull market. And what followed the 2014 and 2015 corrections? Big slides during which miners didn't look back until they reached new lows.
The more fundamental thing about all this that was mentioned in the question is that the miners are suggesting that this is not the beginning of a new powerful upswing that would take gold much higher eventually. It strongly indicates that we will need to see a bigger price decline first.
(...) Please take a look at the rally that we saw right before the late 2012 top that directly preceded the biggest decline in the miners of the last several decades. It was not as big as the current upswing, but it was only a little smaller (of course percentage-wise - in absolute terms, the previous rally was much bigger). But when we compare both to the sizes of the preceding downswings (the 2011-2012 decline and the 2016-2018 decline), we see that the current rally is a bit smaller.
The previous upswing corrected a bit over 50% of the preceding decline, and the current upswing corrected a bit over 38.2% of the preceding decline (and bit less than 50%). The final part of the late-2012 upswing was similarly sharp as the current upswing is. However, while the late-2012 top in gold was very close to its late-2011 top, we definitely can't say the same thing about the HUI high. In late 2012, gold miners topped almost 100 index points below the late-2011 top. That's very similar to what's happening here. Gold moved to the previous high but failed to break above it (the late-2013 high that is), but gold miners were not even close to the analogous price level (it's about 80 index points higher). The history rhymes and this similarity has very bearish implications for the following weeks and months and the current strength appears to be just a correction within a bigger downtrend.
The USD Index Examination
The USD Index declined on Friday, but it moved below Thursday's low by just 0.02 in terms of the intraday lows. Consequently, everything that we wrote on Friday, including the comments on the possible inverse-head-and-shoulders pattern, remains up-to-date:
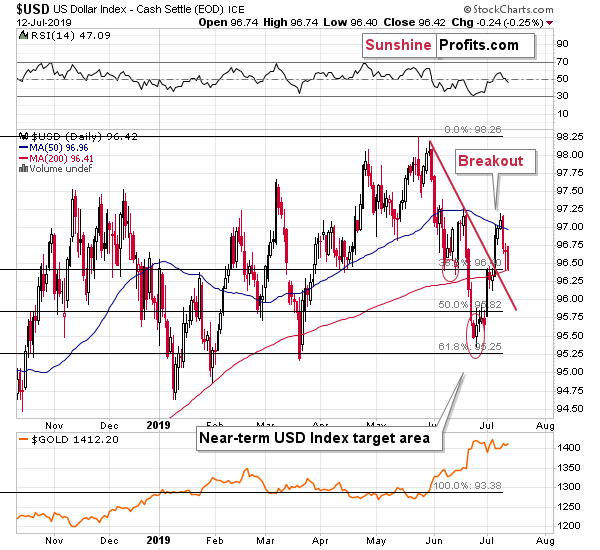
The USD Index formed a bullish reversal yesterday, which means that the post-breakout pullback may already be over. If we see higher USD values here - and we are likely to see them - then the USD might soon complete an inverse head and shoulders pattern. The early June bottom would be the left shoulder and the current bottom would be the right shoulder. This pattern - if it is completed - would imply a rally at least as big as the size of the "head" of the pattern starting from the "neck". The head's size is about 1.9, and the neck is at about 97.2, which implies an upside target of at least 99.1. This means a breakout to new 2019 highs.
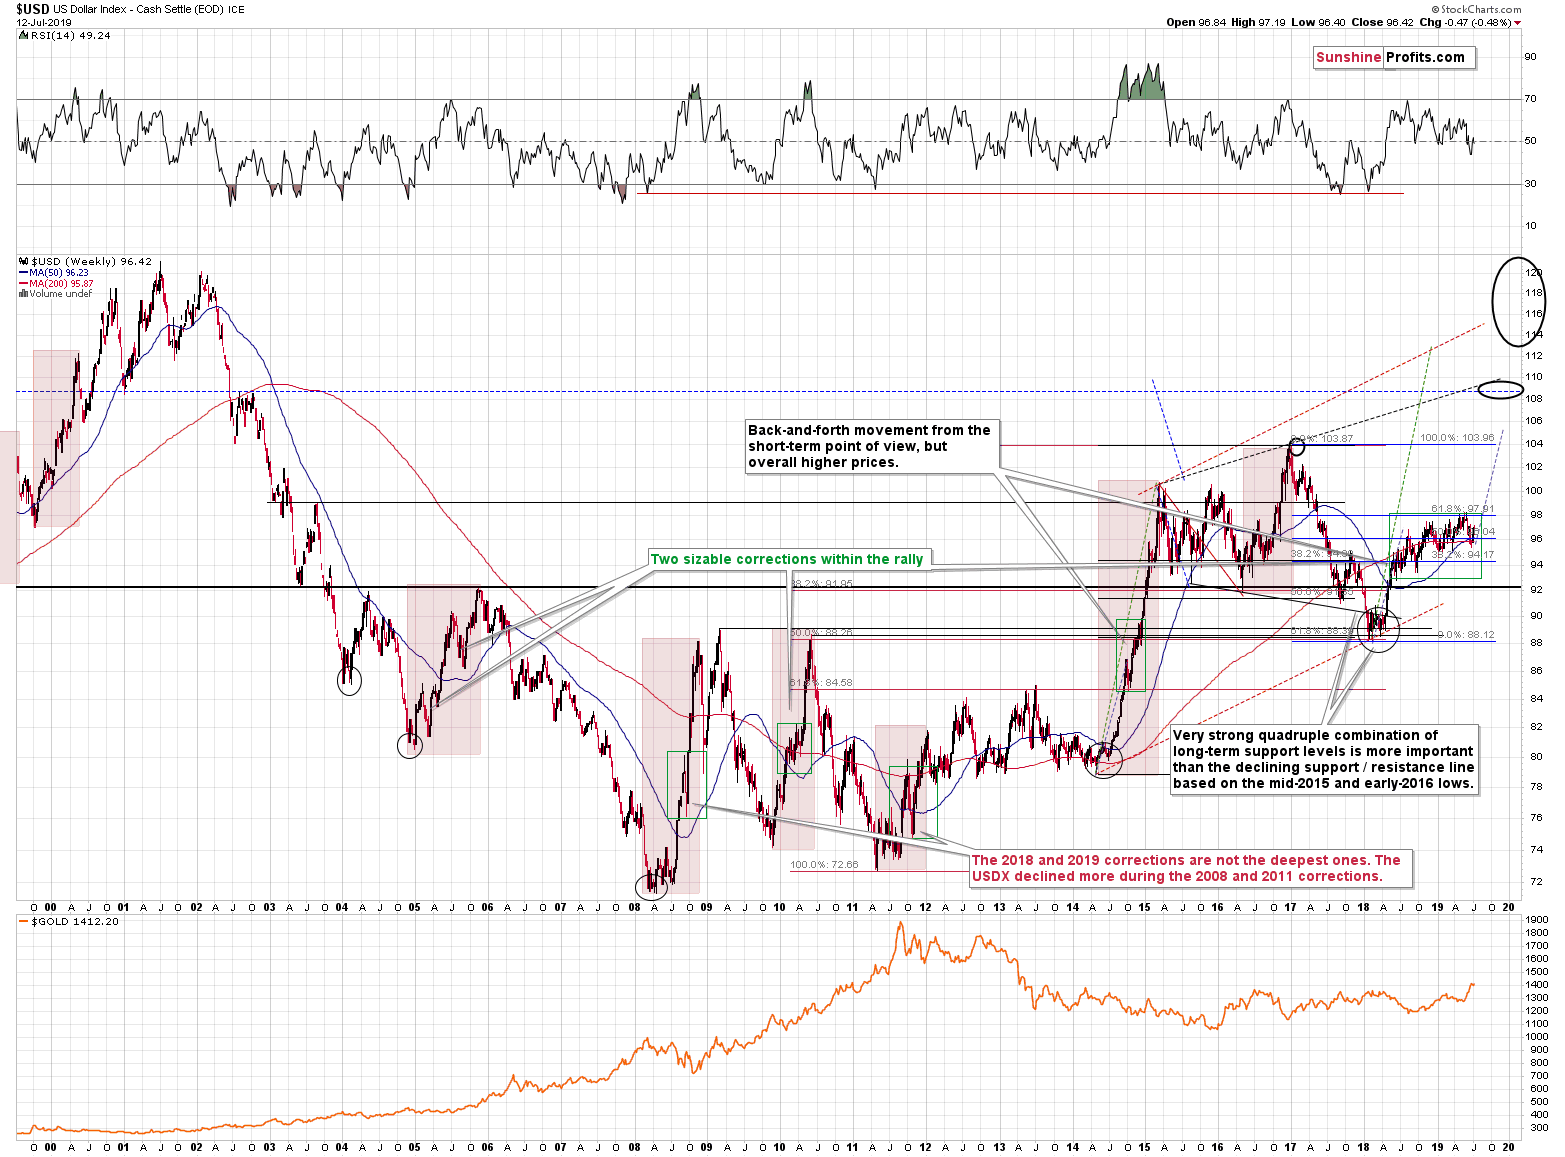
It would also mean a breakout above the running consolidation and this would imply an upside target of about 105, as the moves that follow consolidations tend to be similar to those that preceded them.
This, in turn, would imply a breakout above the 2016 / 2017 high that could - and likely would - result in an even more profound rally. The next big resistance is at about 108 level. Such a big USD rally is very likely to translate into new lows in gold.
There price of gold and the value of the USD Index don't move in perfect inverse tune at all times, but they move in the opposite directions in general, and big moves in the USDX are very unlikely to be ignored by the yellow metal. And this all might have started with yesterday's reversal.
Summary
Summing up, the bullish implications from the short-term breakout in gold stocks are overwhelmed by the bearish implications of what we see in other mining stock proxies: GDX and SIL - proxy for silver stocks, the short-term developments that we saw in gold and silver, and by the long-term outlook for gold, silver, gold stocks, and the USD Index.
Gold and silver confirmed their breakdowns below their rising short-term support lines - also in terms of the weekly close, which is yet another bearish factor currently in play for the precious metals market. The above happened in addition to and after we saw multiple long-term signs pointing to lower prices in the following months, i.a. the clear huge-volume-confirmed bearish shooting star candlestick in gold, huge volume topping signs from both: gold and silver, the triangle-vertex-based reversals, and epic volume from silver stocks. The next big move in the precious metals sector is most likely going to be down, not up.
Today's article is a small sample of what our subscribers enjoy regularly. For instance today, we have updated them thoroughly with a refreshed gold price path and also shared our lengthy take on the long-term perspective in gold. To keep informed of both the market changes and our trading position changes exactly when they happen, we invite you to subscribe to our Gold & Silver Trading Alerts today.
Thank you.
Przemyslaw Radomski, CFA
Editor-in-chief, Gold & Silver Fund Manager
Sunshine Profits - Effective Investments through Diligence and Care
