

Although currency bulls showed some strength after the drop below the lower line of the trend channel, the major resistances remain in the cards. Does this mean that we will see only a verification of the earlier breakdown in the coming days?
In our opinion the following forex trading positions are justified - summary:
- EUR/USD: none
- GBP/USD: none
- USD/JPY: none
- USD/CAD: short (a stop-loss order at 1.3221; the next downside target at 1.2790)
- USD/CHF: none
- AUD/USD: none
EUR/USD
Yesterday, we wrote the following:
How high could the pair go if currency bulls don’t fail?
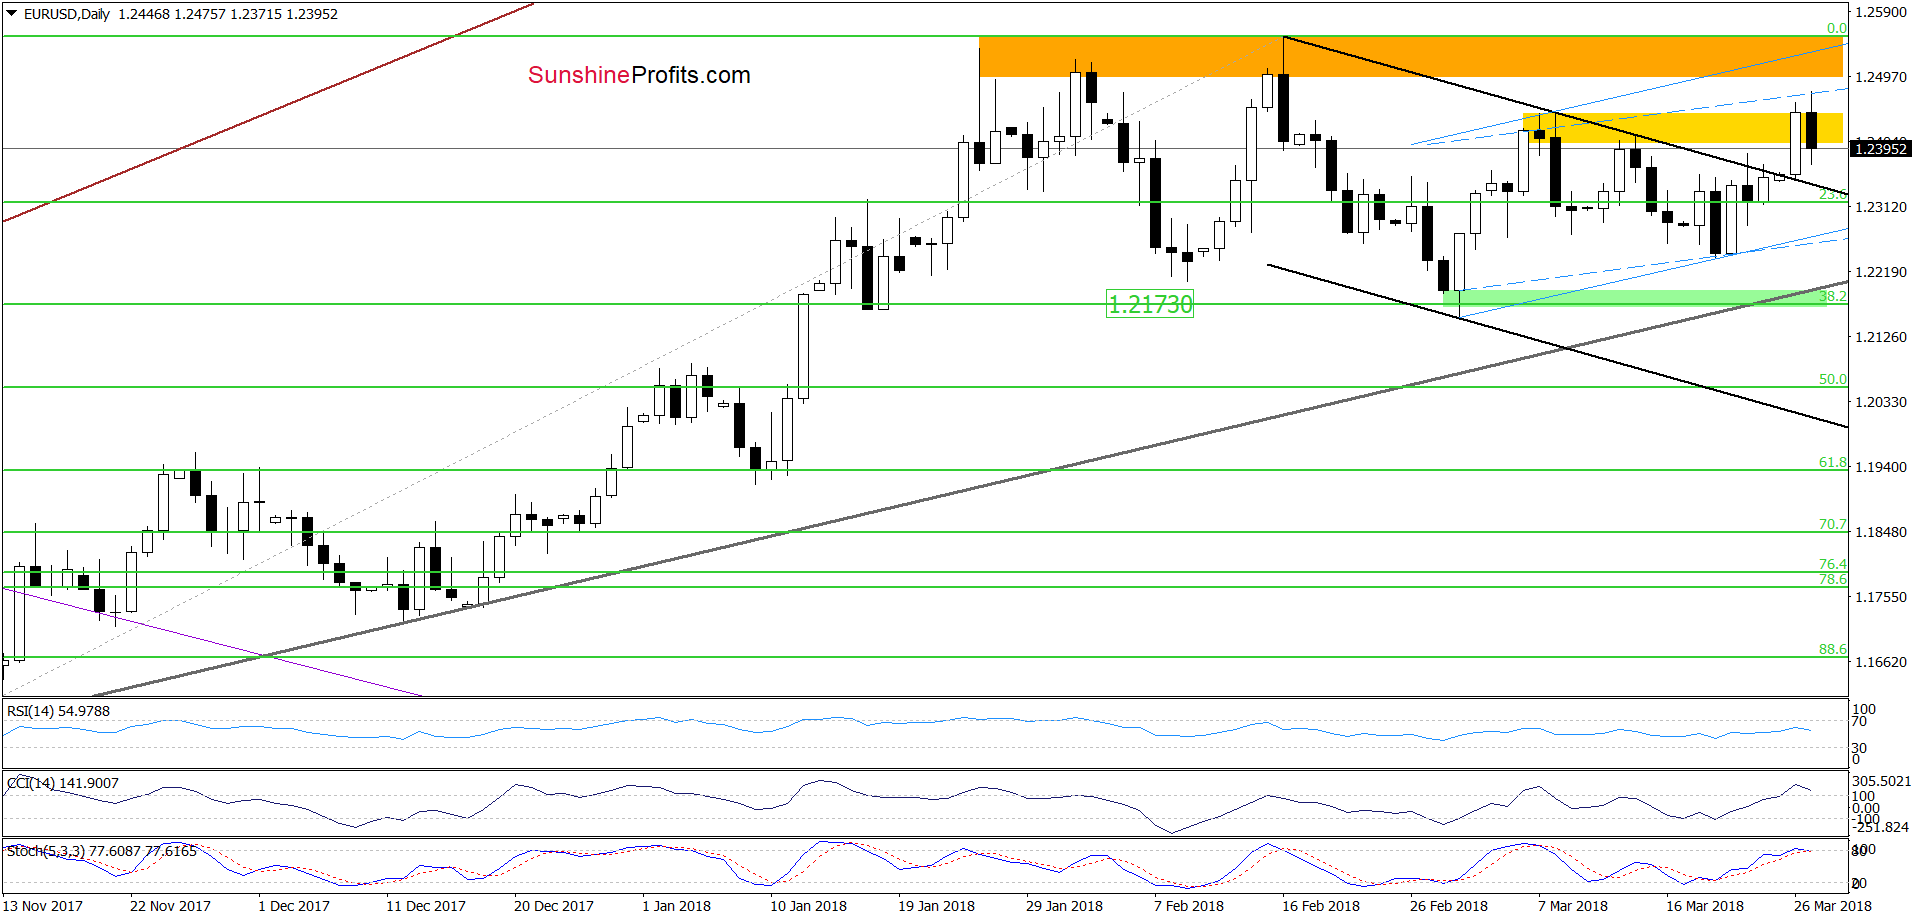
In our opinion, the first upside target will be around 1.2468, where the upper border of the blue rising trend channel based on the daily openings and closures (marked with dashed lines) currently is.
From today’s point of view, we see that the situation developed in line with the above scenario and EUR/USD reached our first upside target earlier today. Despite this improvement, currency bulls didn’t manage to hold gained levels, which resulted in a reversal in the following hours.
Thanks to today’s drop, the pair invalidated the earlier tiny breakout above the early March peaks which in combination with the sell signal generated by the Stochastic Oscillator (the CCI is very close to doing the same) increases the probability of further deterioration in the coming day(s).
If this is the case and the exchange rate extends losses, we’ll see a test of the strength of the previously-broken upper border of the black declining trend channel in very near future. If we see an invalidation of the breakout above this line, we’ll consider opening short positions.
Trading position (short-term; our opinion): No positions are justified from the risk/reward perspective now. We will keep you informed should anything change, or should we see a confirmation/invalidation of the above.
USD/JPY
Quoting our last commentary on this currency pair:
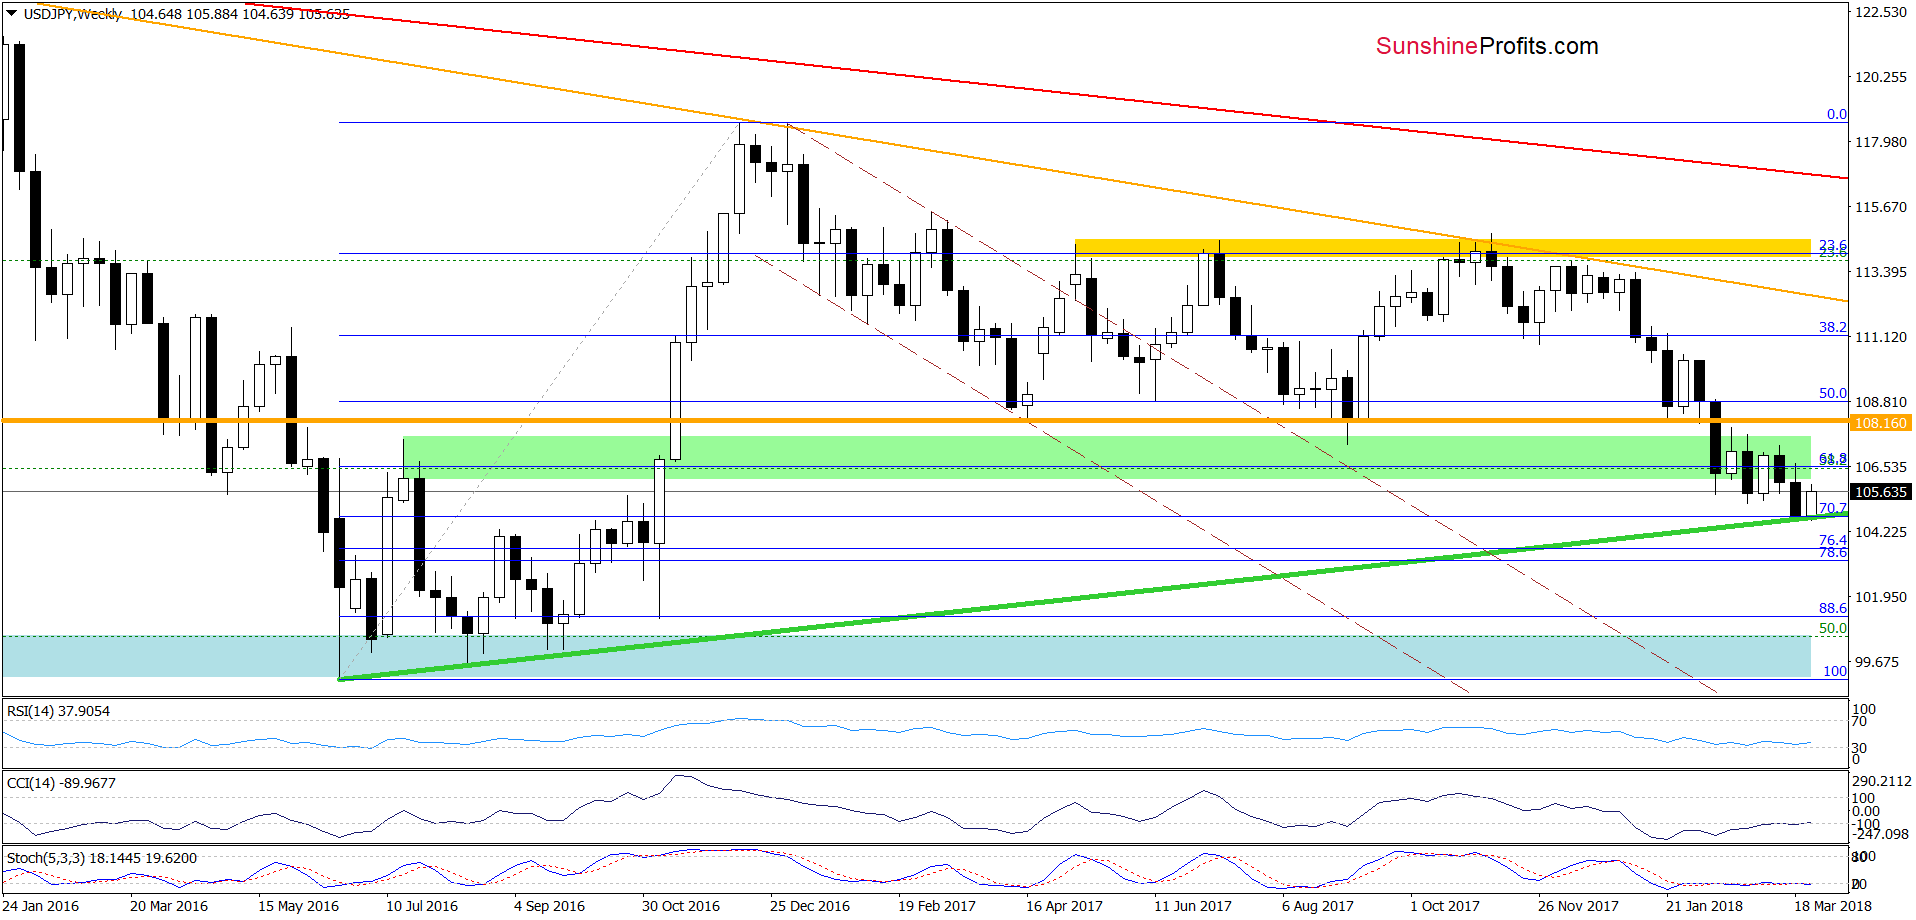
(…) the exchange rate slipped to the long-term green support line earlier this week, which in combination with the position of the medium-term indicators (they are oversold for some time) increase the probability of reversal and rebound in the coming week.
Looking at the weekly chart, we see that currency bulls took the opportunity and pushed USD/JPY higher as we had expected. Additionally, the Stochastic Oscillator generated the buy signal, suggesting further improvement in the coming week(s).
But will we see a bigger move to the upside?
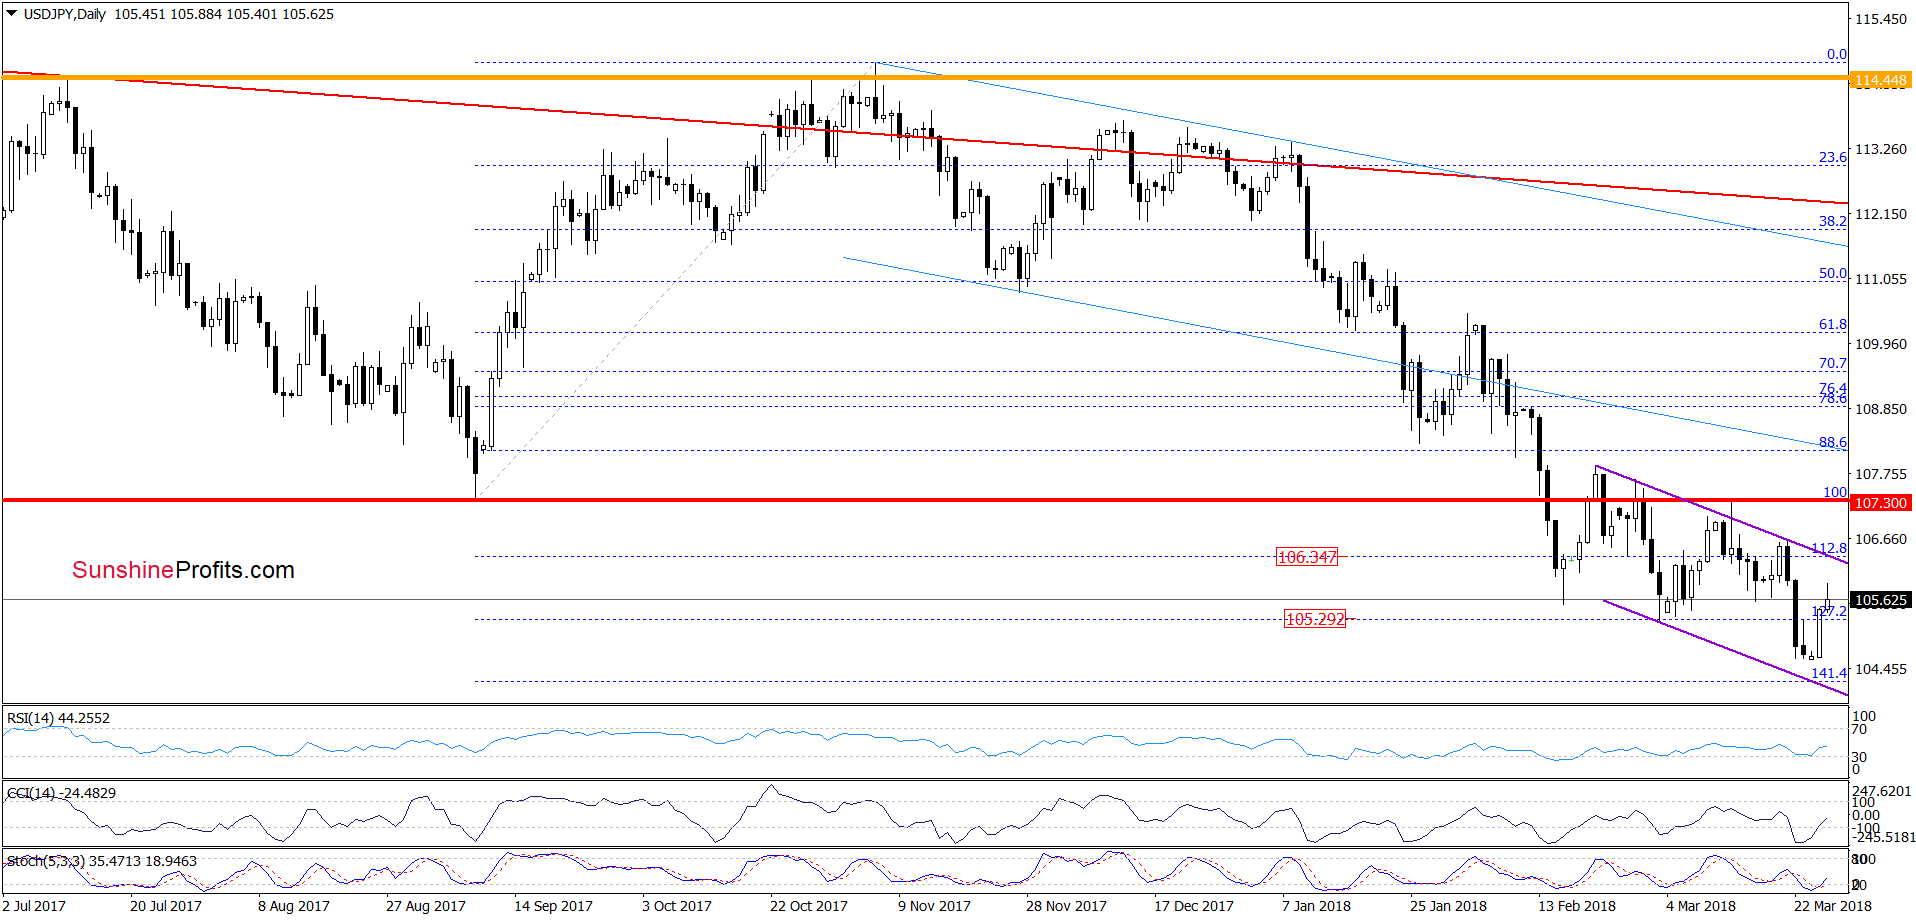
In our opinion, such price action will be more likely only if USD/JPY breaks above the upper border of the purple declining trend channel. Nevertheless, in our opinion, further rally will be reliable if the exchange rate climbs above late February high of 107.88 and invalidates the earlier breakdown under the red horizontal line based on the September low of 107.30.
Until this time, short-lived moves in both directions should not surprise us. Therefore, waiting at the sidelines for another opportunity is the best decision.
Trading position (short-term; our opinion): No positions are justified from the risk/reward perspective. We will keep you informed should anything change, or should we see a confirmation/invalidation of the above.
USD/CHF
Last Wednesday, we wrote the following:
(…) currency bulls triggered one more upswing yesterday, which took USD/CHF to a fresh March high. Despite this improvement, the (…) resistances together with the previously-broken lower line of the blue declining trend channel continue to block the way to the north.
Additionally, daily indicators are very close to generating the sell signals, which increases the probability that the next move will be to the downside. If this is the case, currency bears will re-test the strength of the lower border of the blue rising trend channel in the very near future.
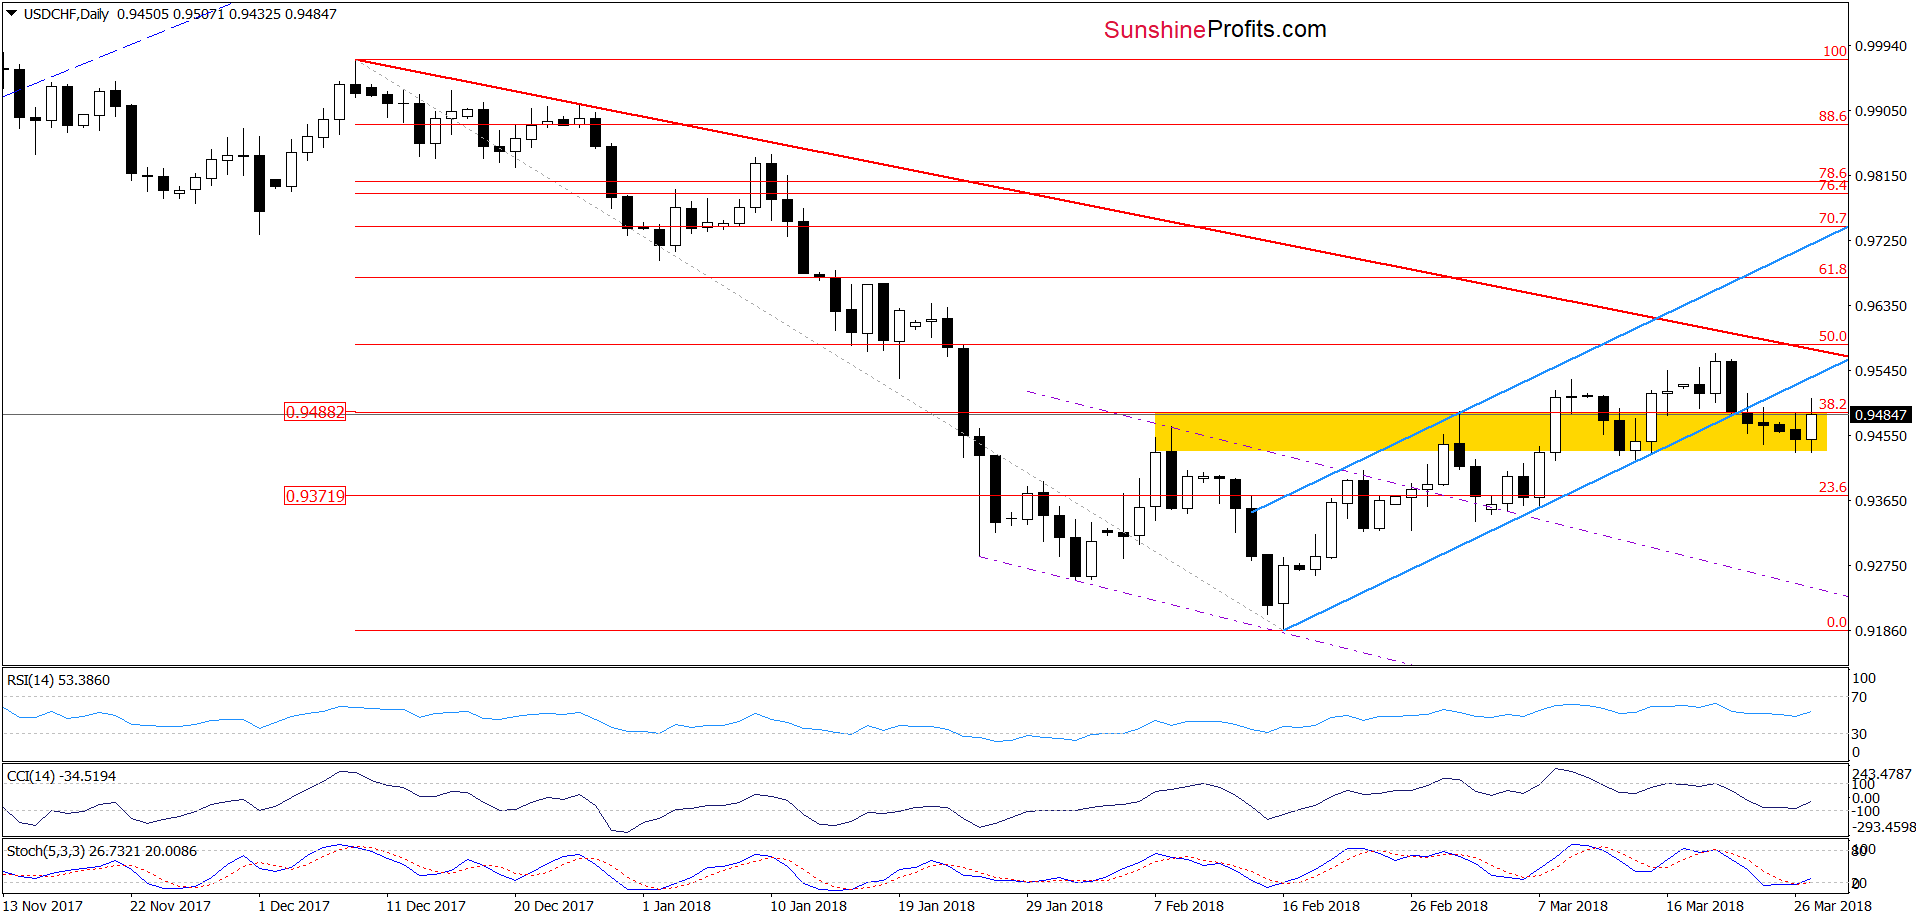
As you see on the daily chart, currency bears not only tested our first downside target, but also managed to push the pair below it. Although this was a negative development, the previously-broken yellow zone stopped declines, triggering a rebound earlier today.
The CCI and he Stochastic Oscillator generated the buy signal, suggesting that further improvement is just around the corner. Nevertheless, we think that as long as the pair is trading under the lower line of the blue trend channel all moves will be noting more than a verification of the earlier breakdown – especially when we factor in the medium-term resistances seen on the weekly chart below.
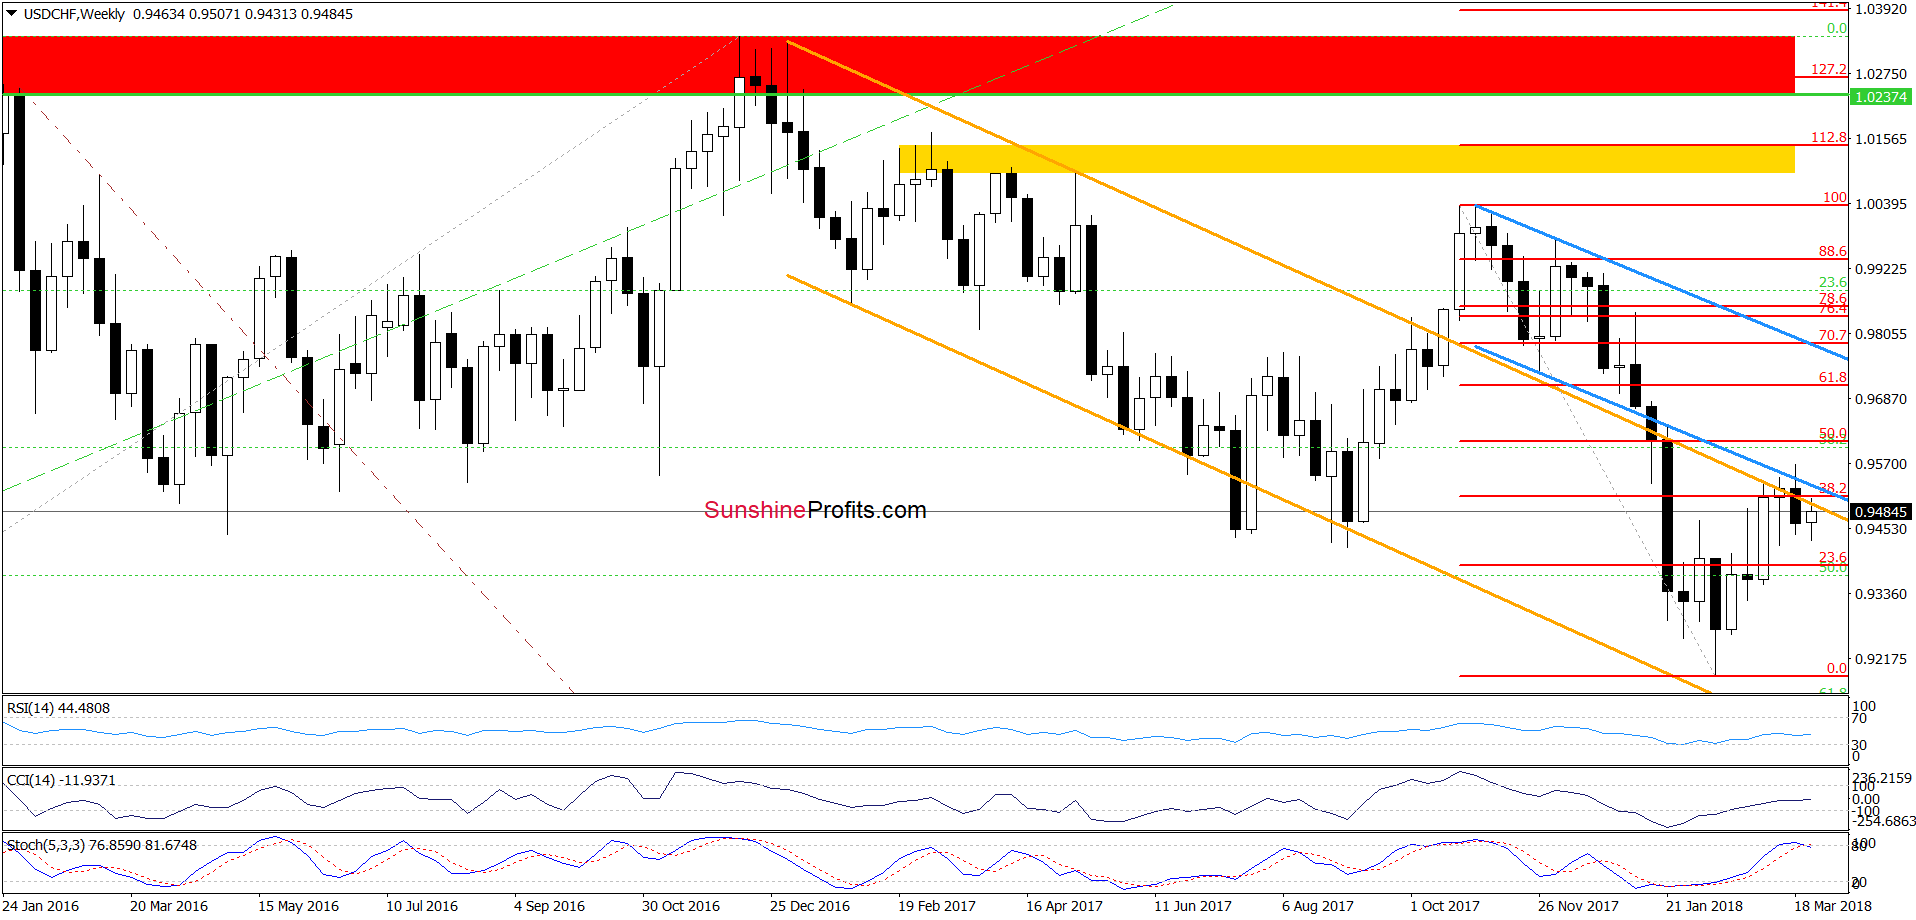
From this perspective, we see that the combination of the upper line of the orange declining trend channel, the lower border of the blue declining trend channel and the 38.2% Fibonacci retracement continues to block the way to the north. Therefore, as we mentioned earlier, higher values of the exchange rate will be more likely only if we see the breakout above this strong resistance area.
Trading position (short-term; our opinion): No positions are justified from the risk/reward perspective. We will keep you informed should anything change, or should we see a confirmation/invalidation of the above.
Thank you.
Nadia Simmons
Forex & Oil Trading Strategist
Przemyslaw Radomski, CFA
Founder, Editor-in-chief, Gold & Silver Fund Manager
Gold & Silver Trading Alerts
Forex Trading Alerts
Oil Investment Updates
Oil Trading Alerts

