

Reversal pattern, verification of the earlier breakdown, invalidation of the breakout and all these events in the shadow of the highlight of the month - the Federal Reserve's monthly policy decision that we’ll get to know later in the day. Stronger euro – weaker greenback or vice-versa?
In our opinion the following forex trading positions are justified - summary:
- EUR/USD: none
- GBP/USD: none
- USD/JPY: none
- USD/CAD: short (a stop-loss order at 1.3221; the initial downside target at 1.2918
- USD/CHF: none
- AUD/USD: none
EUR/USD
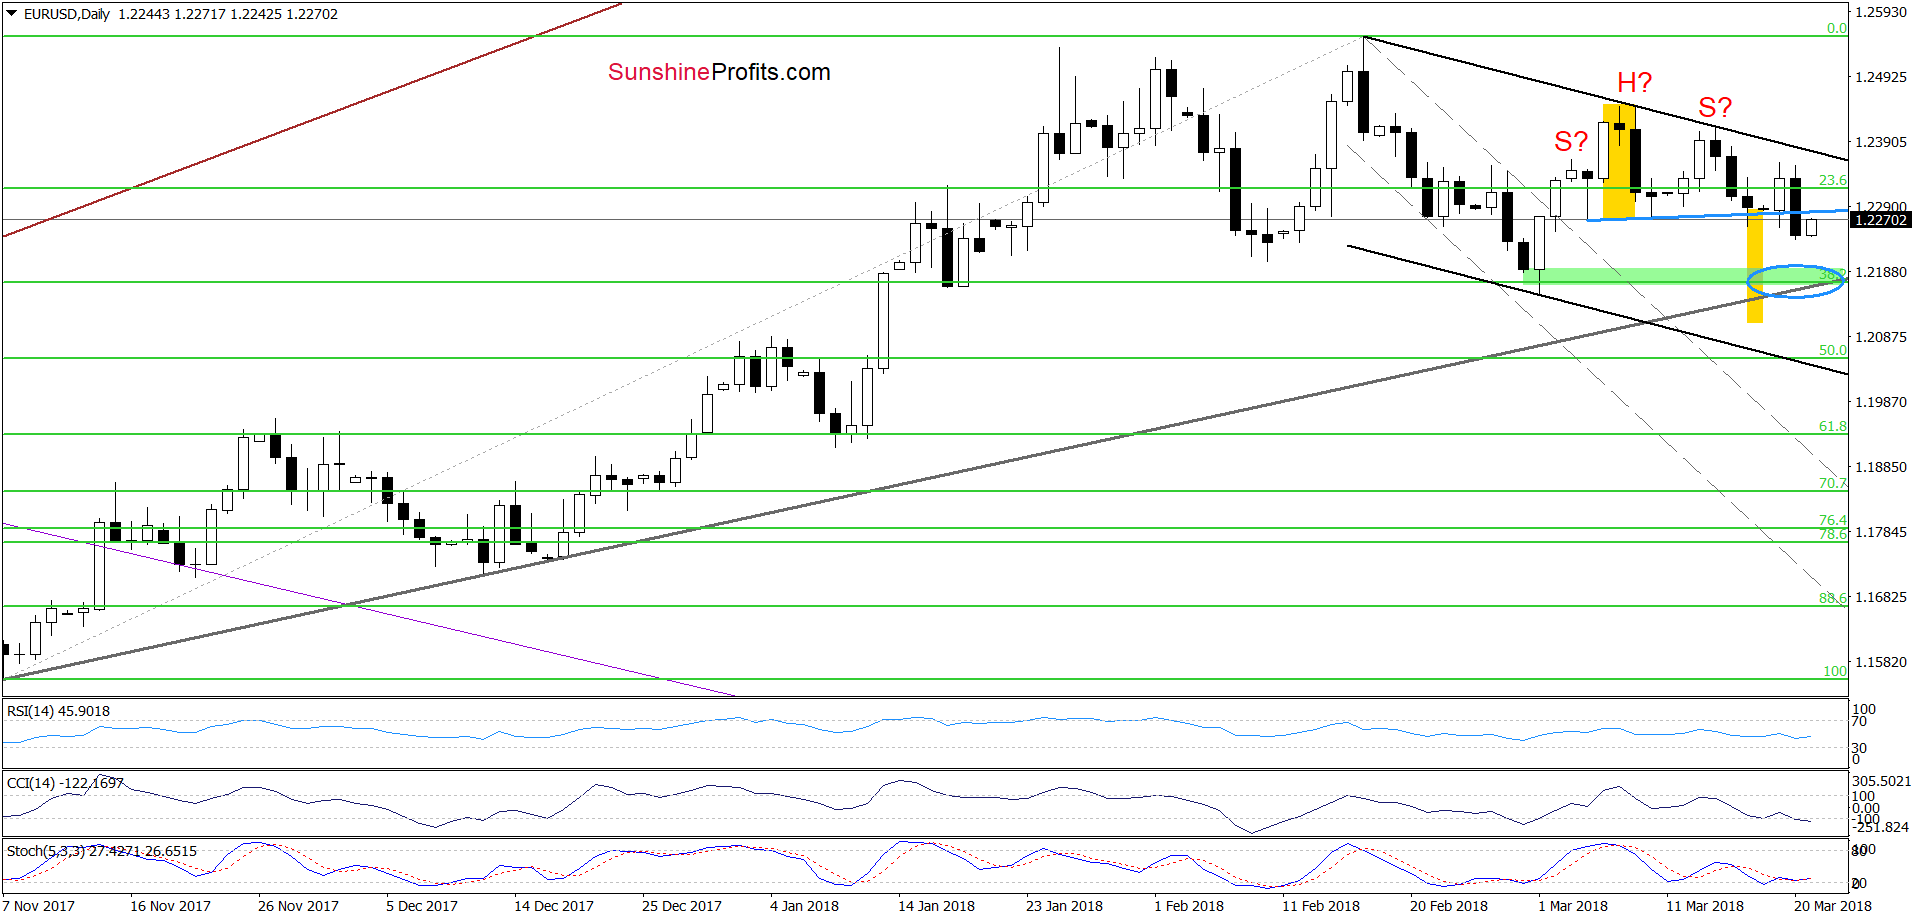
The first thing that catches the eye on the daily chart is a successful breakdown under the blue support line based on the previous lows (the neck line of the head and shoulders formation), which suggests further deterioration.
Earlier today, currency bulls pushed the exchange rate higher, which looks (at east at the moment of writing these words) like a verification of yesterday’s breakdown. If this is the case, the pair will reverse and decline later in the day.
Where will EUR/USD head next? In our opinion, if the pair doesn’t invalidate yesterday’s breakdown, the initial downside target will be around 1.2173-1.2192, where the green support zone created by the 38.2% Fibonacci retracement, late February lows and the medium-term grey rising support line currently are (we marked this area with the blue ellipse).
Nevertheless, taking into account the current position of the daily indicators (they suggest that the euro will extend gains against the greenback) and uncertainty around today’s Federal Reserve's monthly policy decision, we decided not to open short positions. We will pay attention to the U.S. dollar’s reaction later in the day and keep you informed should anything change.
Trading position (short-term; our opinion): no positions are justified from the risk/reward perspective now. We will keep you informed should anything change, or should we see a confirmation/invalidation of the above.
USD/CAD
On Monday, we wrote the following:
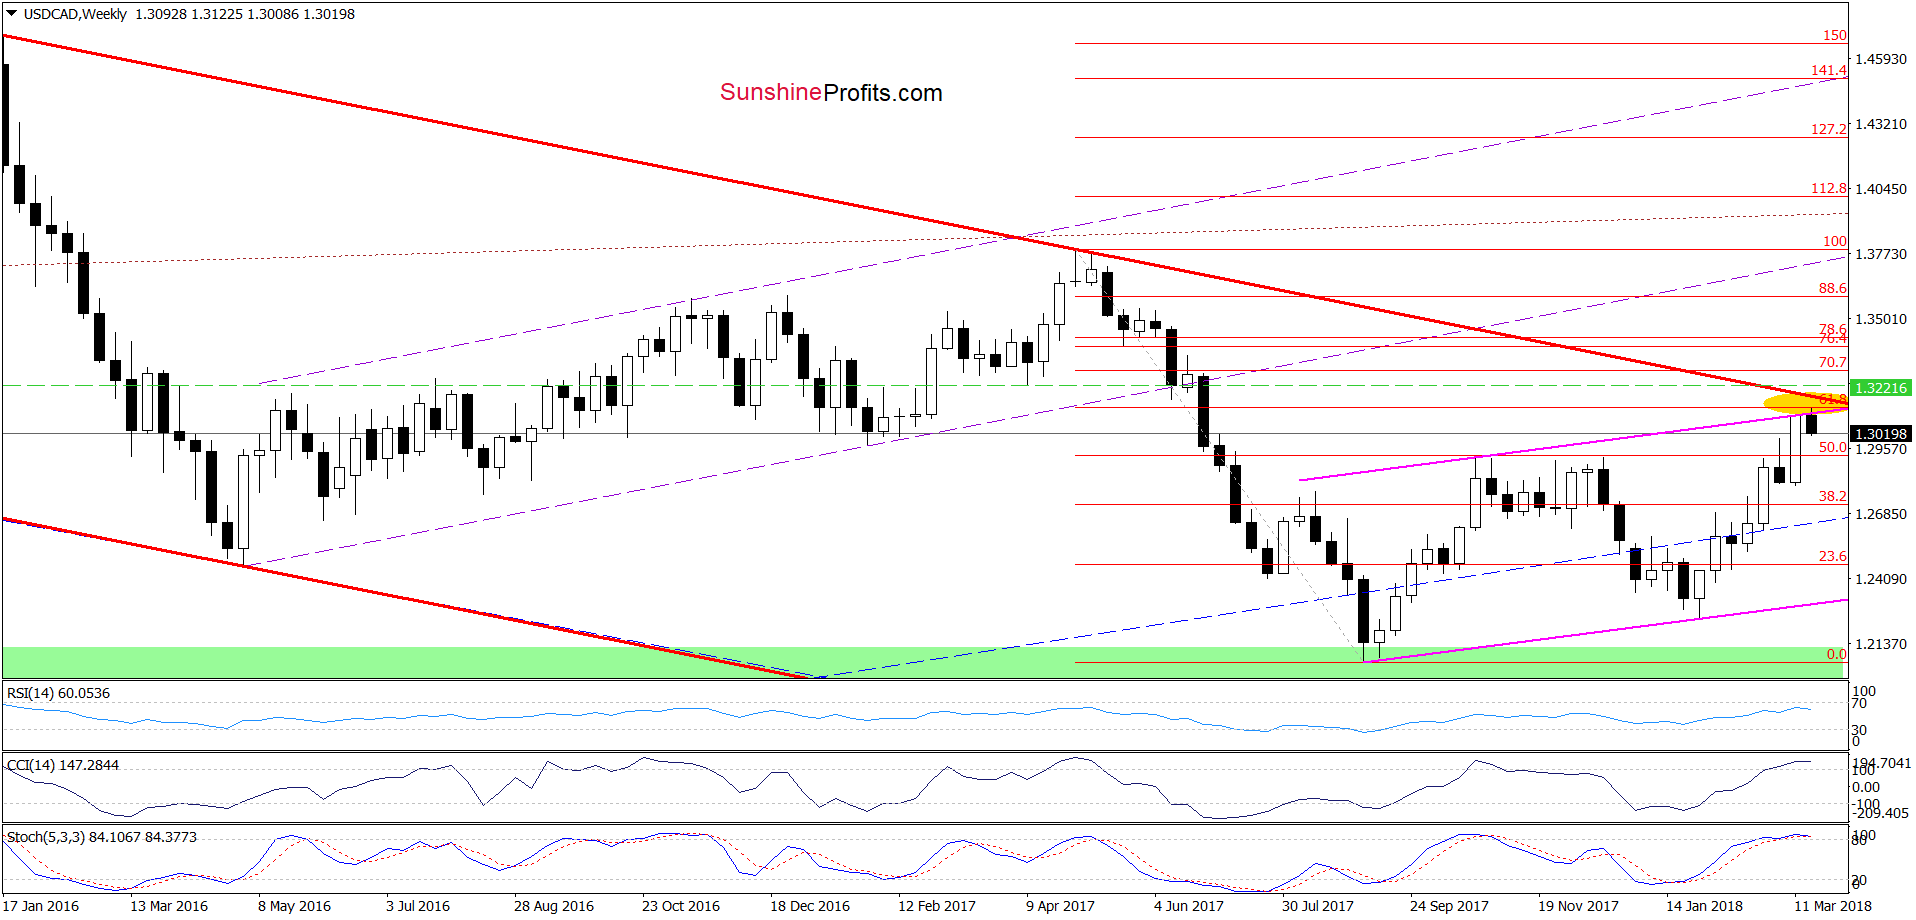
(…) USD/CAD not only reached (…) the upper border of the long-term red declining trend channel and the upper line of the pink rising trend channel, which in combination with the current position of the weekly indicators significantly increase the probability of reversal in the very near future.
From today’s point of view, we see that the situation developed in line with the above scenario and USD/CAD extended losses in the following days, making our short positions profitable.
How did this drop affect the very short-term picture of the exchange rate?
Before we analyze the recent price action, let’s recall the quote from our Monday’s alert:
(…) USD/CAD extended gains in the previous week, which resulted in a climb to the 127.2% Fibonacci extension. Thanks to this move the pair also approached the 61.8% Fibonacci (seen more clearly on the weekly chart (…), which together with the current position of the daily indicators suggest that reversal is just around the corner.
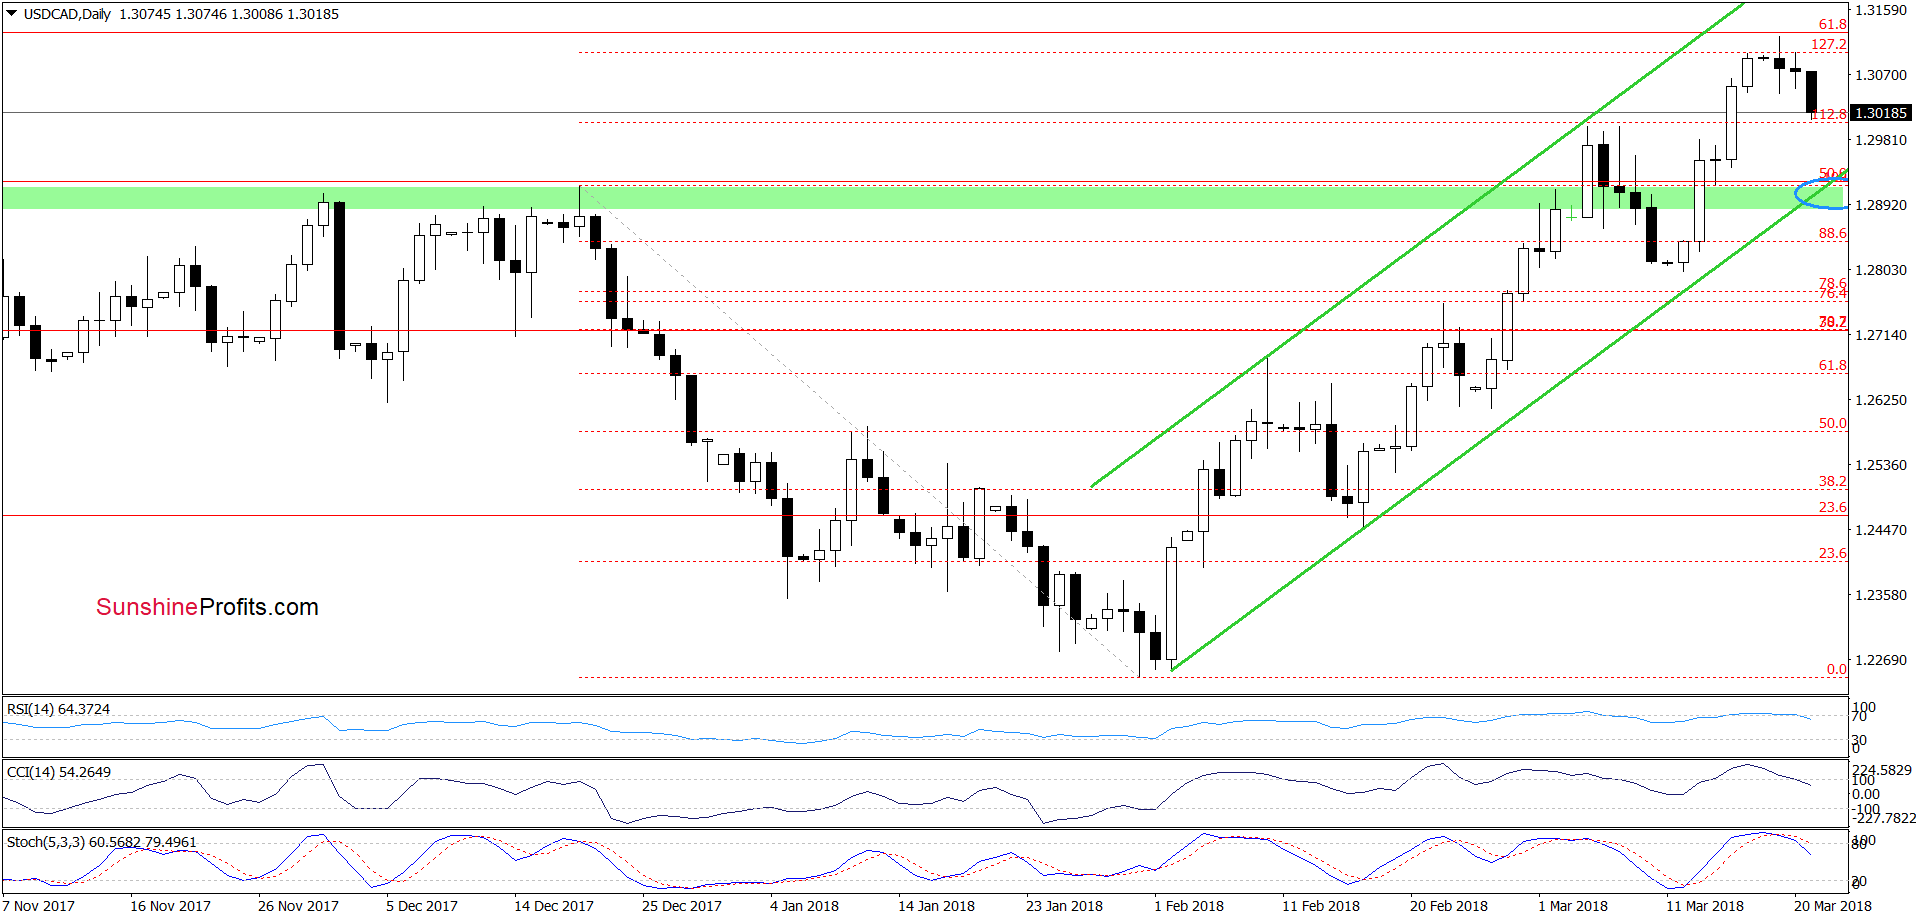
Looking at the daily chart, we see that thanks to this week decline, the pair invalidated the earlier tiny breakout above the 127.2% Fibonacci extension, which in combination with the sell signals generated by the daily indicators gave currency bears important reasons to act. Today, the exchange rate extended losses, which means that we’ll see a realization of the pro-bearish scenario from our last commentary in the near future:
(…) How low could USD/CAD go?
In our opinion, the initial downside target will be the lower border of the green rising trend channel marked on the daily chart (currently around 1.2875). However, if this support is broken, we’ll likely see a test of the March lows (around 1.2800-1.2813) in the following days.
Trading position (short-term; our opinion): Short positions (with a stop-loss order at 1.3221 and the initial downside target at 1.2918 are justified from the risk/reward perspective now. We will keep you informed should anything change, or should we see a confirmation/invalidation of the above.
USD/CHF
Quoting our last commentary on this currency pair:
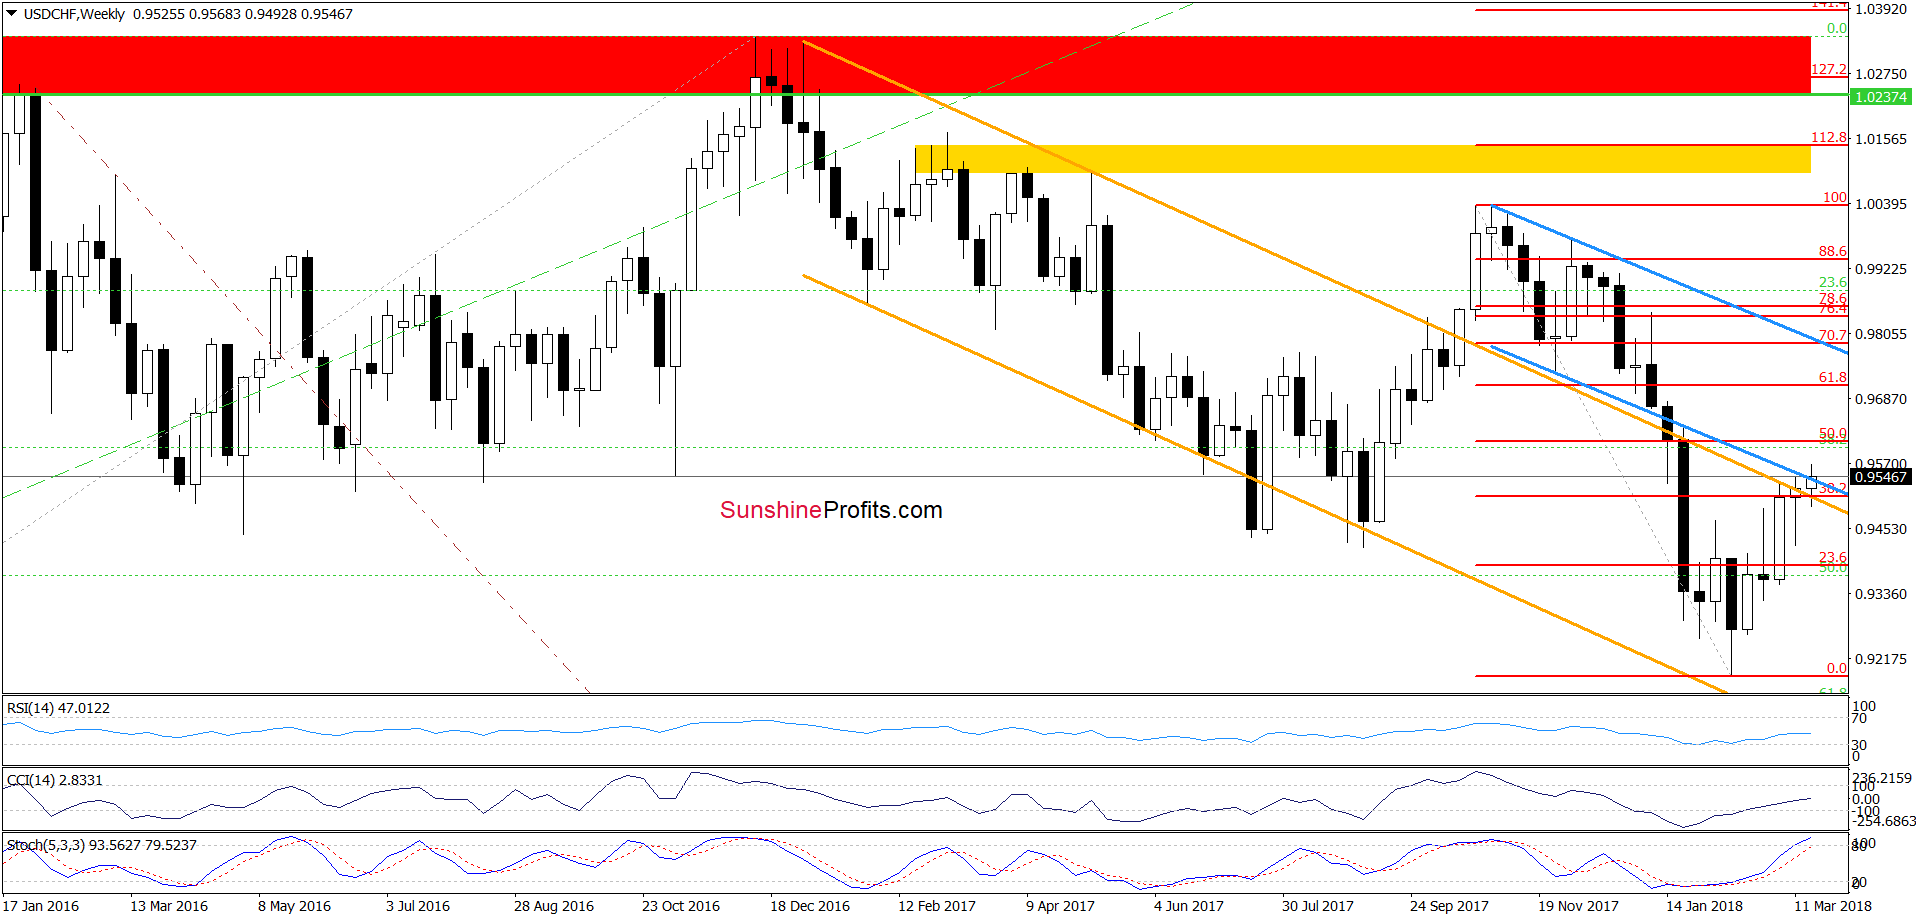
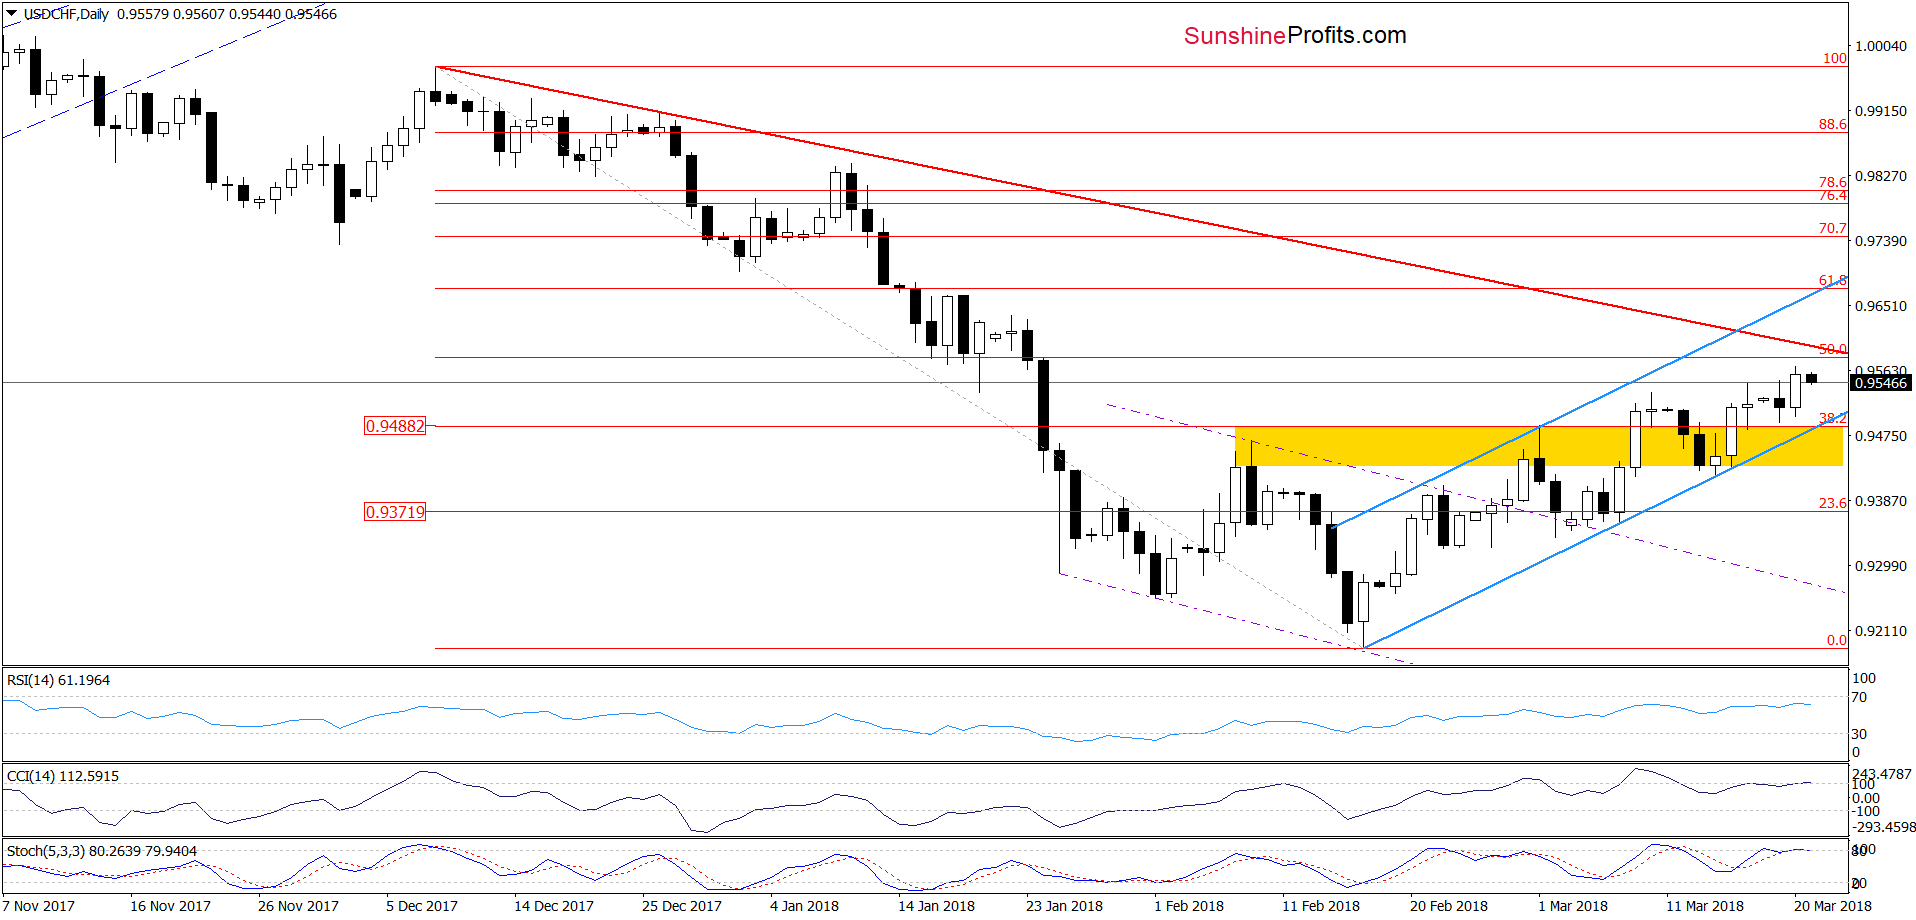
(…) Will we see further improvement in the coming days? Looking at the daily chart, we see that although indicators increased to their overbought areas there are no sell signals at the moment of writing these words, which could encourage currency bears to act.
Nevertheless, in our opinion, even if the exchange rate moves higher from here, the space for gains seems limited as the 50% Fibonacci retracement and the medium-term red declining dashed resistance line are quite close.
As you see on the daily chart, currency bulls triggered one more upswing yesterday, which took USD/CHF to a fresh March high. Despite this improvement, the above-mentioned resistances together with the previously-broken lower line of the blue declining trend channel continue to block the way to the north.
Additionally, daily indicators are very close to generating the sell signals, which increases the probability that the next move will be to the downside. If this is the case, currency bears will re-test the strength of the lower border of the blue rising trend channel in the very near future.
Trading position (short-term; our opinion): No positions are justified from the risk/reward perspective. We will keep you informed should anything change, or should we see a confirmation/invalidation of the above.
Thank you.
Nadia Simmons
Forex & Oil Trading Strategist
Przemyslaw Radomski, CFA
Founder, Editor-in-chief, Gold & Silver Fund Manager
Gold & Silver Trading Alerts
Forex Trading Alerts
Oil Investment Updates
Oil Trading Alerts

