

The small steps method doesn’t disappoint currency bulls. First, they broke above the short-term resistance line, then we saw the breakout above the mid-February high. Will their good streak continue or maybe their opponents are lurking just around the corner?
In our opinion the following forex trading positions are justified - summary:
- EUR/USD: none
- GBP/USD: none
- USD/JPY: none
- USD/CAD: short (a stop-loss order at 1.3221; the next downside target at 1.2790)
- USD/CHF: none
- AUD/USD: none
EUR/USD
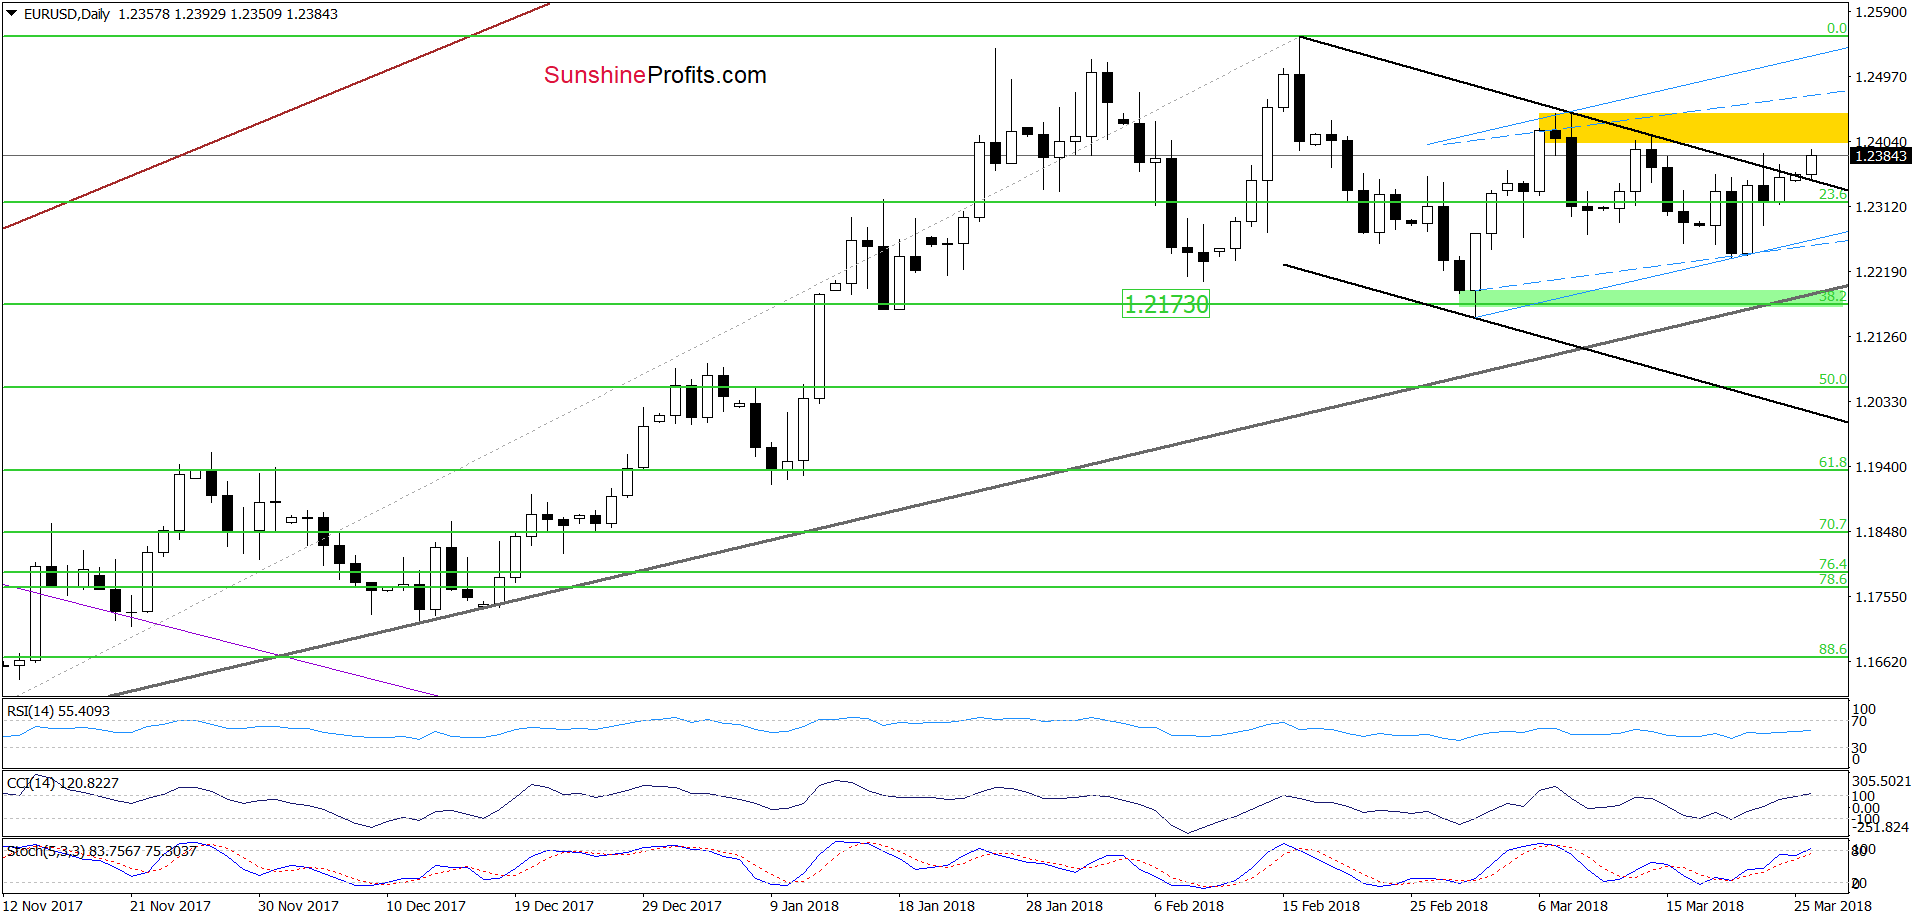
The first thing that caches the eye on the daily chart is the breakout above the black declining resistance line, which suggests a test of the yellow resistance zone (created by the previous highs) in the very near future.
At this point, it is worth noting that although the current position of the daily indicators suggests that the space for gains is limited (as the CCI and the Stochastic Oscillator climbed to their overbought areas) , we think that as long as there are no sell signals, further improvement and a test of the next resistances can’t be ruled out.
How high could the pair go if currency bulls don’t fail?
In our opinion, the first upside target will be around 1.2468, where the upper border of the blue rising trend channel based on the daily openings and closures (marked with dashed lines) currently is.
Nevertheless, if the pair breaks above this resistance, we can see a test of the major resistance zone (created by the January and February peaks and the 38.2% Fibonacci retracement), which is currently intersected and reinforced by the upper border of the blue rising trend channel based on an intraday highs and lows (around 1.2525).
Finishing today’s commentary on this currency pair, please keep in mind that this pro-bullish scenario corresponds to the bearish scenario in the case of the USD Index about which we wrote on Thursday. Therefore, if you haven’t had the chance to read that Forex Trading Alert, we encourage you to do so today - it’s up-to-date:
Blaming the Fed for Weaker Greenback
Trading position (short-term; our opinion): no positions are justified from the risk/reward perspective now. We will keep you informed should anything change, or should we see a confirmation/invalidation of the above.
GBP/USD
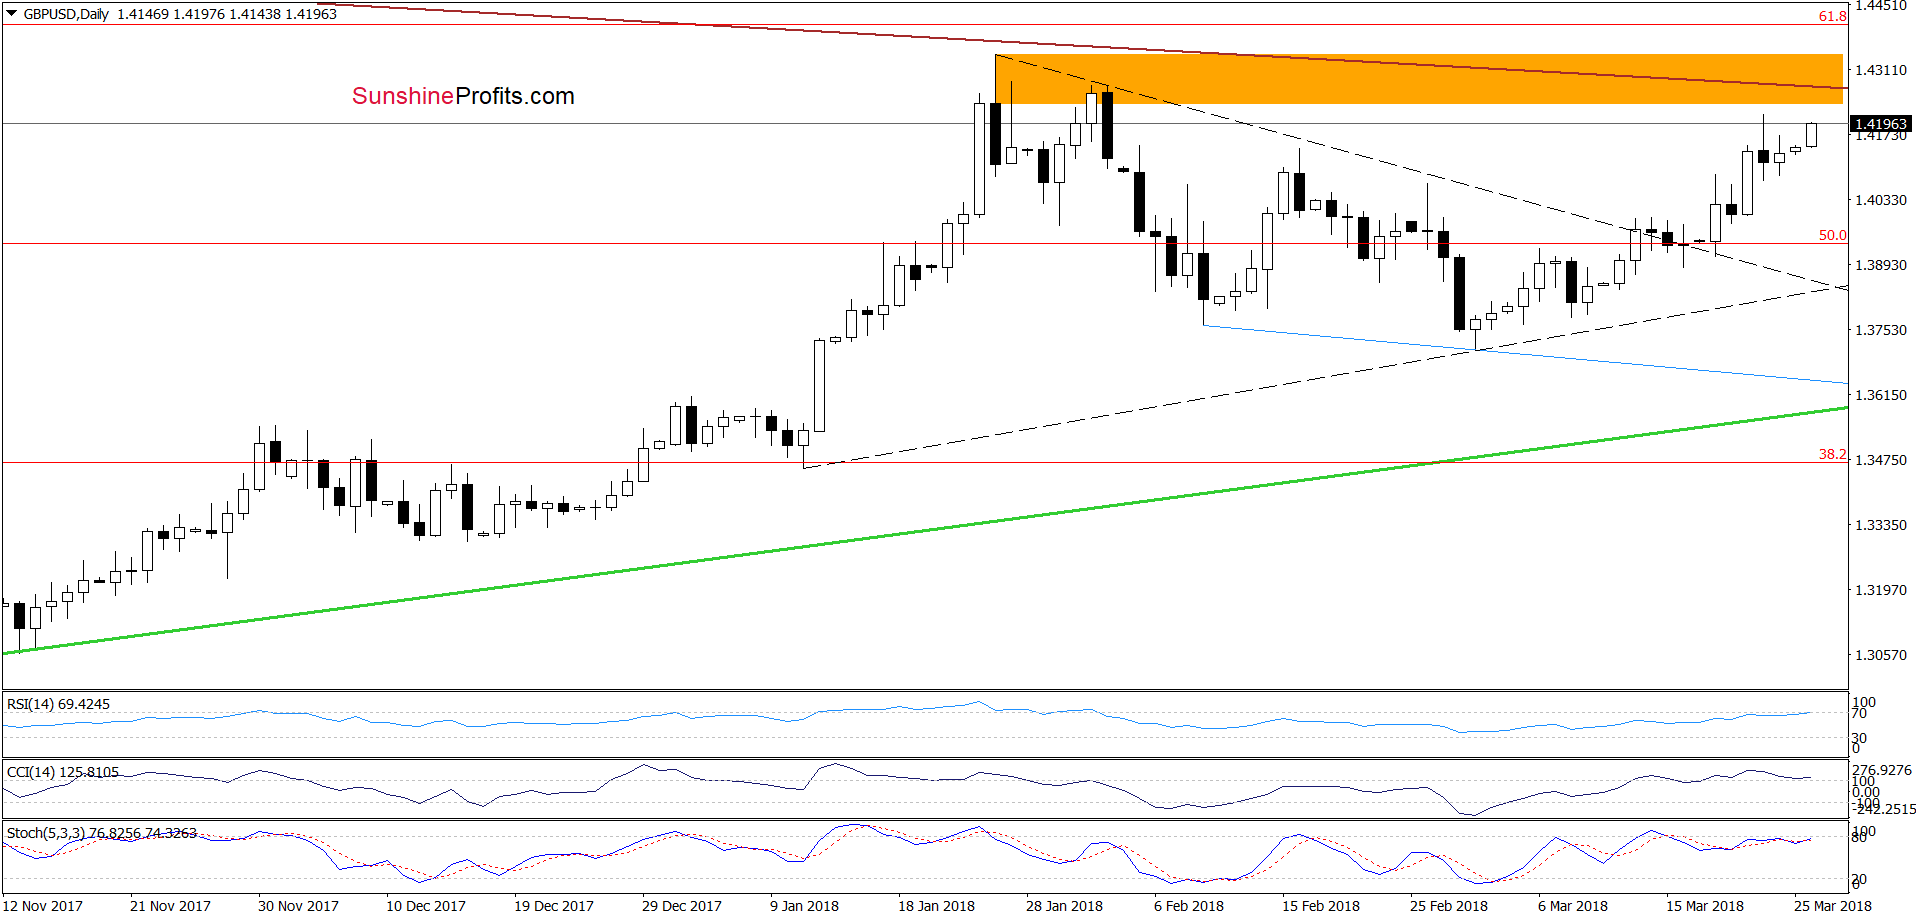
Looking at the daily chart we see that the breakout above the black declining dashed resistance line encouraged currency bulls to act, which resulted in a climb above the mid-February high. Taking this positive event into account and the lack of the sell signals generated by the indicators, it seems that GBP/USD will test the orange resistance zone and the brown declining resistance line (based on the mid-June and August 2015 highs) in the very near future.
But will we see a breakout above this major resistance area?
In our opinion, such bullish scenario is quite doubtful. Why? First, all indicators climbed to their overbought areas, which means that generating sales signals is just a matter of time (not a very long time). Second, the above-mentioned orange area is reinforced not only by the 61.8% Fibonacci retracement seen on the daily chart, but also by the combination of several resistances marked on the weekly chart below (with the red ellipse).
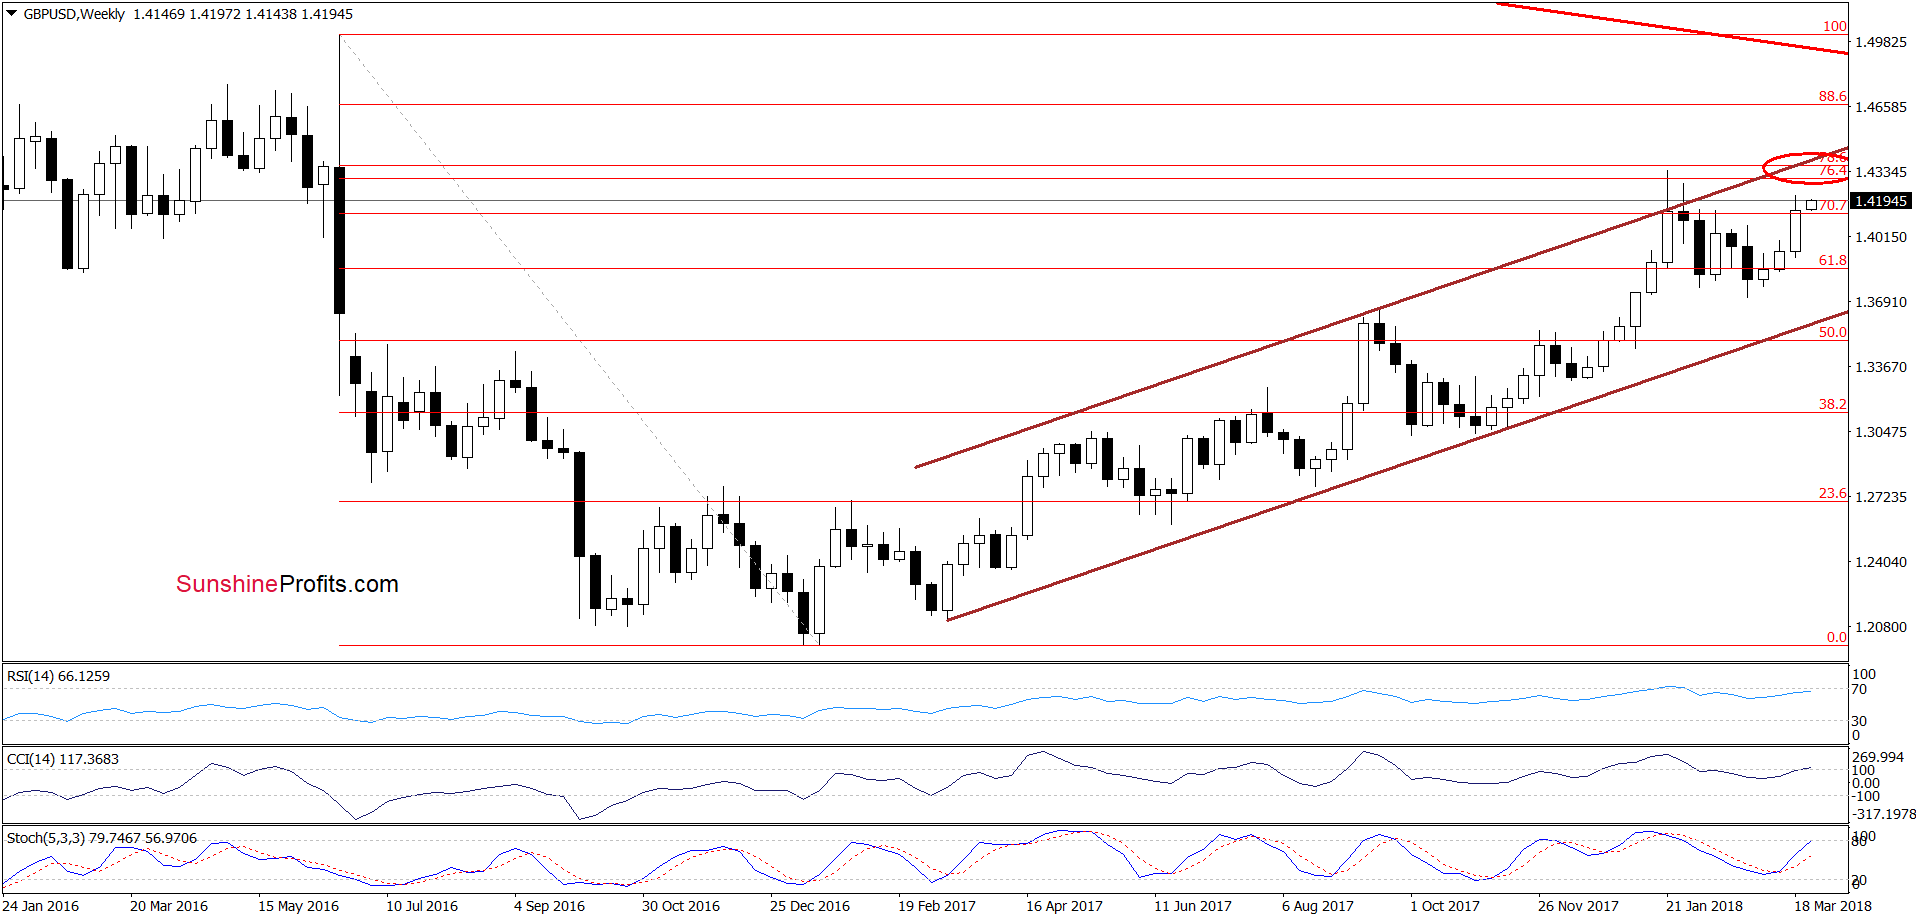
From this perspective, we see that even if currency bulls move higher, not far from current levels, we can see the 76.4% and 78.6% Fibonacci retracements, which were strong enough to stop currency bulls at the end of January. Additionally, they are currently intersected and reinforced by the upper border of the brown rising trend channel, which increases the probability of reversal in the coming week.
Connecting the dots, if the situation develops in tune with our assumptions and GBP/USD climbs to this major resistance area, we’ll consider opening short positions.
Trading position (short-term; our opinion): no positions are justified from the risk/reward perspective now. We will keep you informed should anything change, or should we see a confirmation/invalidation of the above.
AUD/USD
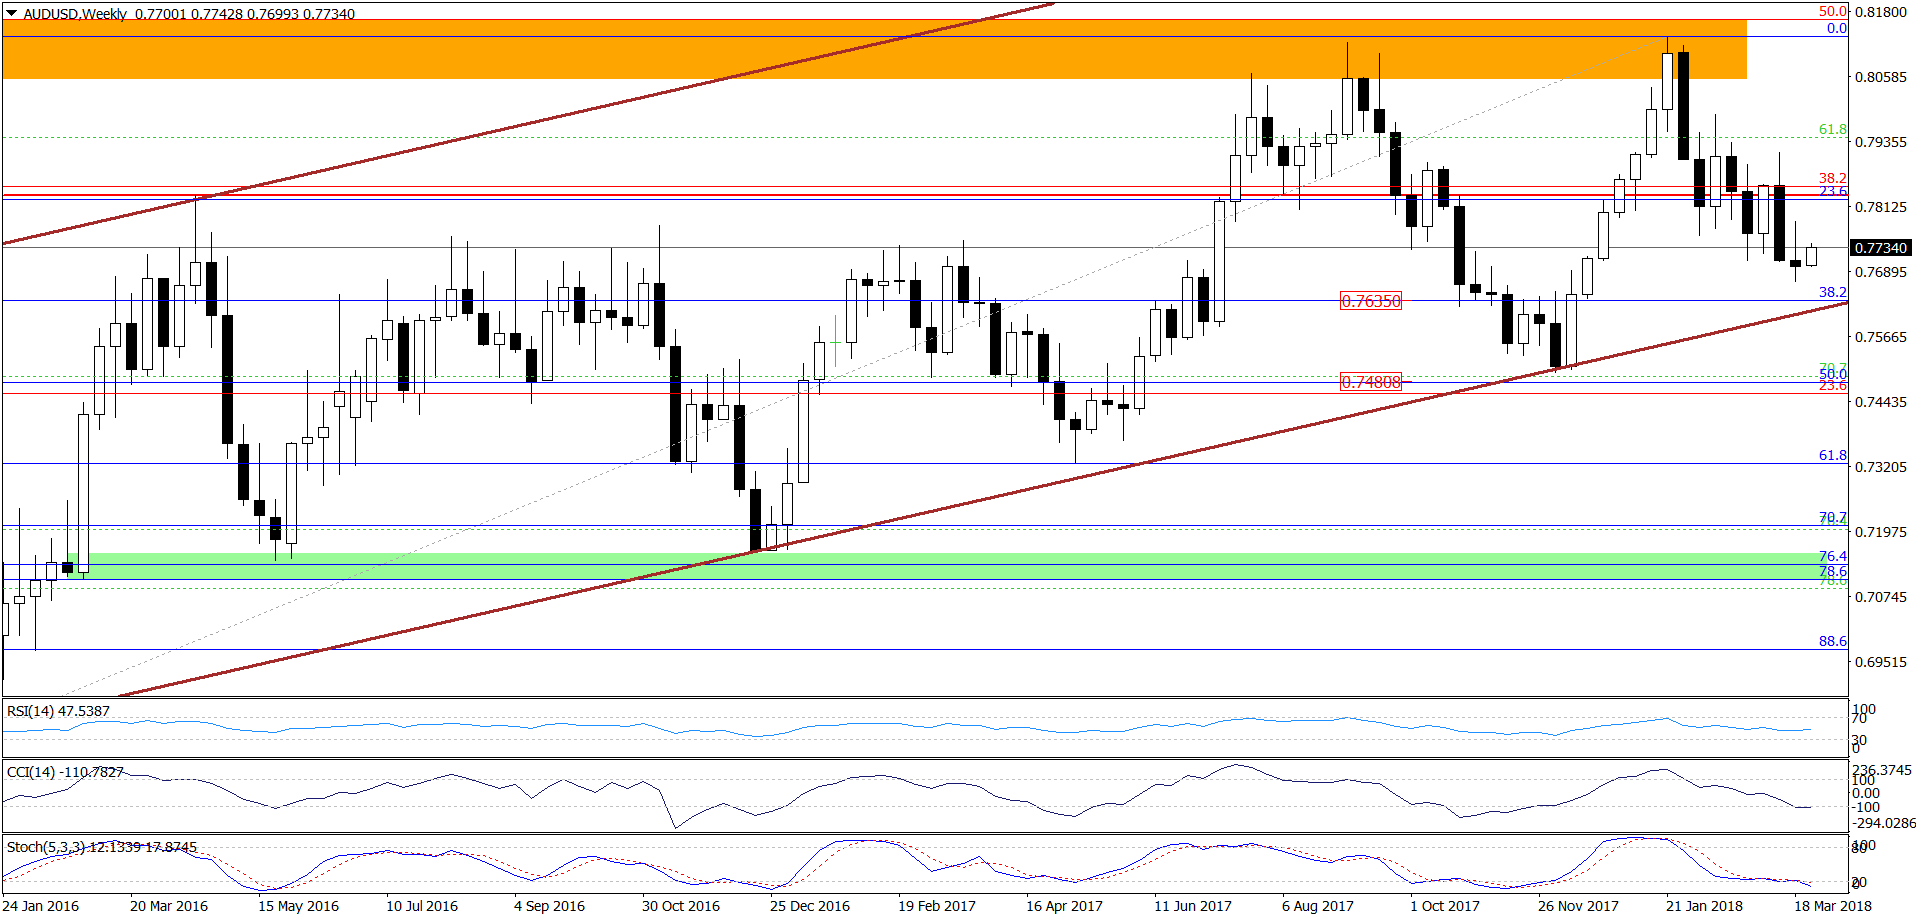
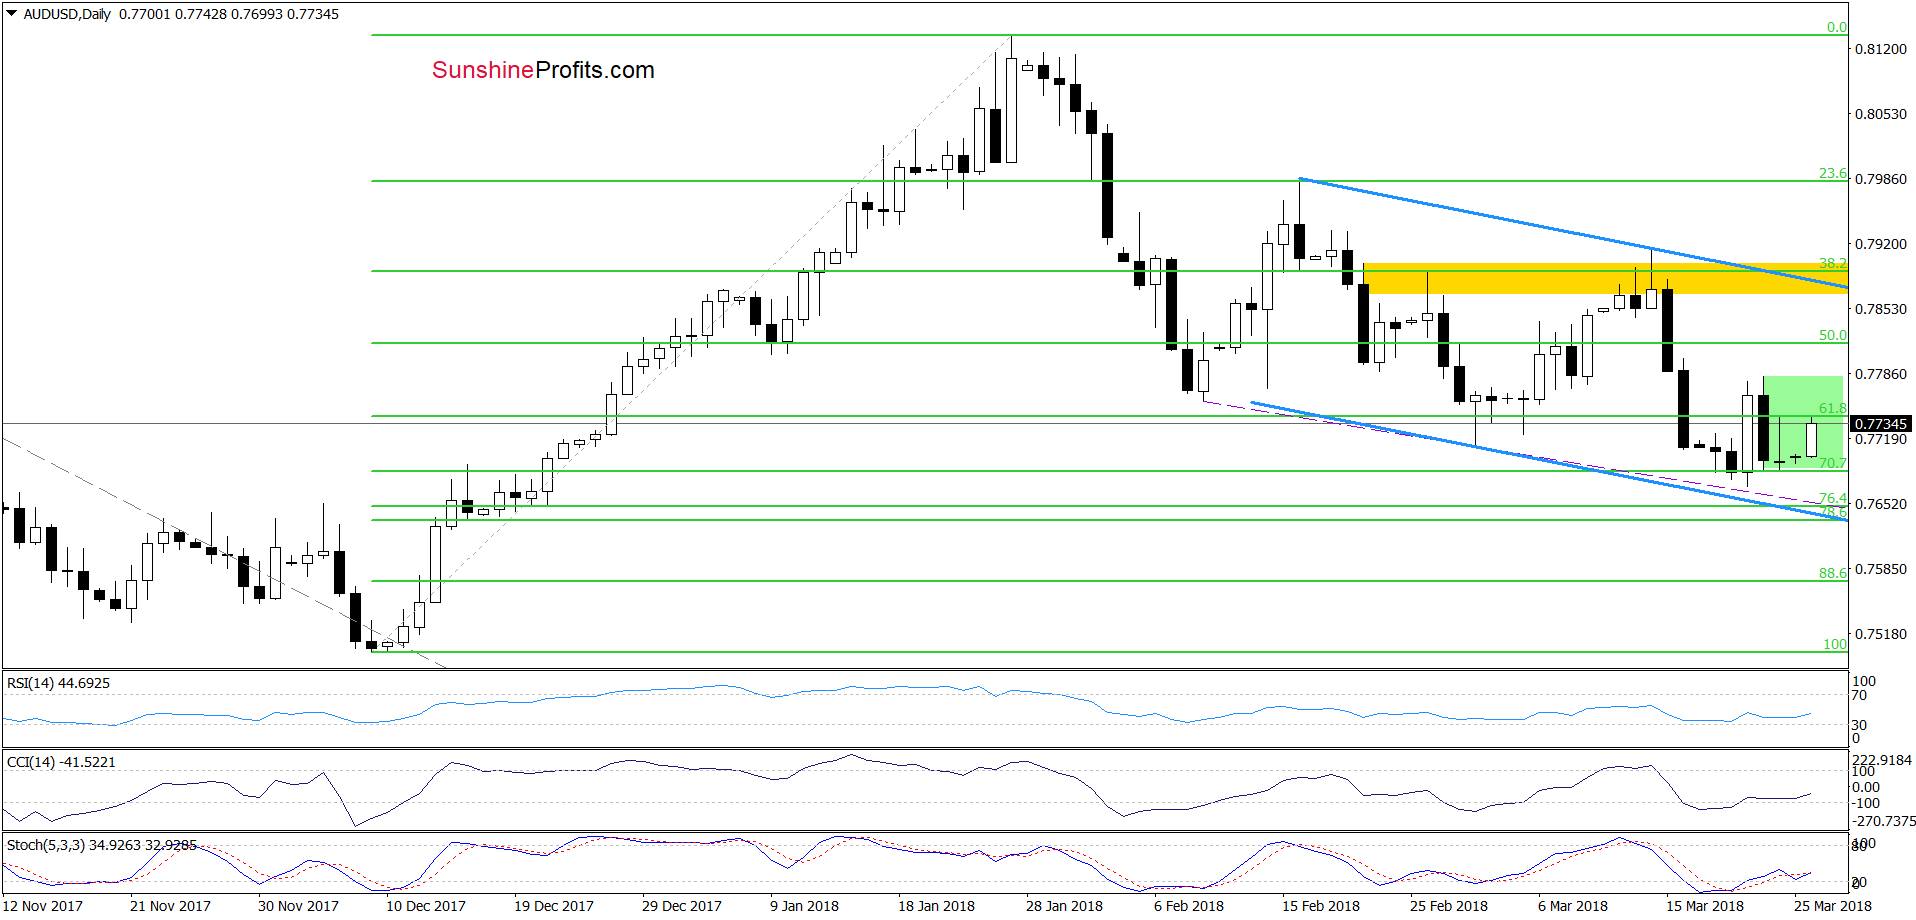
From today’s point of view, we see that the overall situation hasn’t changed much as AUD/USD remains in the green consolidation inside the blue declining trend channel. Although the buy signals generated by the daily indicators remain in the cards, we think that as long as there is no breakout above the upper line of the formation a reversal and a re-test of the last low (or even the support area created by the 76.4%, 78.6% Fibonacci retracements and the lower line of the blue trend channel) should not surprise us.
Trading position (short-term; our opinion): No positions are justified from the risk/reward perspective. We will keep you informed should anything change, or should we see a confirmation/invalidation of the above.
Thank you.
Nadia Simmons
Forex & Oil Trading Strategist
Przemyslaw Radomski, CFA
Founder, Editor-in-chief, Gold & Silver Fund Manager
Gold & Silver Trading Alerts
Forex Trading Alerts
Oil Investment Updates
Oil Trading Alerts

