

In recent days, the U.S. dollar extended losses against its Canadian counterpart, which took USD/CAD to a fresh 208 low. At the same time, the pair reached our first downside target, but is it enough for currency bears?
In our opinion the following forex trading positions are justified - summary:
- EUR/USD: none
- GBP/USD: none
- USD/JPY: none
- USD/CAD: none
- USD/CHF: none
- AUD/USD: short (a stop-loss order at 0.8137; the initial downside target at 0.7730)
EUR/USD
Yesterday, we wrote the following:
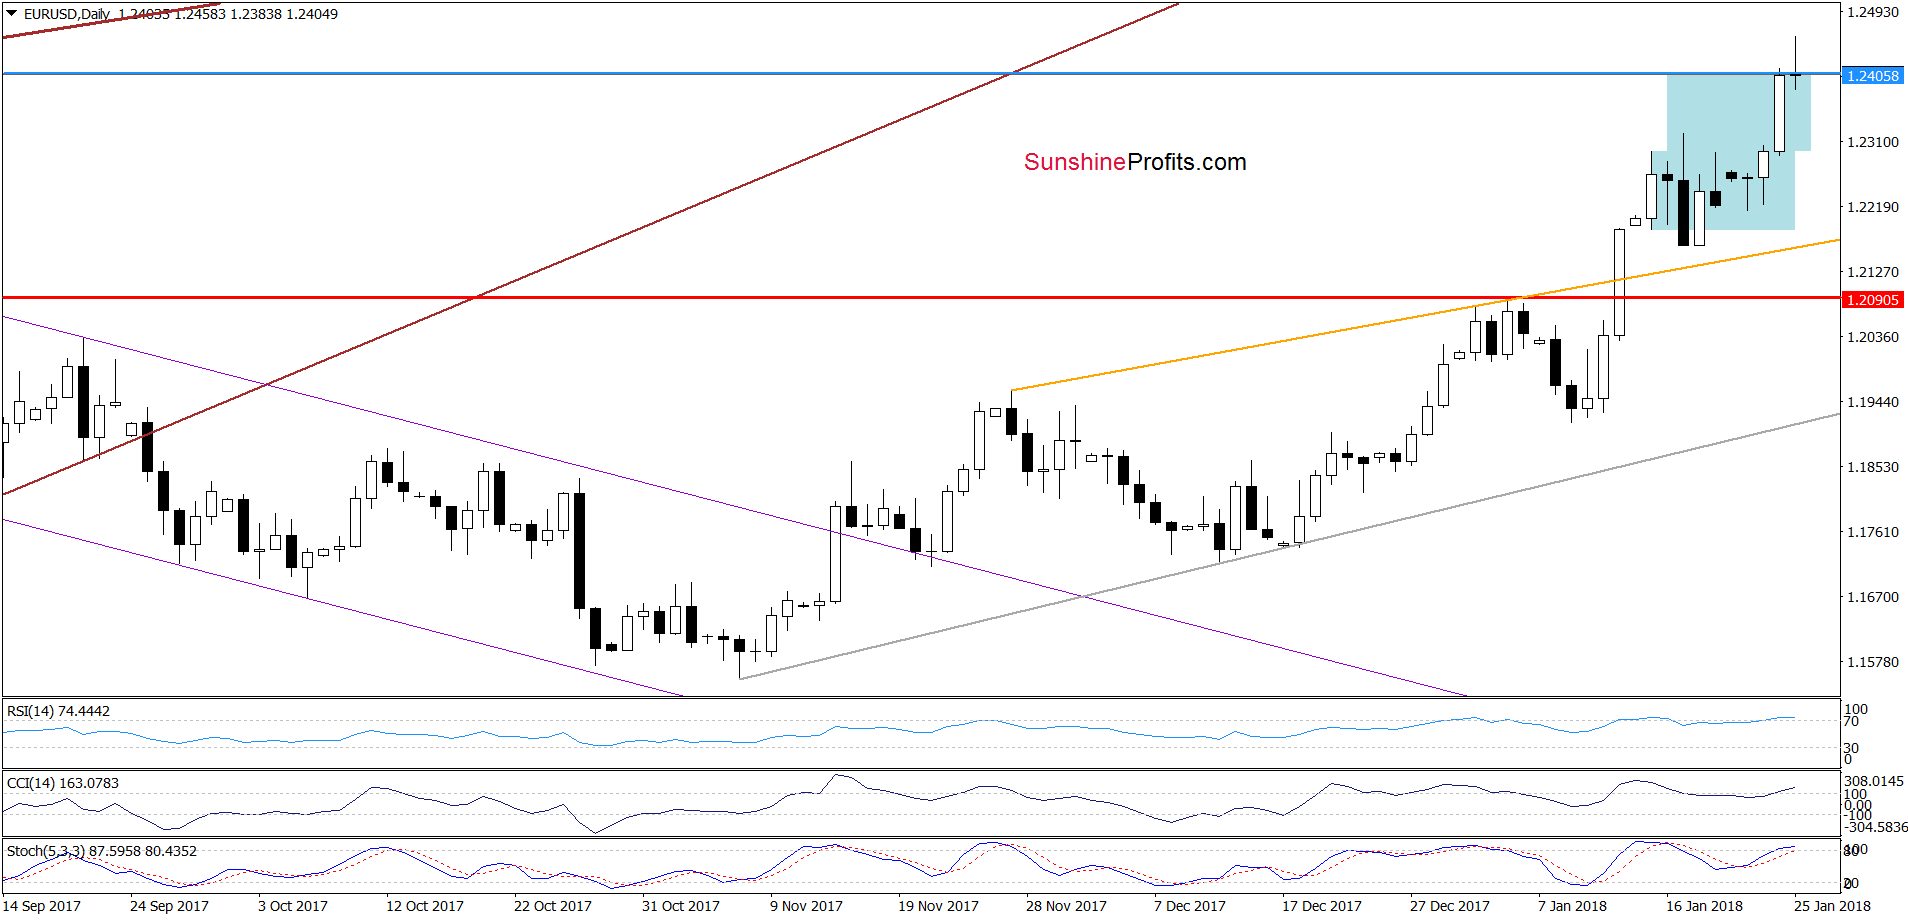
(…) please note that the Stochastic Oscillator generated a buy signal, which suggests further improvement and a climb to at least 1.2405, where the size of the upswing will correspond to the height of the blue consolidation.
From today’s point of view, we see that the situation developed in line with the above scenario and EUR/USD reached our upside target after the alert was posted. Earlier today, currency bulls tried to push the pair higher, which suggests that we may see a realization of the bullish scenario posted in our previous commentary on this currency pair:
(…) What could happen if currency bulls manage to push the exchange rate above this area? We think that the best answer to this question will be the quote from our Thursday alert:
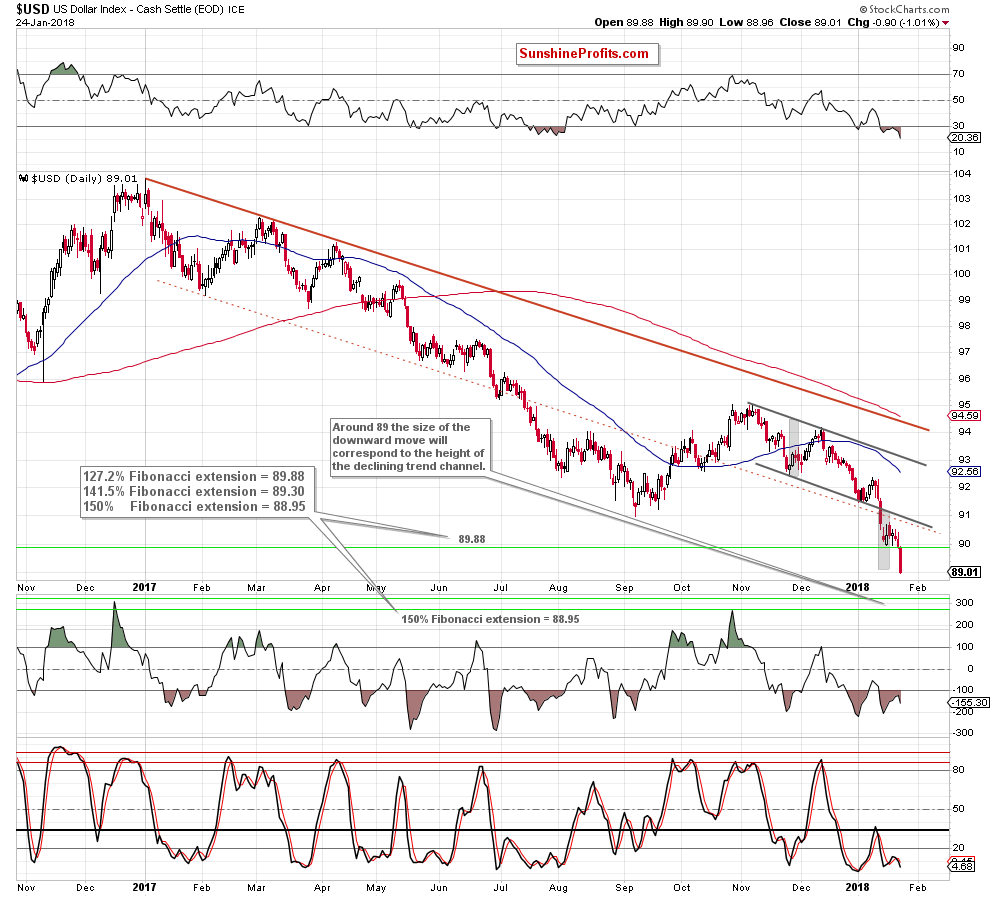
(…) we see that potential bulls’ failure could trigger one more downward move and a drop to around 89, where the size of the downward move will correspond to the height of the declining trend channel.
What could happen at the same time with EUR/USD?
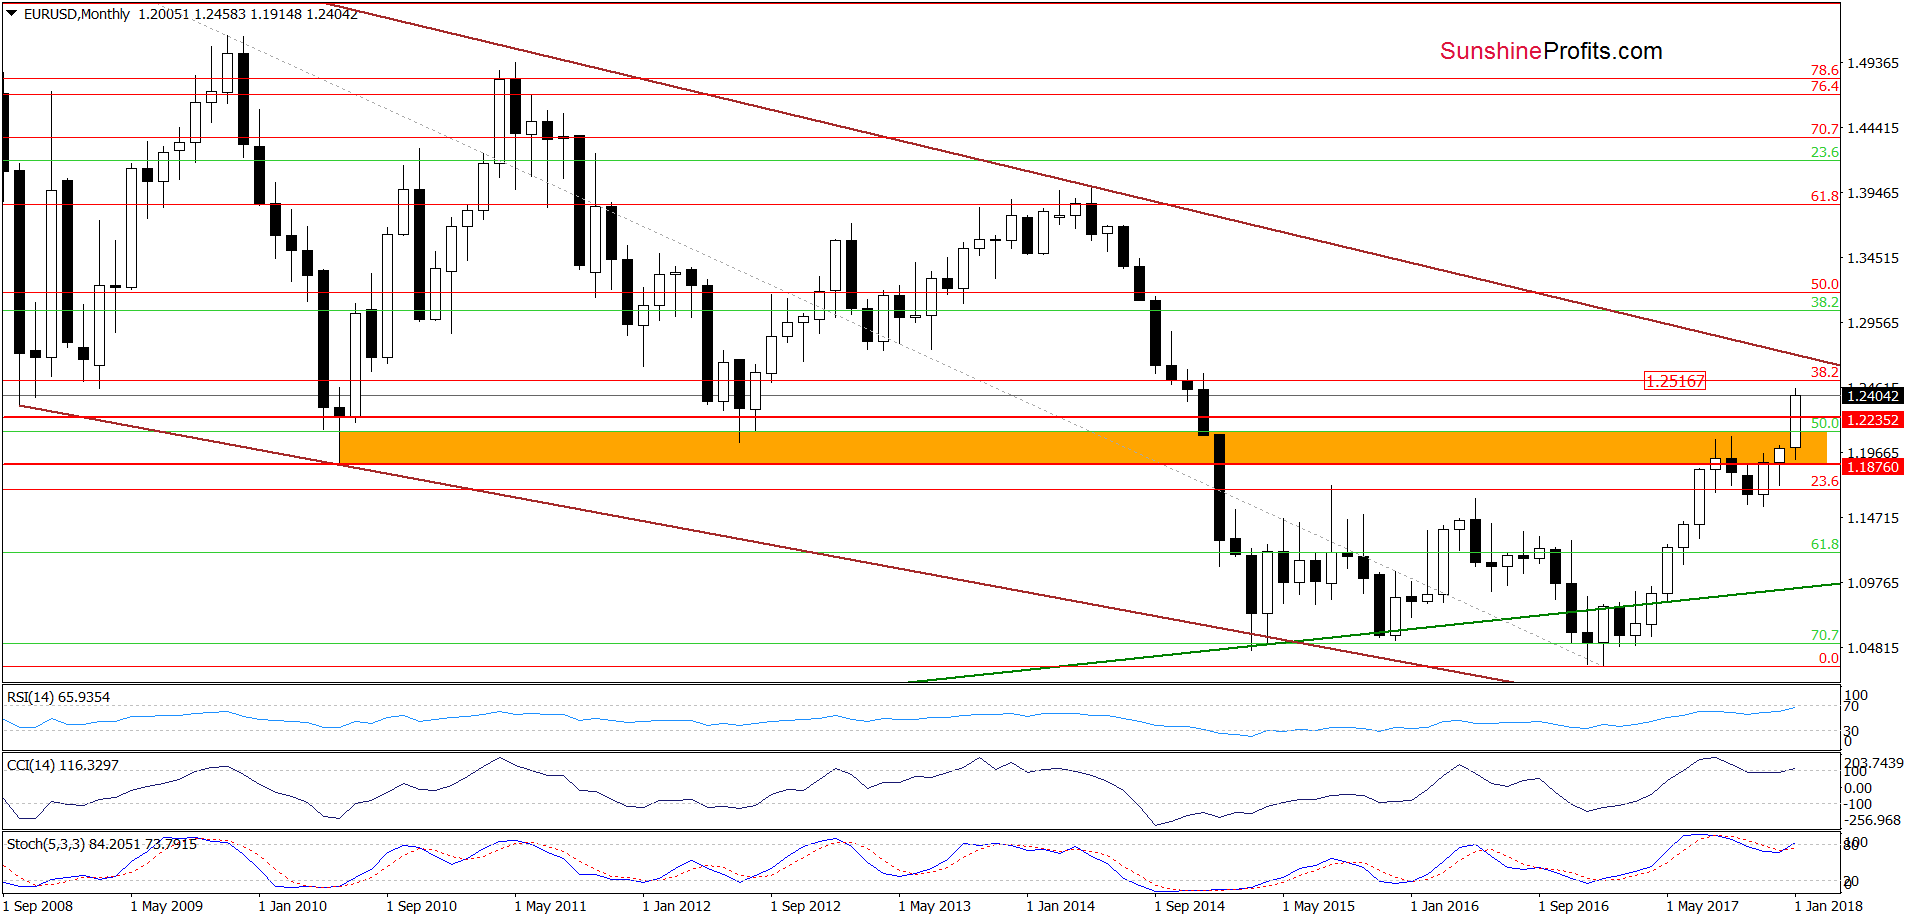
We think that such decline in the greenback could push the exchange rate to the 38.2% Fibonacci retracement based on the entire 2008-2017 downward move. Nevertheless, this is just a potential scenario and we will continue to monitor the market very closely in the coming days.
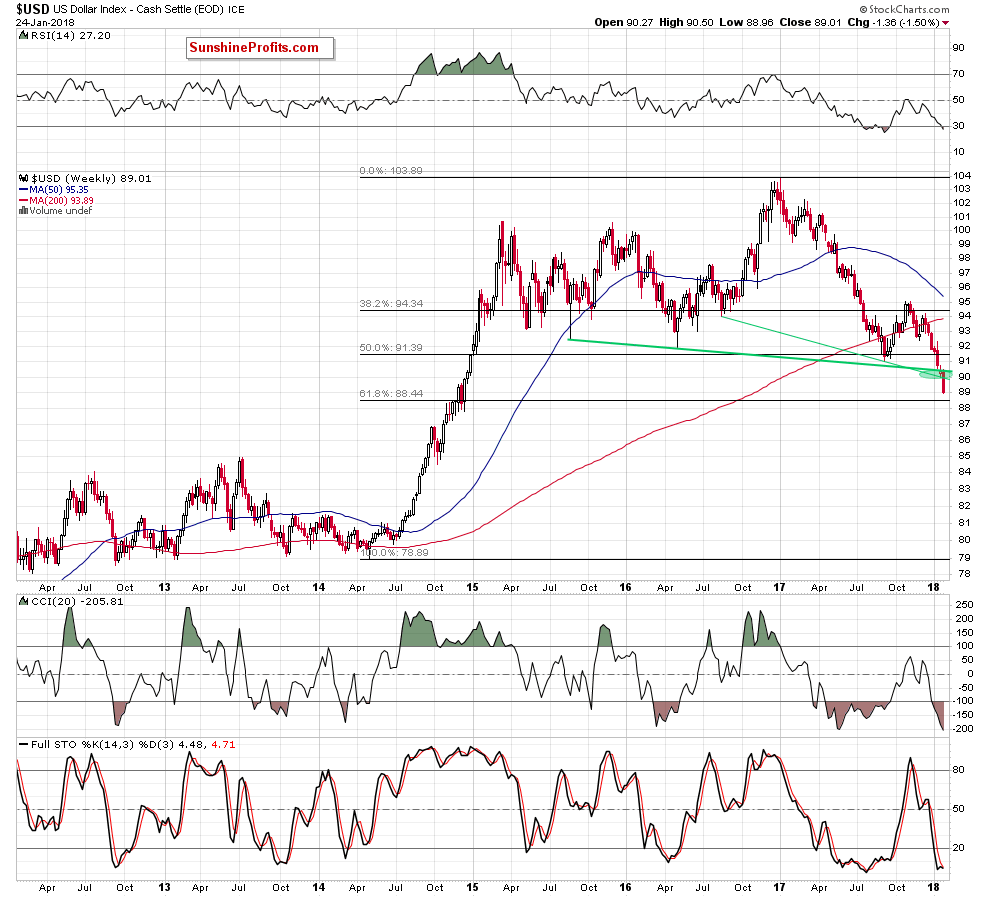
(…) if the support area around 89 doesn’t stop declines in the USD Index, the next downside target for the bears will be likely the 61.8% Fibonacci retracement (around 88.44) based on the entire 2014-2017 upward move).
Trading position (short-term; our opinion): No positions are justified from the risk/reward perspective. We will keep you informed should anything change, or should we see a confirmation/invalidation of the above.
USD/JPY
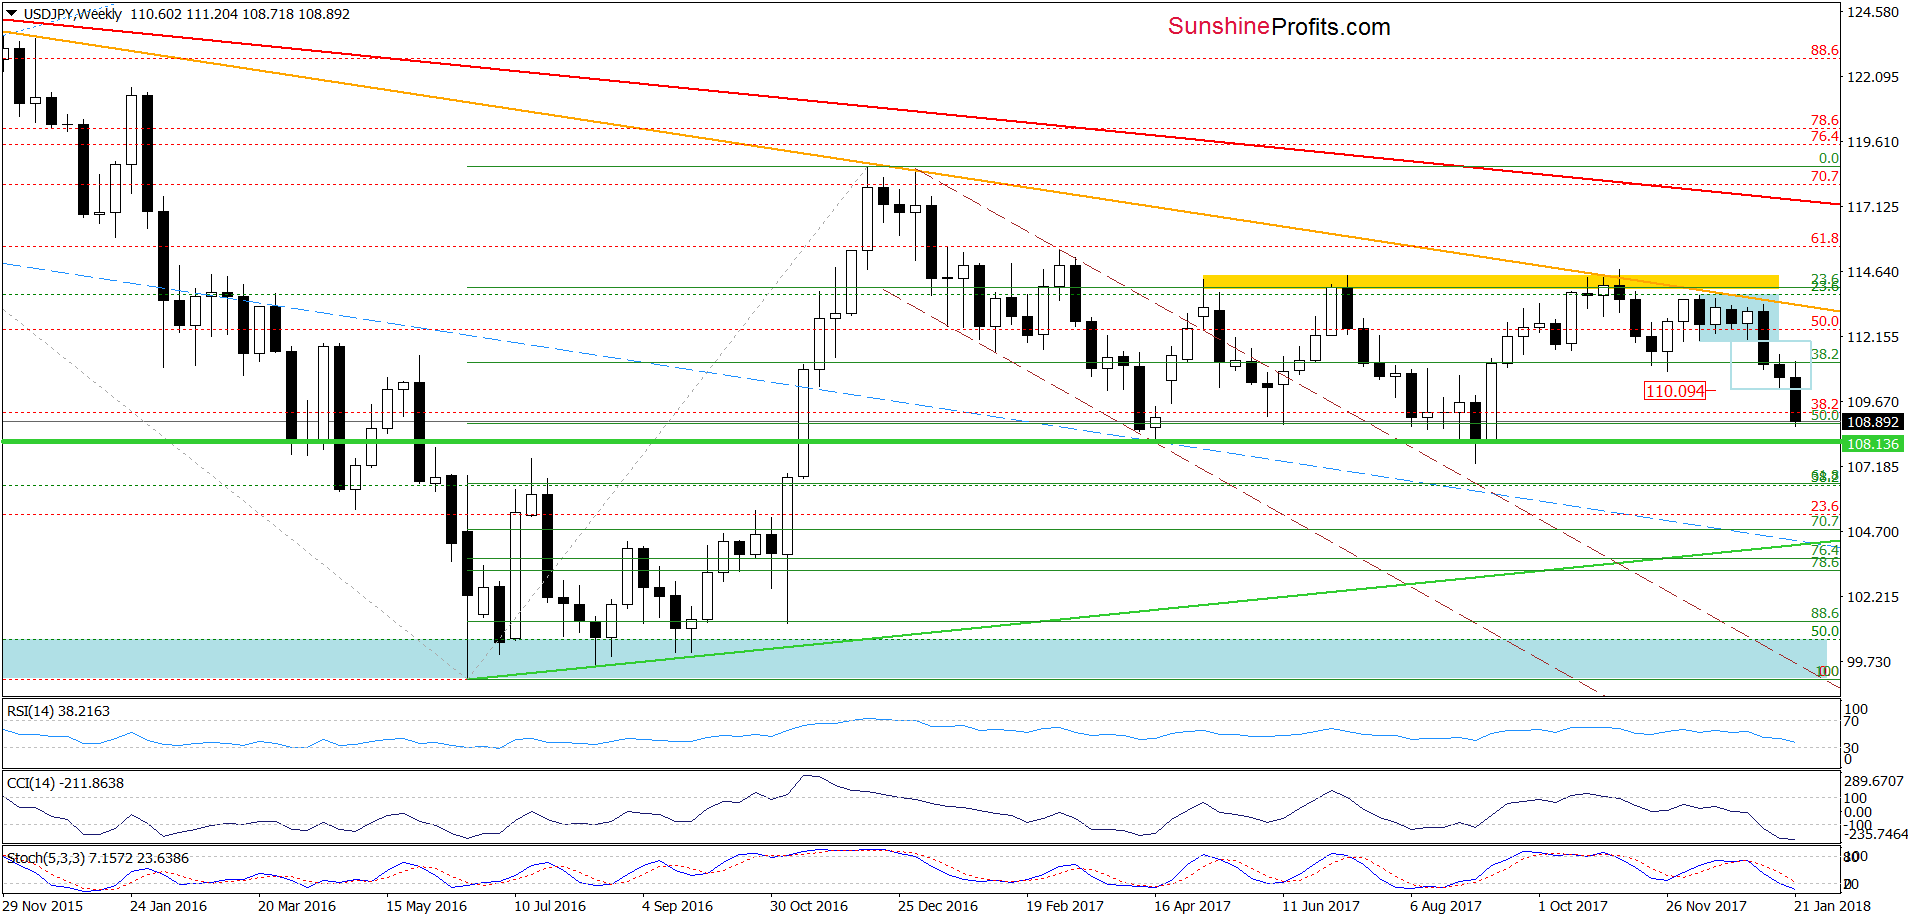
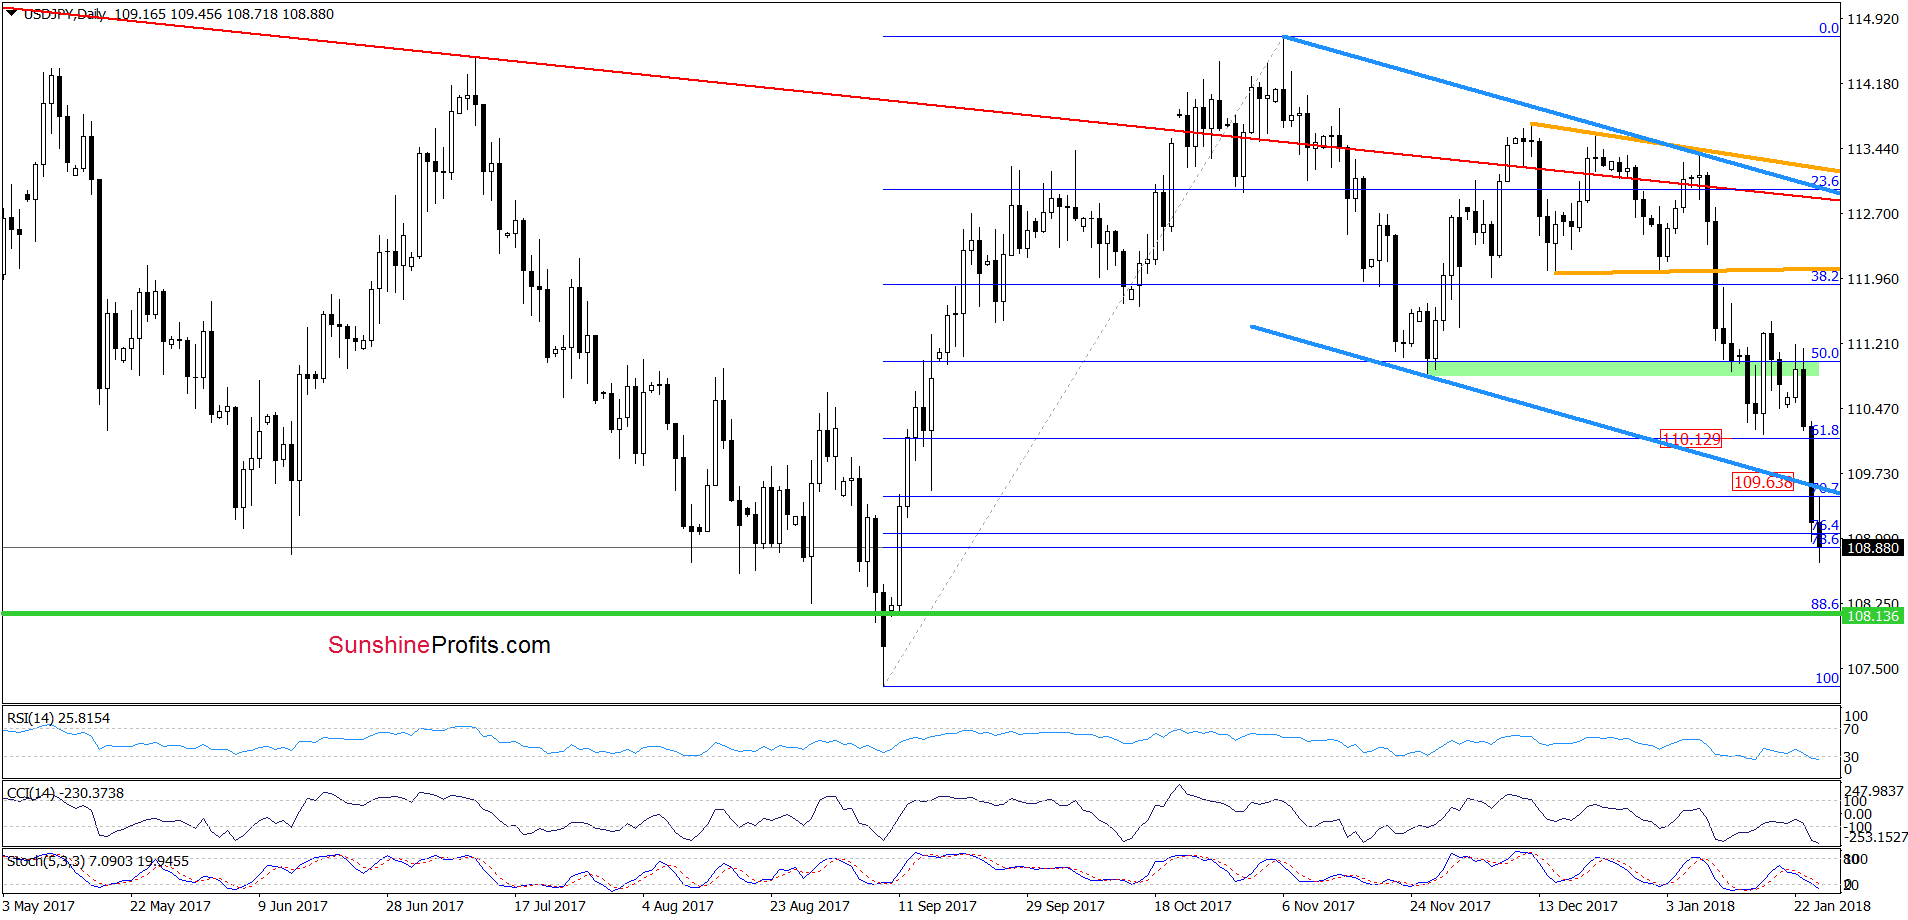
Quoting our last commentary on USD/JPY:
(…) although USD/JPY invalidated the earlier breakdown under the green support zone (created by the November lows and the 50% Fibonacci retracement) in the previous week, currency bulls didn’t manage to push the pair higher. This show of weakness triggered another move to the downside, which suggests a test of the 61.8% Fibonacci retracement. However, if this support is broken, the next downside target for currency bears will be the lower border of the blue declining trend channel (currently around 109.64) in the coming days.
Looking at the above chart, we see that currency bears not only took the exchange rate to our downside targets, but also managed to push the pair below it, which suggests that we may see further deterioration and a test of the green horizontal line based on the mid-April and September 2017 lows in the coming days.
Trading position (short-term; our opinion): No positions are justified from the risk/reward perspective now. We will keep you informed should anything change, or should we see a confirmation/invalidation of the above.
USD/CAD
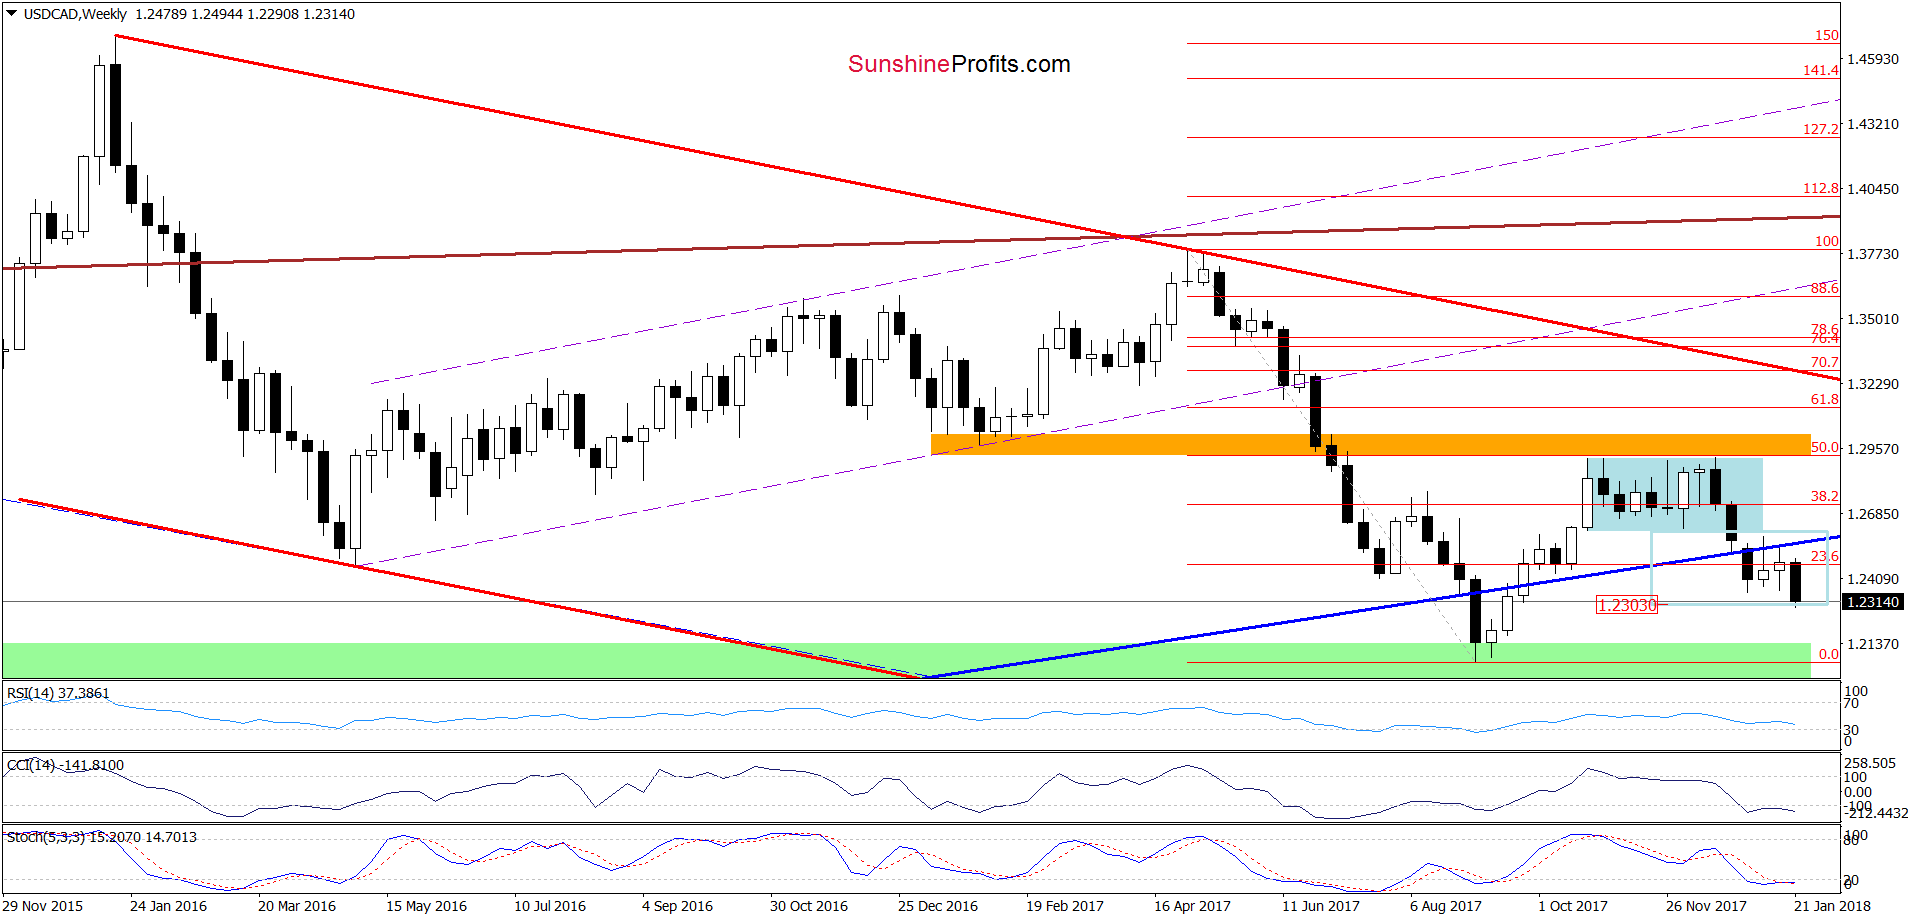
In our Forex Trading Alert posted on January 9, we wrote the following:
The first thing that catches the eye on the medium-term chart is a breakdown under the long-term blue support line. Although the pair rebounded slightly this week, the sell signals remain in the cards, which suggests that even if the pair extends gains from current levels, we’ll likely see one more downswing and a drop to around 1.2303, where the size of the downward move will correspond with the height of blue consolidation seen on the above chart.
As you see on the weekly chart, the situation developed in tune with our assumptions and USD/CAD slipped to our downside target. What’s next for the exchange rate? Taking into account the current position of the monthly indicators, it seems that reversal is just around the corner – especially when we factor in the fact that currency bears reached their downside target. Nevertheless, to have a more complete picture of the pair let’s take a look at the daily chart below.
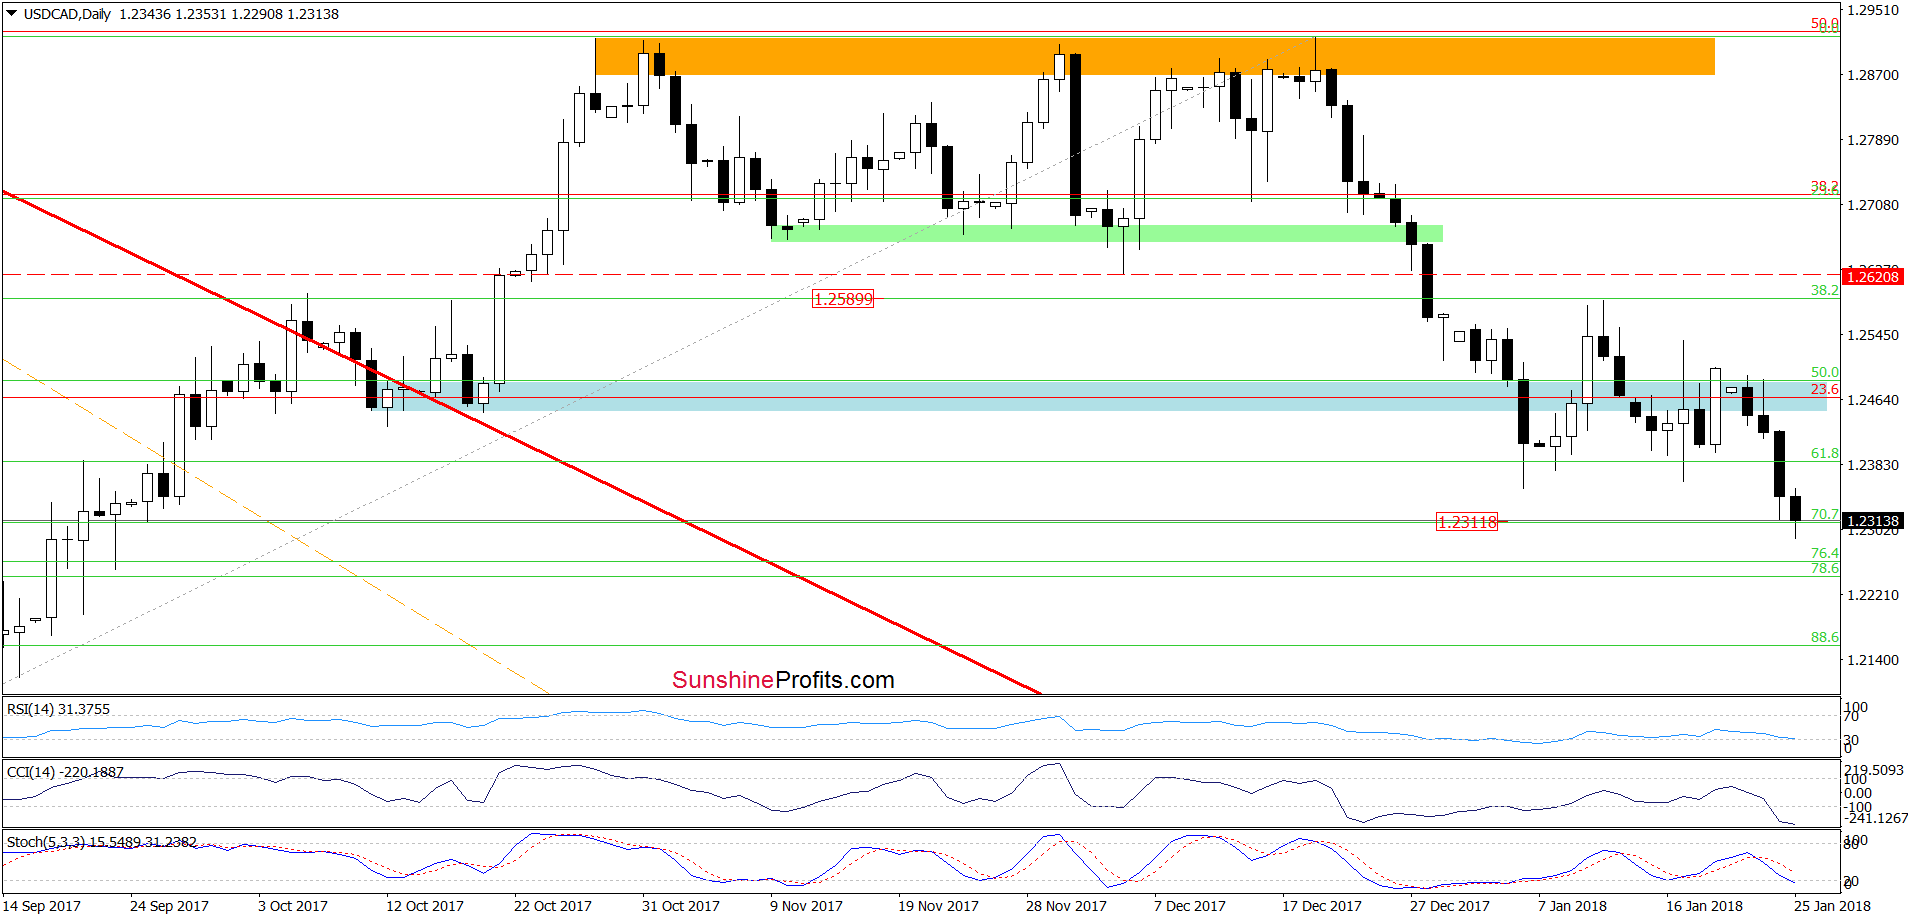
From this perspective, we see that currency bears came back not only below the 61.8% Fibonacci retracement, but also under the early January low, which doesn’t bode well for currency bulls. As we mentioned earlier, the pair slipped to its downside target, but considering the current position of the daily indicators (the Stochastic Oscillator re-generated the sell signal and here are no buy signals generated by the other indictors), we think that USD/CAD will test the support area created by the 76.4% and 78.6% Fibonacci retracements in the near future.
Trading position (short-term; our opinion): no positions are justified from the risk/reward perspective now. We will keep you informed should anything change, or should we see a confirmation/invalidation of the above.
Thank you.
Nadia Simmons
Forex & Oil Trading Strategist
Przemyslaw Radomski, CFA
Founder, Editor-in-chief, Gold & Silver Fund Manager
Gold & Silver Trading Alerts
Forex Trading Alerts
Oil Investment Updates
Oil Trading Alerts

