

Yesterday, EUR/USD came out of consolidation, which triggered a decline to our first downside target. Will GBP/USD follow this move in the coming days?
In our opinion the following forex trading positions are justified - summary:
- EUR/USD: short (a stop-loss order at 1.2250; the initial downside target at 1.1510)
- GBP/USD: short (a stop-loss order at 1.3773; the next downside target at 1.3000)
- USD/JPY: none
- USD/CAD: none
- USD/CHF: none
- AUD/USD: short (a stop-loss order at 0.8006; the initial downside target at 0.7730)
EUR/USD
Quoting our last commentary on this currency pair:
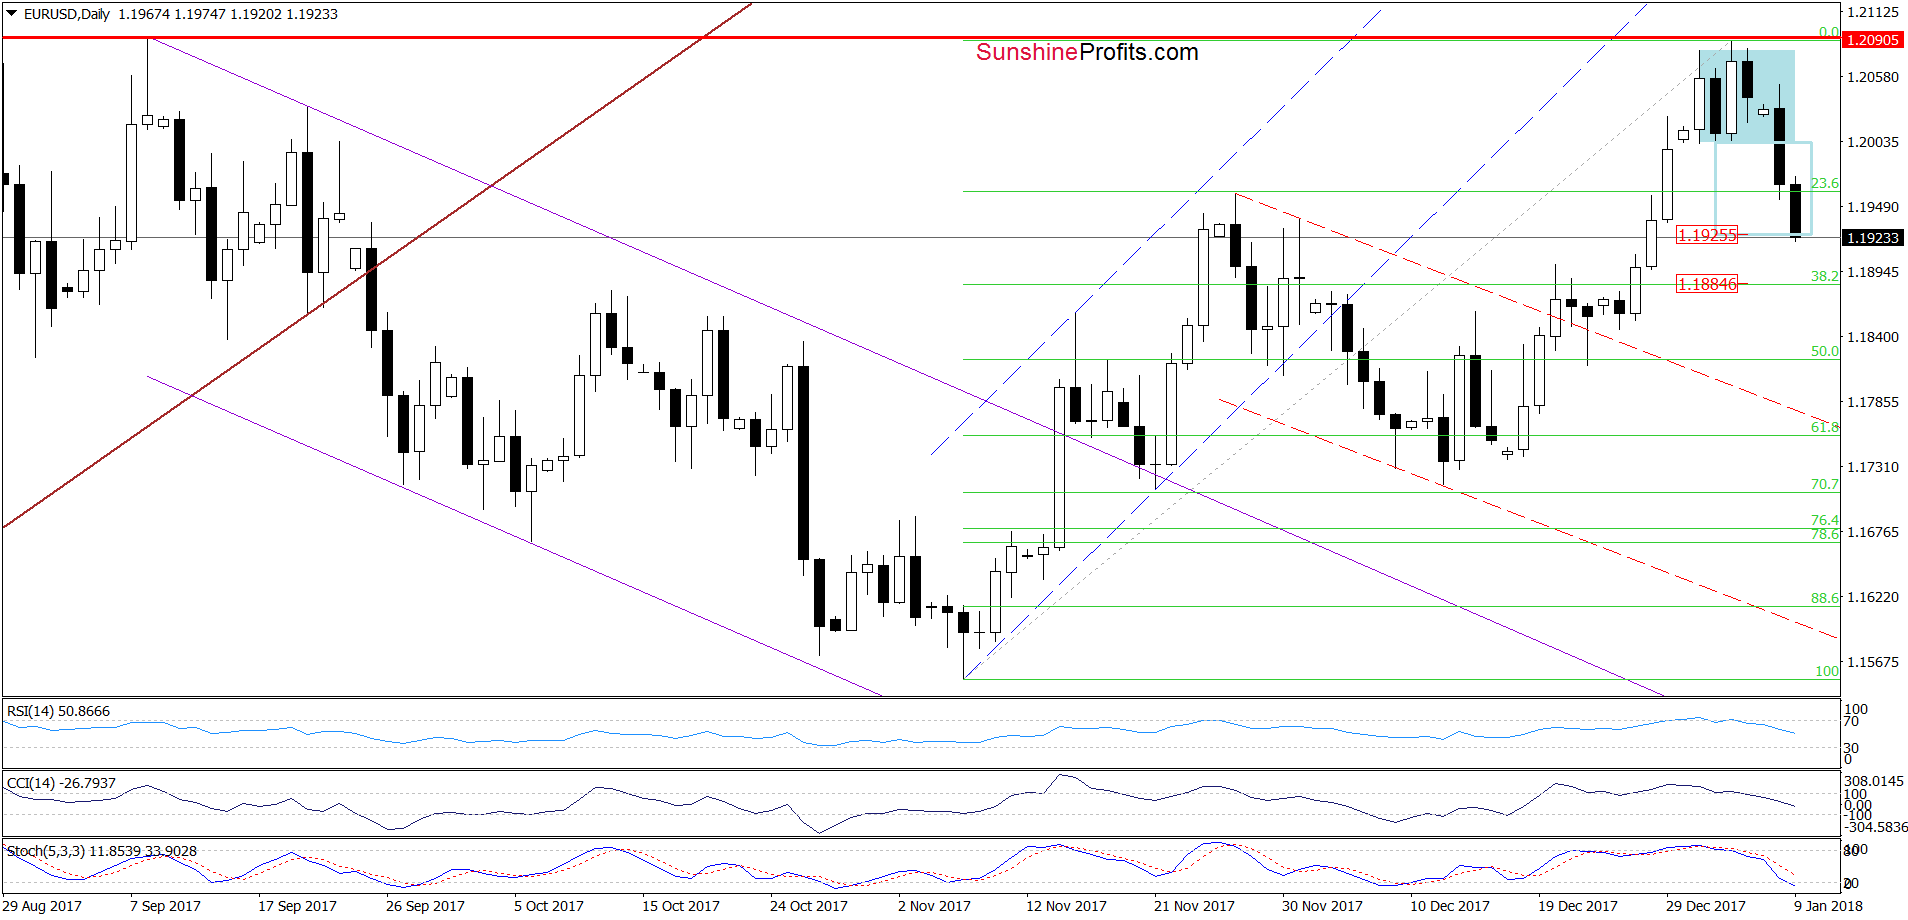
(…) the pair broke below the lower border of the blue consolidation, which suggests that we’ll see a decline to at least 1.1925, where the size of the move will correspond to the height of the formation in the coming day(s).
From today’s point of view, we see that the situation developed in line with the above scenario and EUR/USD slipped to our first downside target earlier today.
What’s next for the exchange rate? We believe that the best answer to this question will be the quote from our yesterday’s alert:
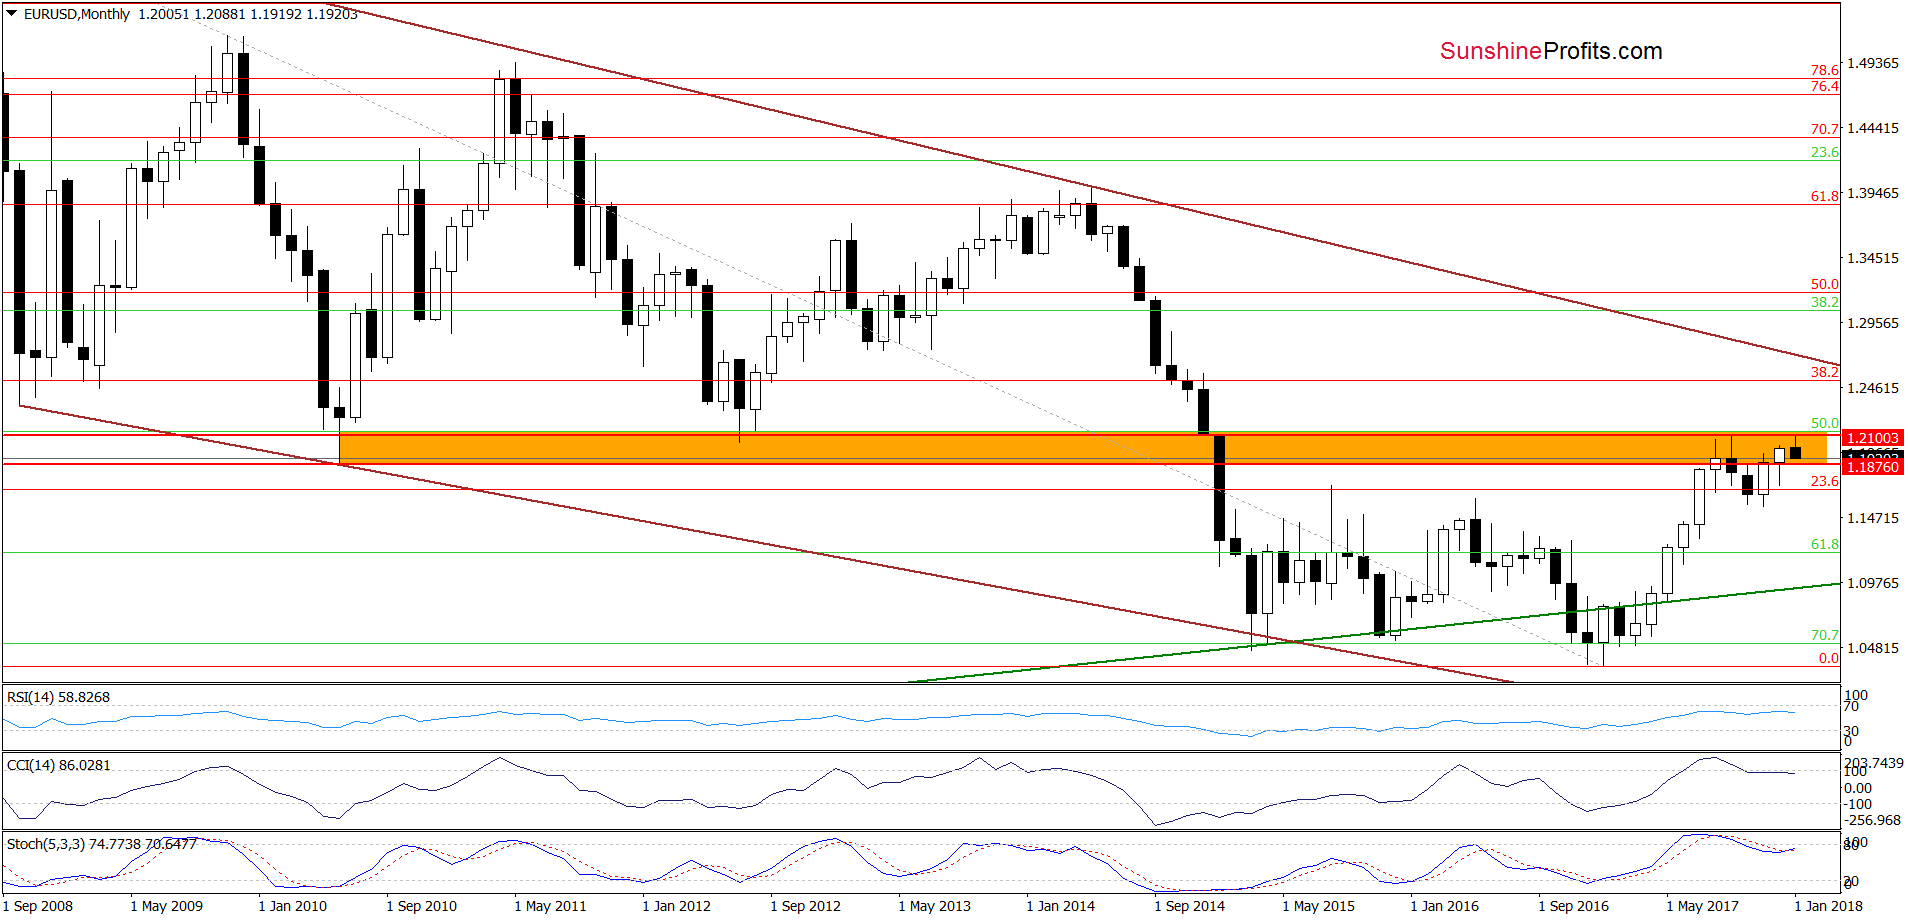
(…) if this area is broken, the next target for currency bears will be around 1.1884, where the 38.2% Fibonacci retracement (based on the entire November-January upward move) is.
Trading position (short-term; our opinion): short positions (with a stop-loss order at 1.2250 and the initial downside target at 1.1510) continue to be justified from the risk/reward perspective. We will keep you informed should anything change, or should we see a confirmation/invalidation of the above.
GBP/USD
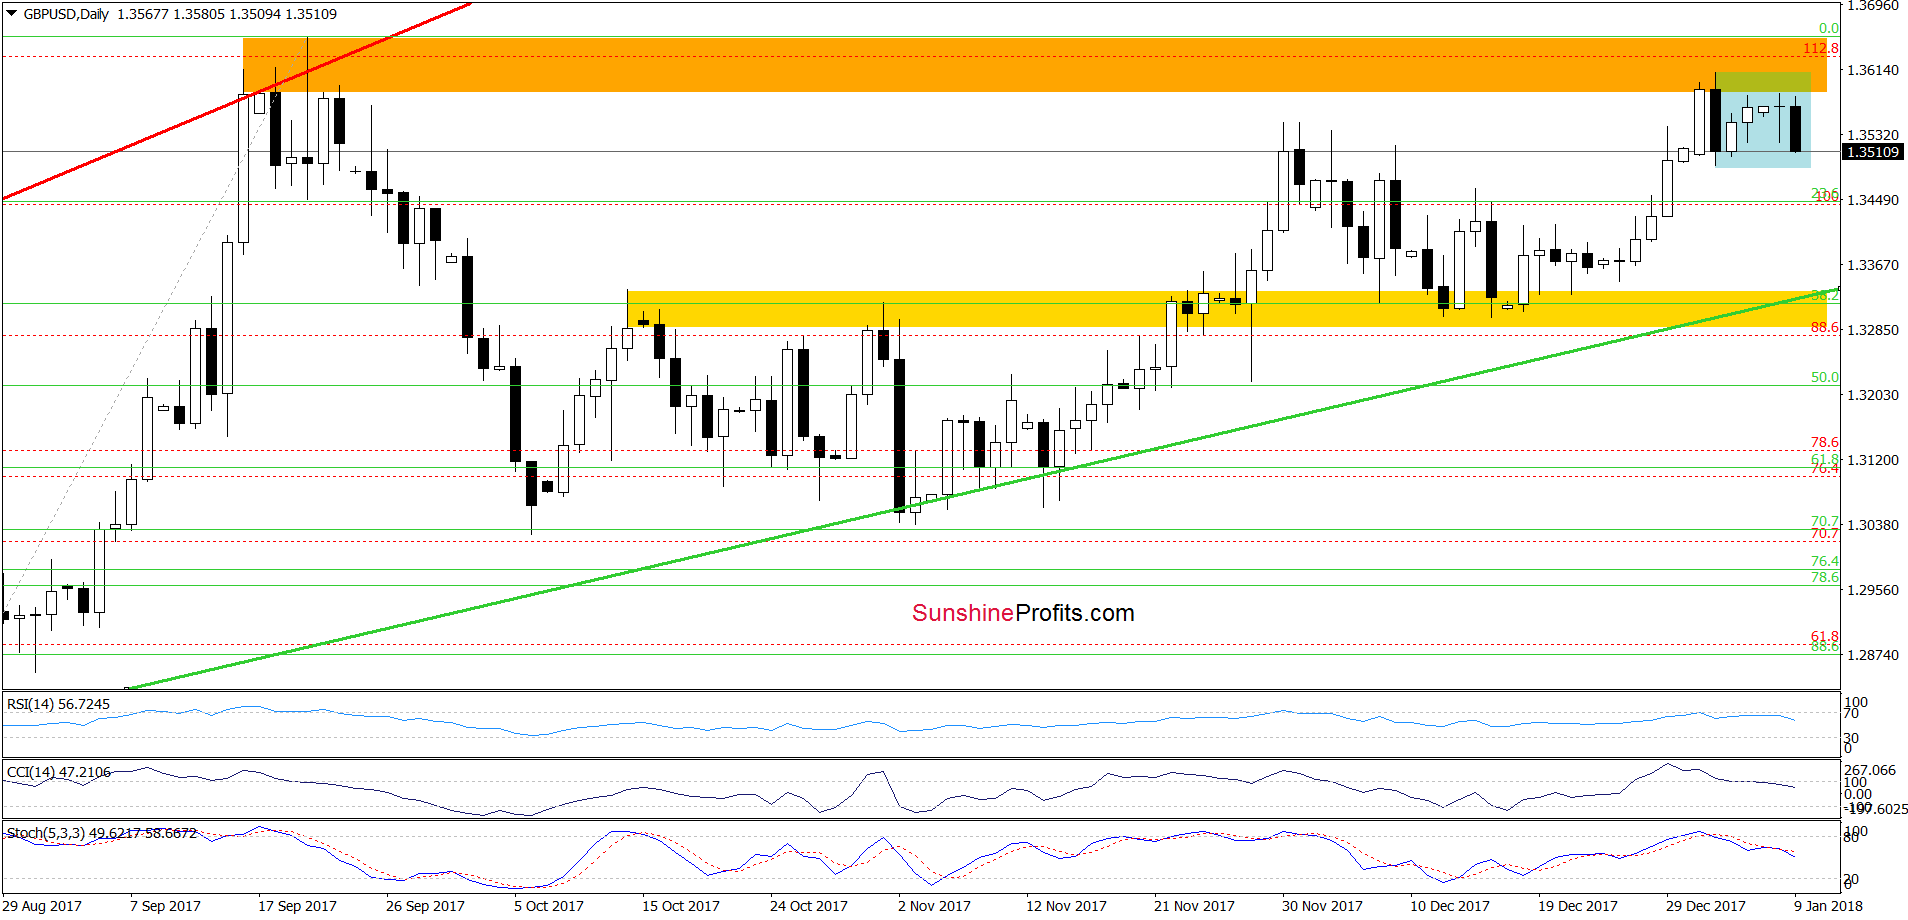
Looking at the daily chart, we see that the overall situation hasn’t changed much since several days as GBP/USD is still trading in blue consolidation under the orange resistance zone (created by the September highs), which continues to block the way to higher levels.
Earlier today, the pair moved quite sharply lower, which together with the sell signals generated by all daily indicators increase the probability of a bigger move to the south in the coming week. The pro bearish scenario is also reinforced by one more technical factor seen on the weekly chart below.
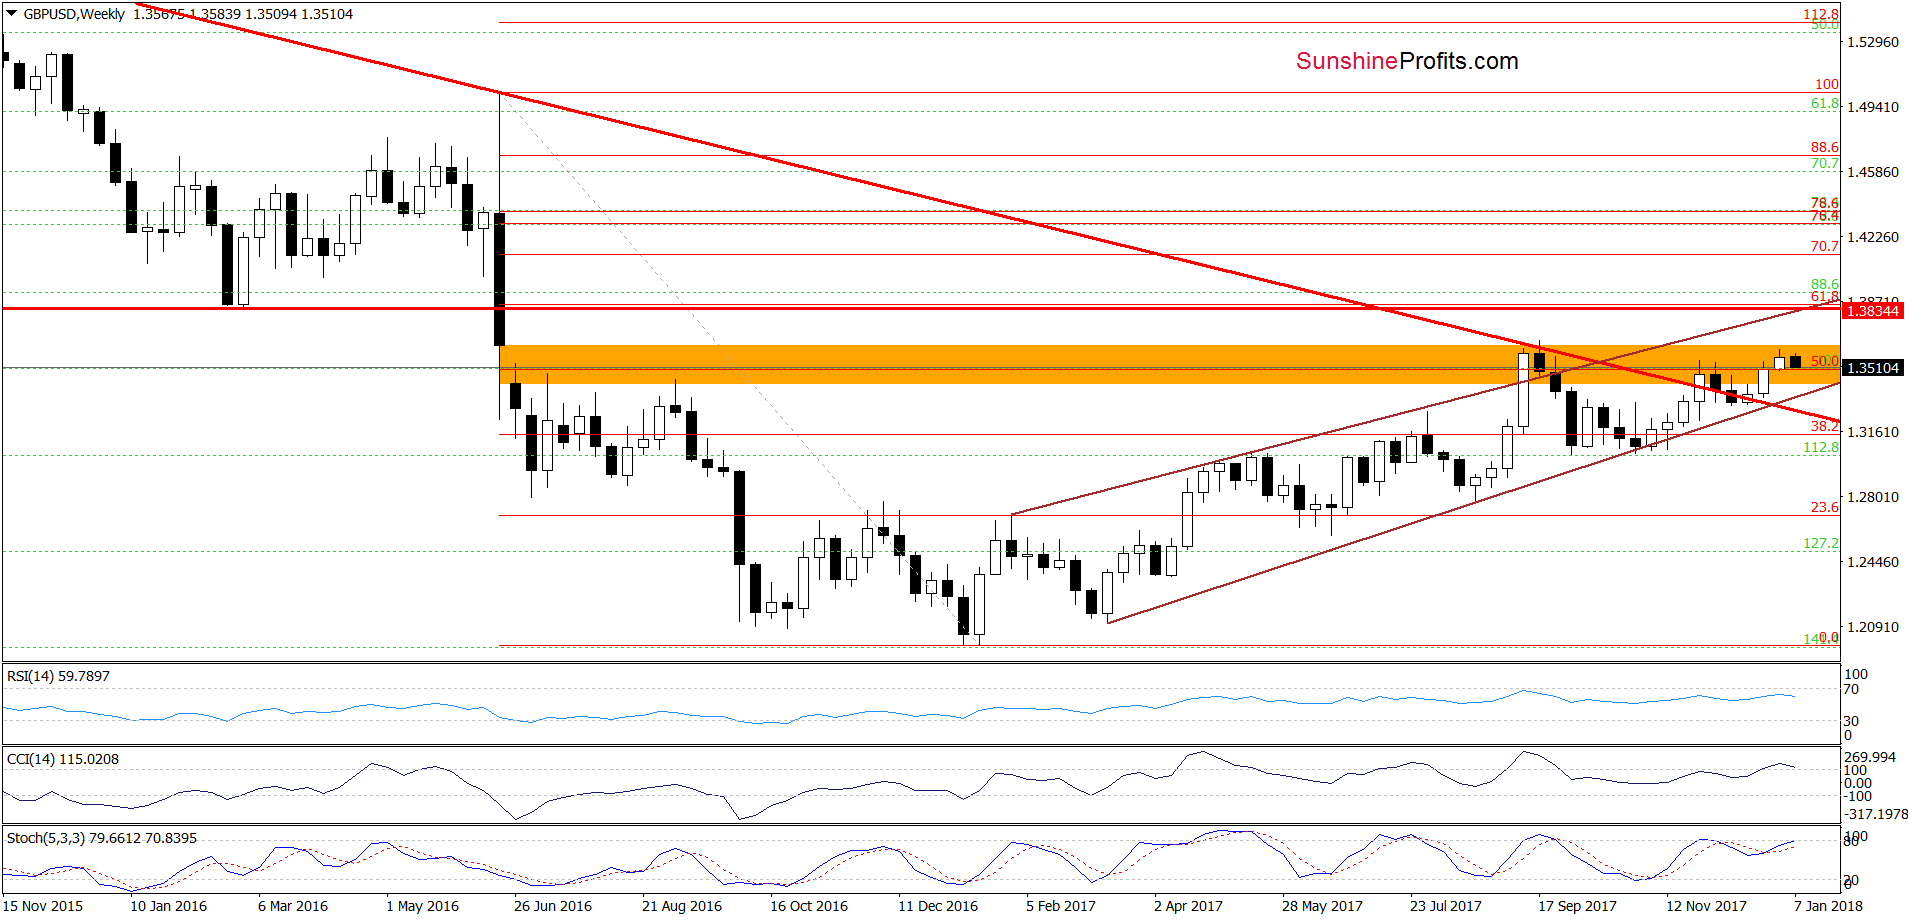
On the medium-term chart, we see that not far from current levels is also the upper border of the orange gap created in June 2016, which serves as the nearest resistance. As you see on the above chart, currency bulls tried to break above it in September, but they failed, which resulted in a bigger correction. Taking this fact into account and combining it with the short-term picture of GBP/USD, we think that another bigger move to the downside is just around the corner.
If this is the case and the exchange rate declines from current levels, the first downside target for currency bears will be around 1.3300-1.3335, where the yellow zone (which serves as the nearest support) marked on the daily chart is.
Trading position (short-term; our opinion): short positions (with a stop-loss order at 1.3773 and the next downside target at 1.3000) continue to be justified from the risk/reward perspective. We will keep you informed should anything change, or should we see a confirmation/invalidation of the above.
USD/CAD
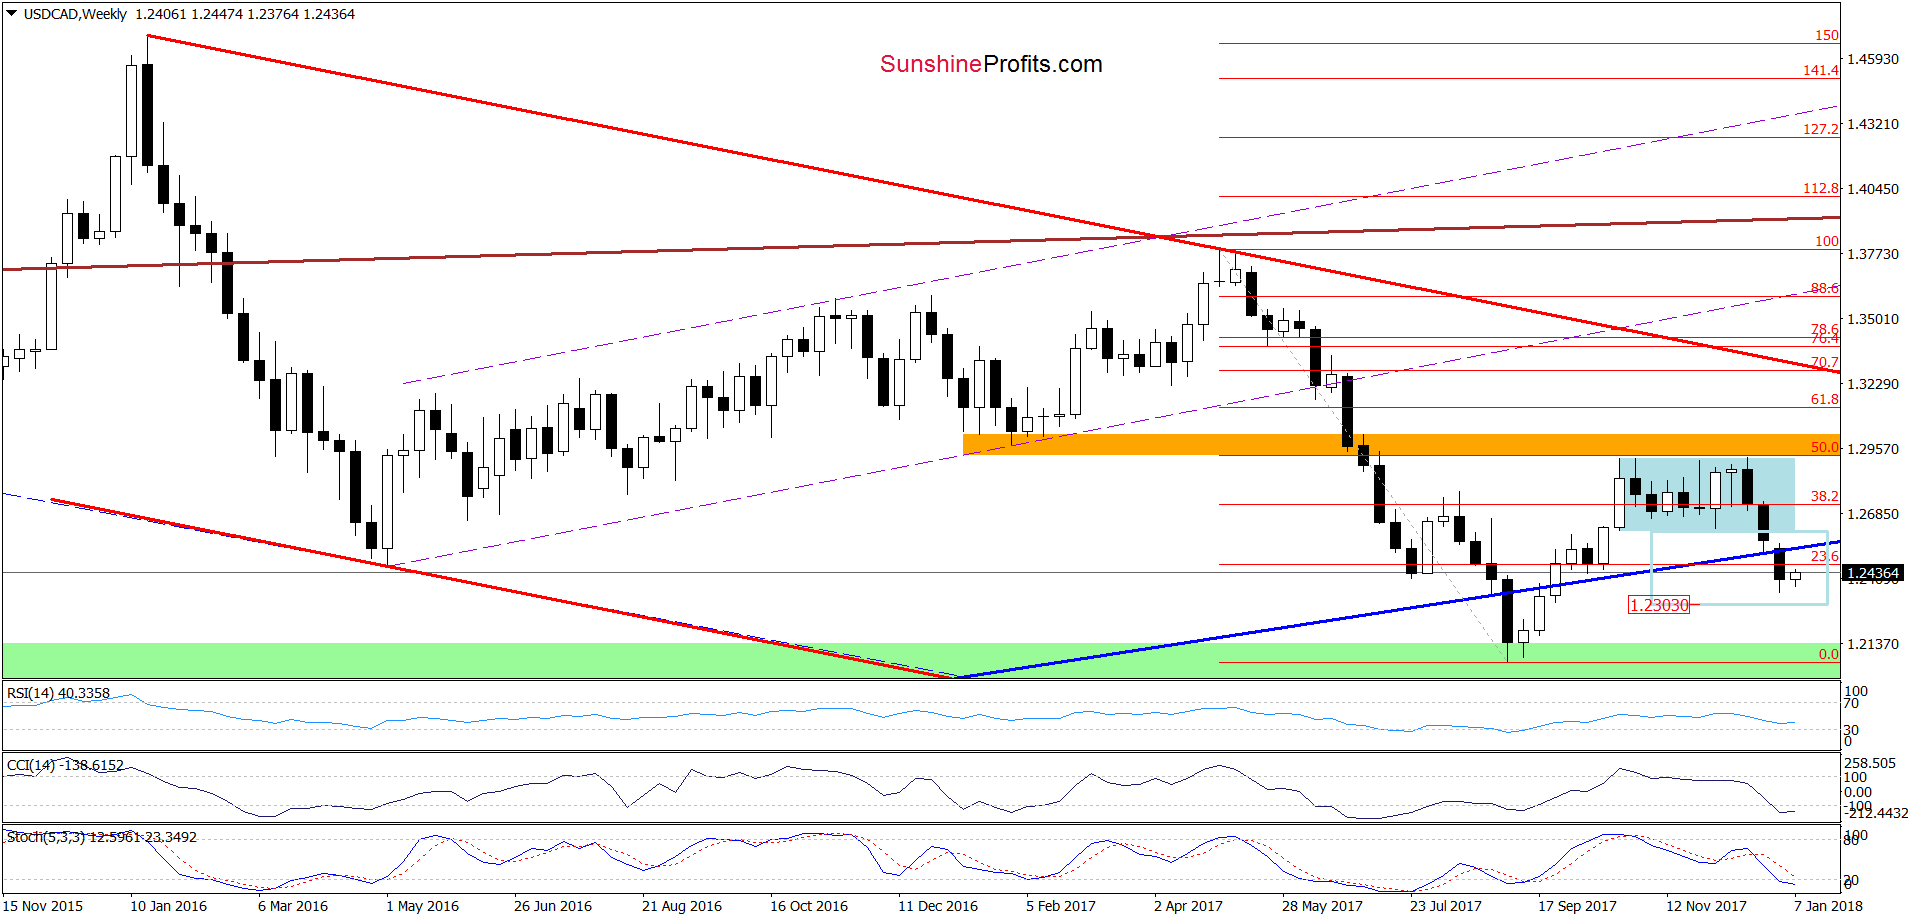
The first thing that catches the eye on the medium-term chart is a breakdown under the long-term blue support line. Although the pair rebounded slightly this week, the sell signals remain in the cards, which suggests that even if the pair extends gains from current levels, we’ll likely see one more downswing and a drop to around 1.2303, where the size of the downward move will correspond with the height of blue consolidation seen on the above chart.
How recent price action affected the very short-term picture of the exchange rate? Let’s examine the daily chart and find out.
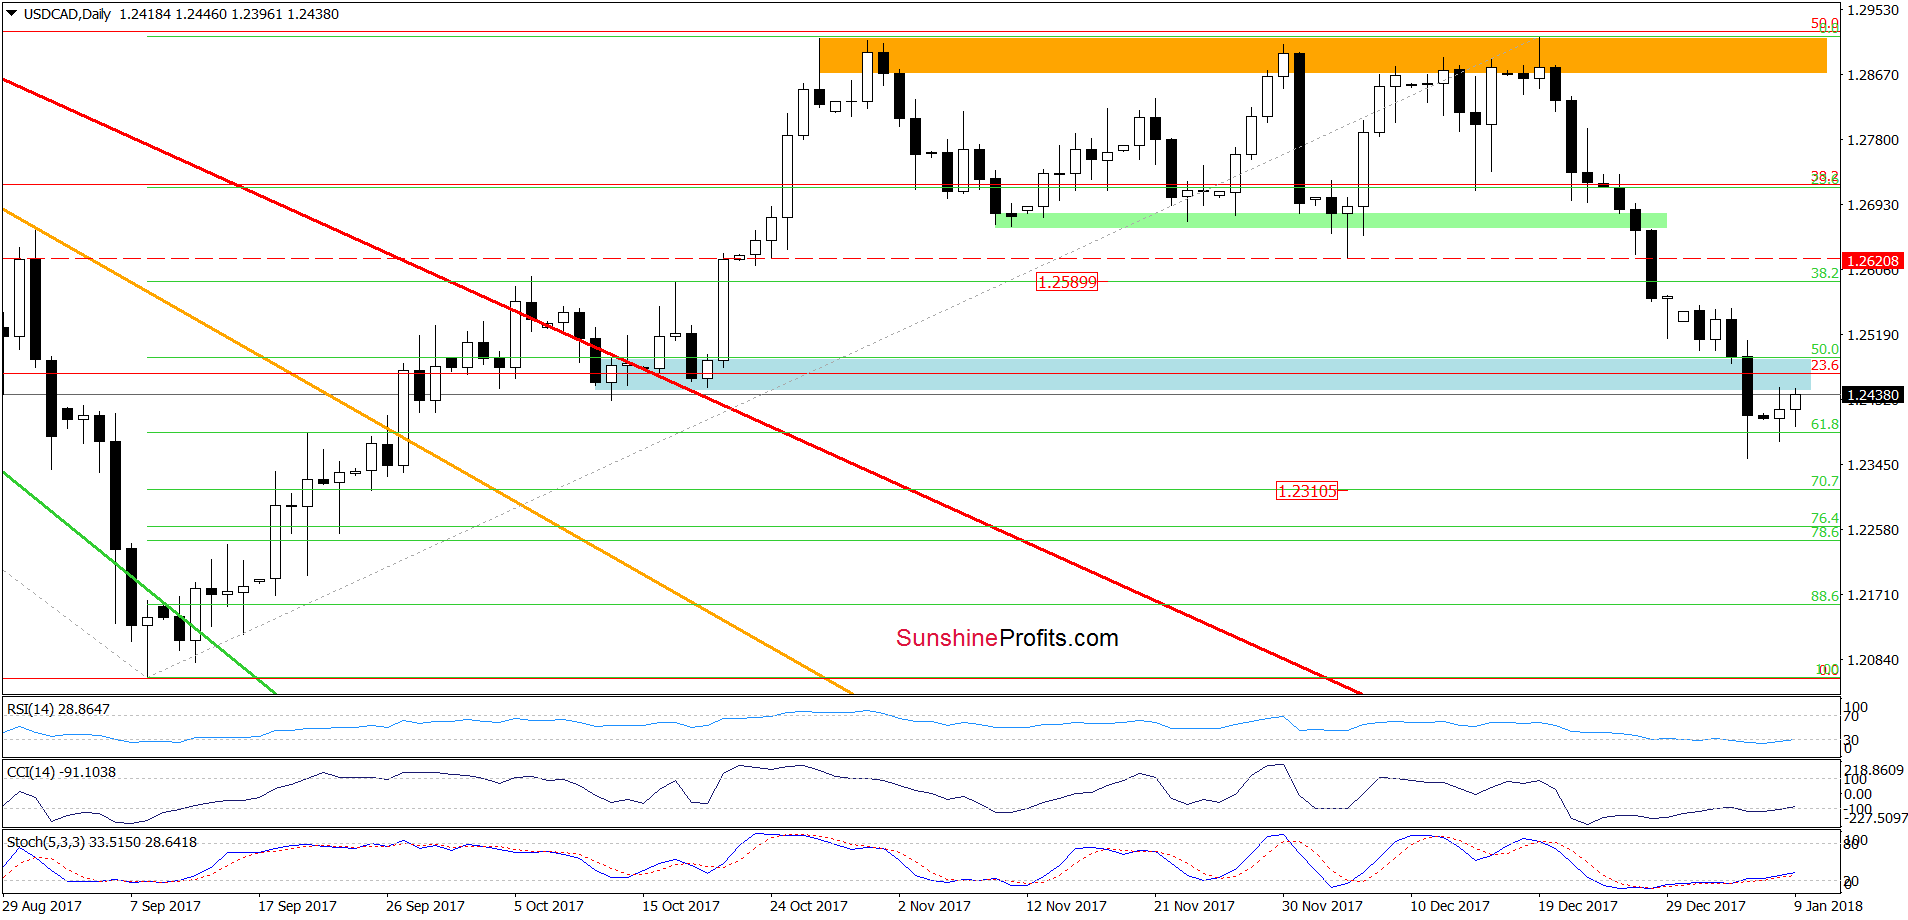
From this perspective, we see that USD/CAD dropped below the blue support zone and tested the 61.80% Fibonacci retracement, which triggered a rebound earlier this week. Although such price action looks like a verification of the earlier breakdown under the blue area, the current position of the daily indicators suggests further improvement, which is in tune with the assumption that USD/CAD could test the previously-broken long-term blue line before another downswing and a drop to our above-mentioned downside target.
Trading position (short-term; our opinion): no positions are justified from the risk/reward perspective now. We will keep you informed should anything change, or should we see a confirmation/invalidation of the above.
Thank you.
Nadia Simmons
Forex & Oil Trading Strategist
Przemyslaw Radomski, CFA
Founder, Editor-in-chief, Gold & Silver Fund Manager
Gold & Silver Trading Alerts
Forex Trading Alerts
Oil Investment Updates
Oil Trading Alerts

