

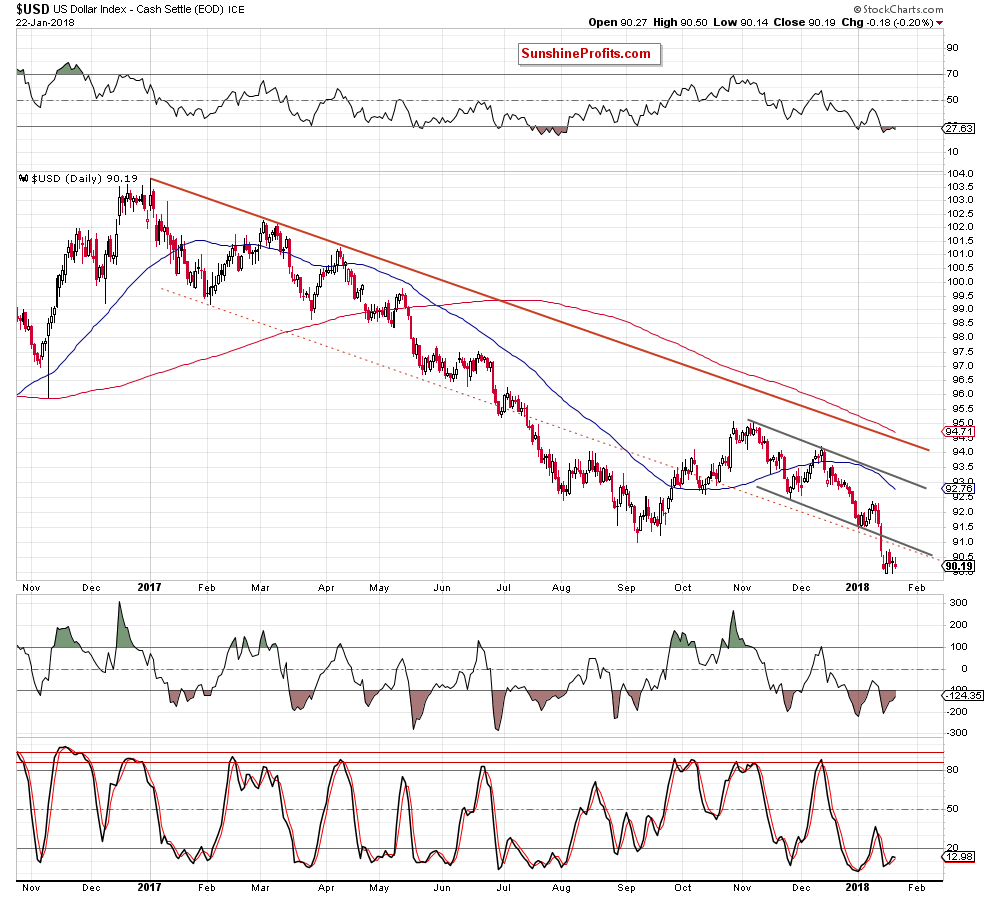
On Friday, the USD Index bounced off the previous low, but it looks like the bulls do not have enough strength to push the index higher. Is it really the show of weakness or maybe it is rather the calm before the storm, which will result in the attack of higher levels?
In our opinion the following forex trading positions are justified - summary:
- EUR/USD: none
- GBP/USD: none
- USD/JPY: none
- USD/CAD: none
- USD/CHF: none
- AUD/USD: short (a stop-loss order at 0.8138; the initial downside target at 0.7730)
EUR/USD
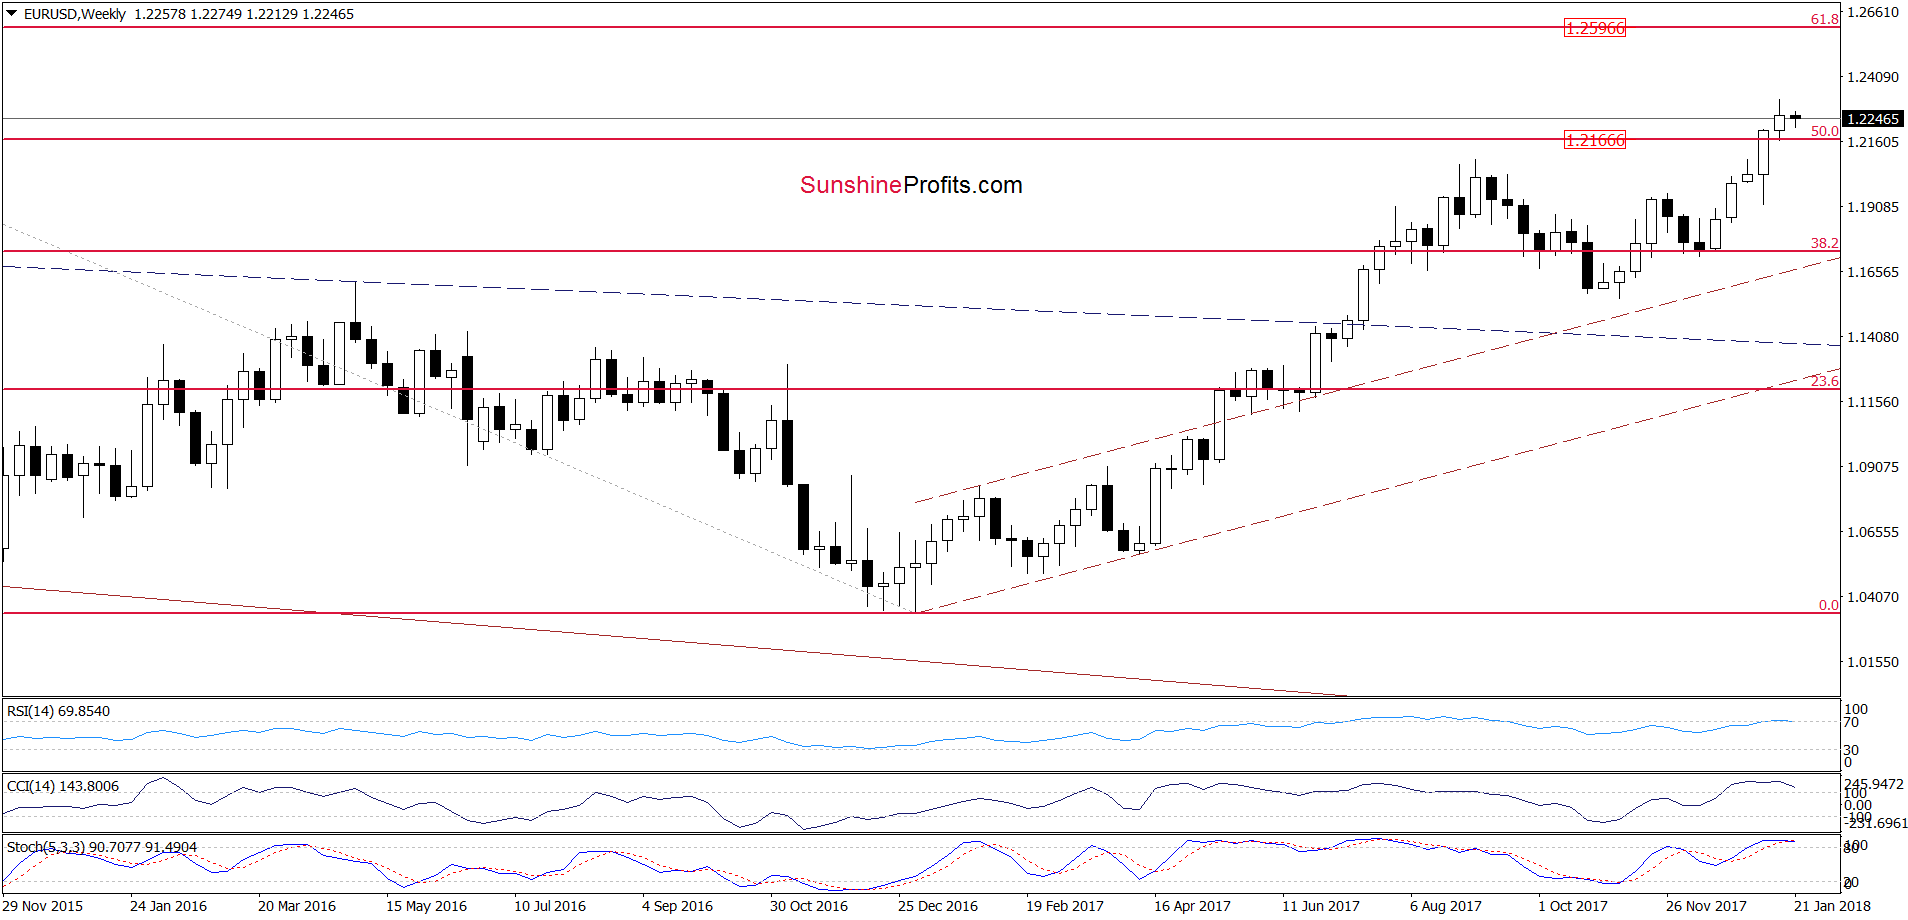
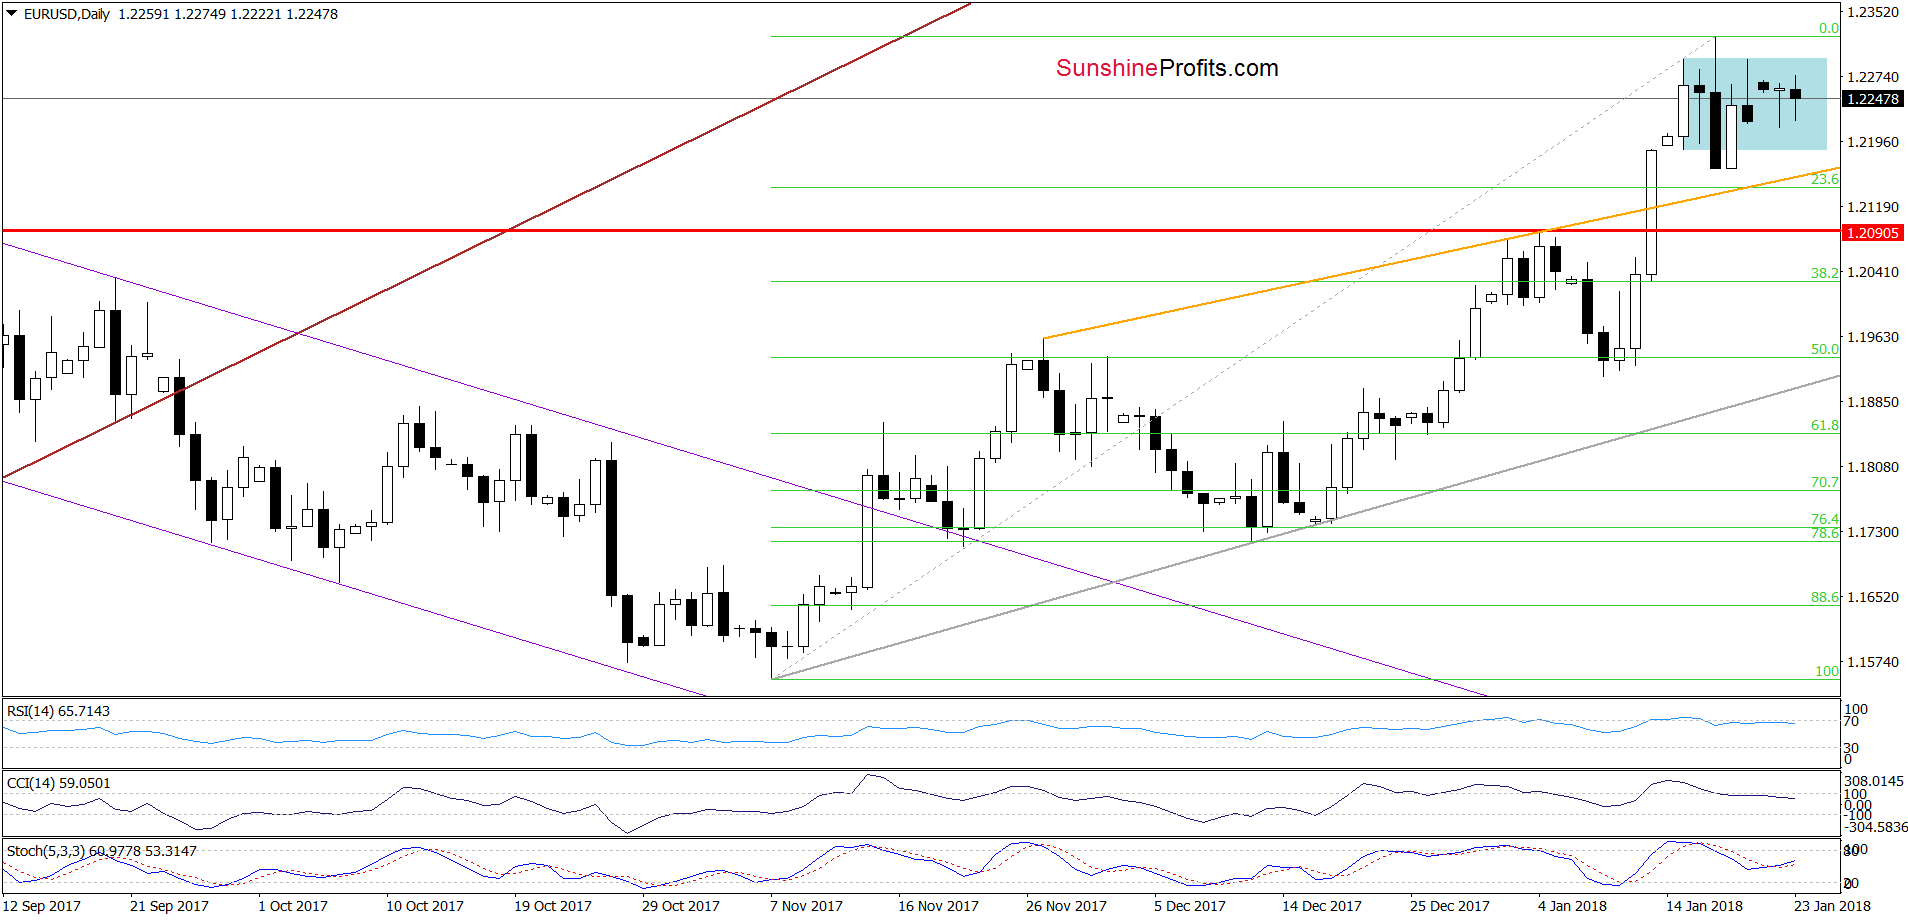
Looking at the above charts, we can summarize them in one simple sentence: more of the same. As you see EUR/USD is still wavering below the upper border of the blue consolidation and the 2018 peak, which means that what we wrote yesterday remains up-to-date also today:
(…) the previously-broken 50% Fibonacci retracement withstood the selling pressure in the previous week and continues to serve as the nearest support.
(…) Earlier today, the pair is still trading in a narrow range, which means that as long as there is no breakout above the last week’s highs or a breakdown under recent lows a bigger move to the upside or downside is not likely to be seen.
Nevertheless, taking into account the fact that the USD Index hit a double bottom on Friday (you can see it more clearly on the chart below) and the Stochastic Oscillator generated the buy signal (while the RSI is very close to doing the same), it seems that higher values of the greenback are ahead of us.
(…) Nevertheless, we still think that a bigger move to the downside in EUR/USD will be more likely and reliable only if we see an invalidation of the breakout above the 50% Fibonacci retracement (marked on the weekly chart) and the January peak. Until this time, a downswing and a verification of the breakout above the September and January 2018 highs seems to be a more credible scenario.
Why? Because, we think that the USD Index will verify the breakdown under the lower border of the red declining trend channel at the same time. Therefore, in our opinion, as long as there is no invalidation of the breakdown under this line opening full short positions in EUR/USD is not justified from the risk/reward perspective.
Trading position (short-term; our opinion): No positions are justified from the risk/reward perspective, however, if we see an invalidation of the breakout above the above-mentioned 50% Fibonacci retracement and the January peak, we’ll likely open short positions. We will keep you informed should anything change, or should we see a confirmation/invalidation of the above.
GBP/USD
In our last commentary on this currency pair, we wrote the following:
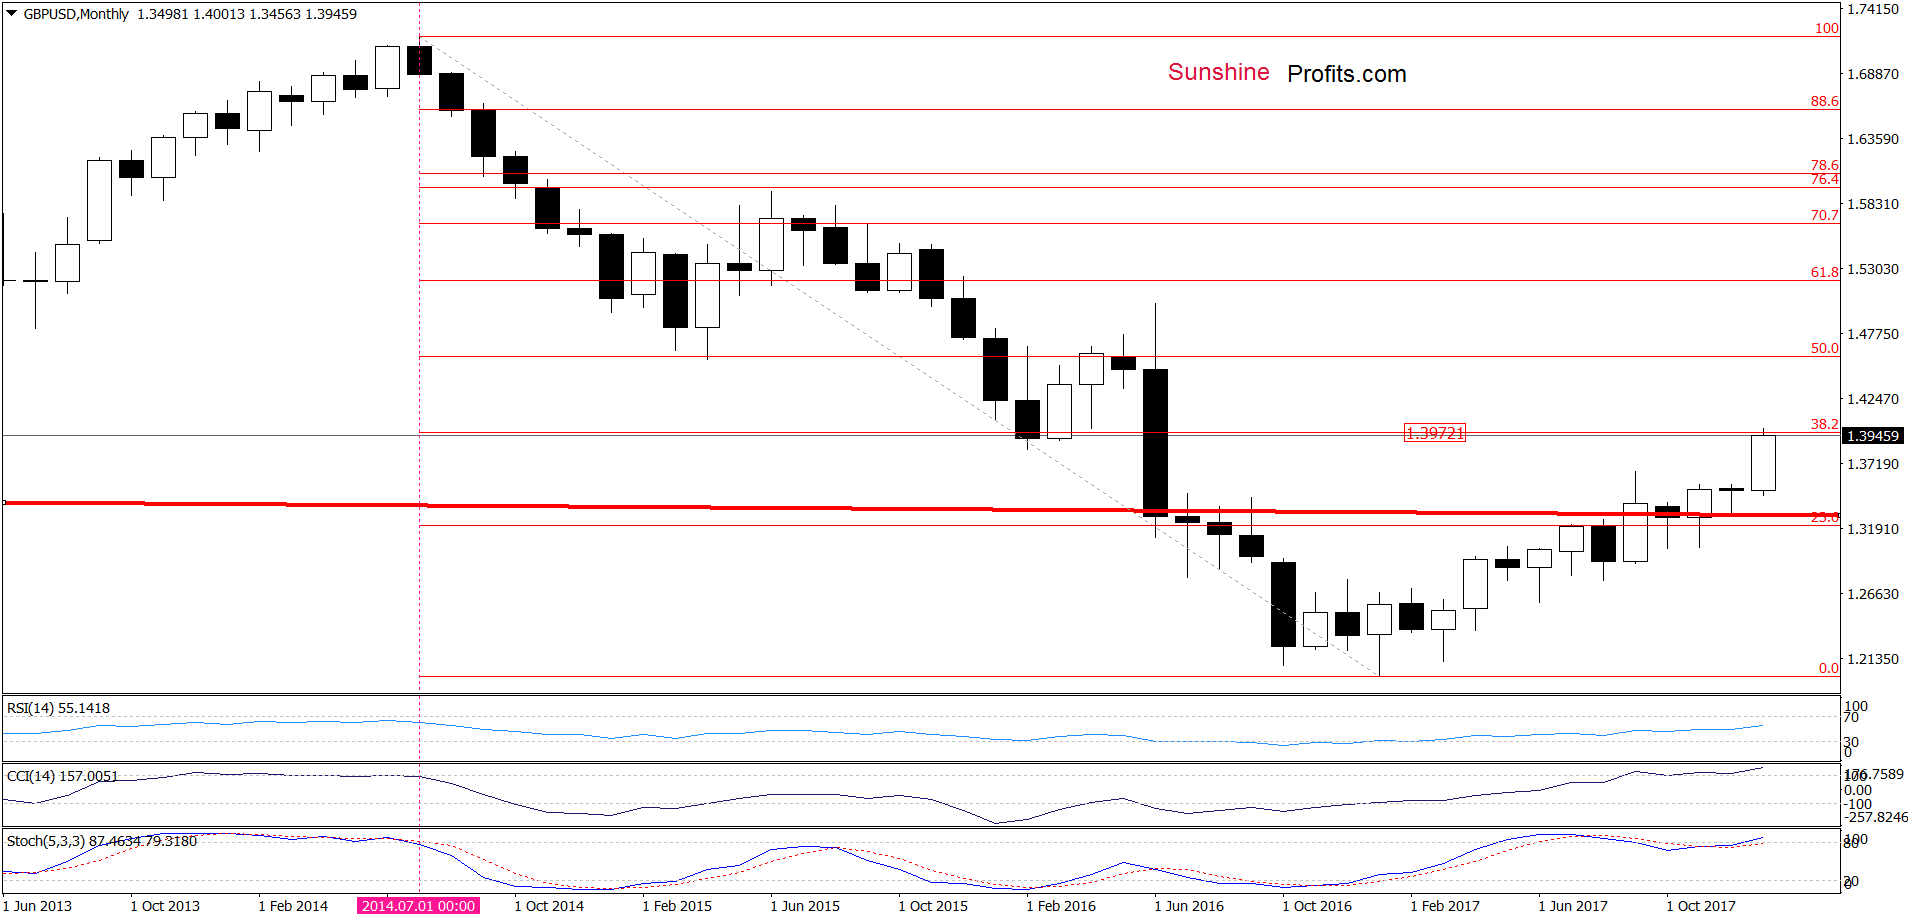
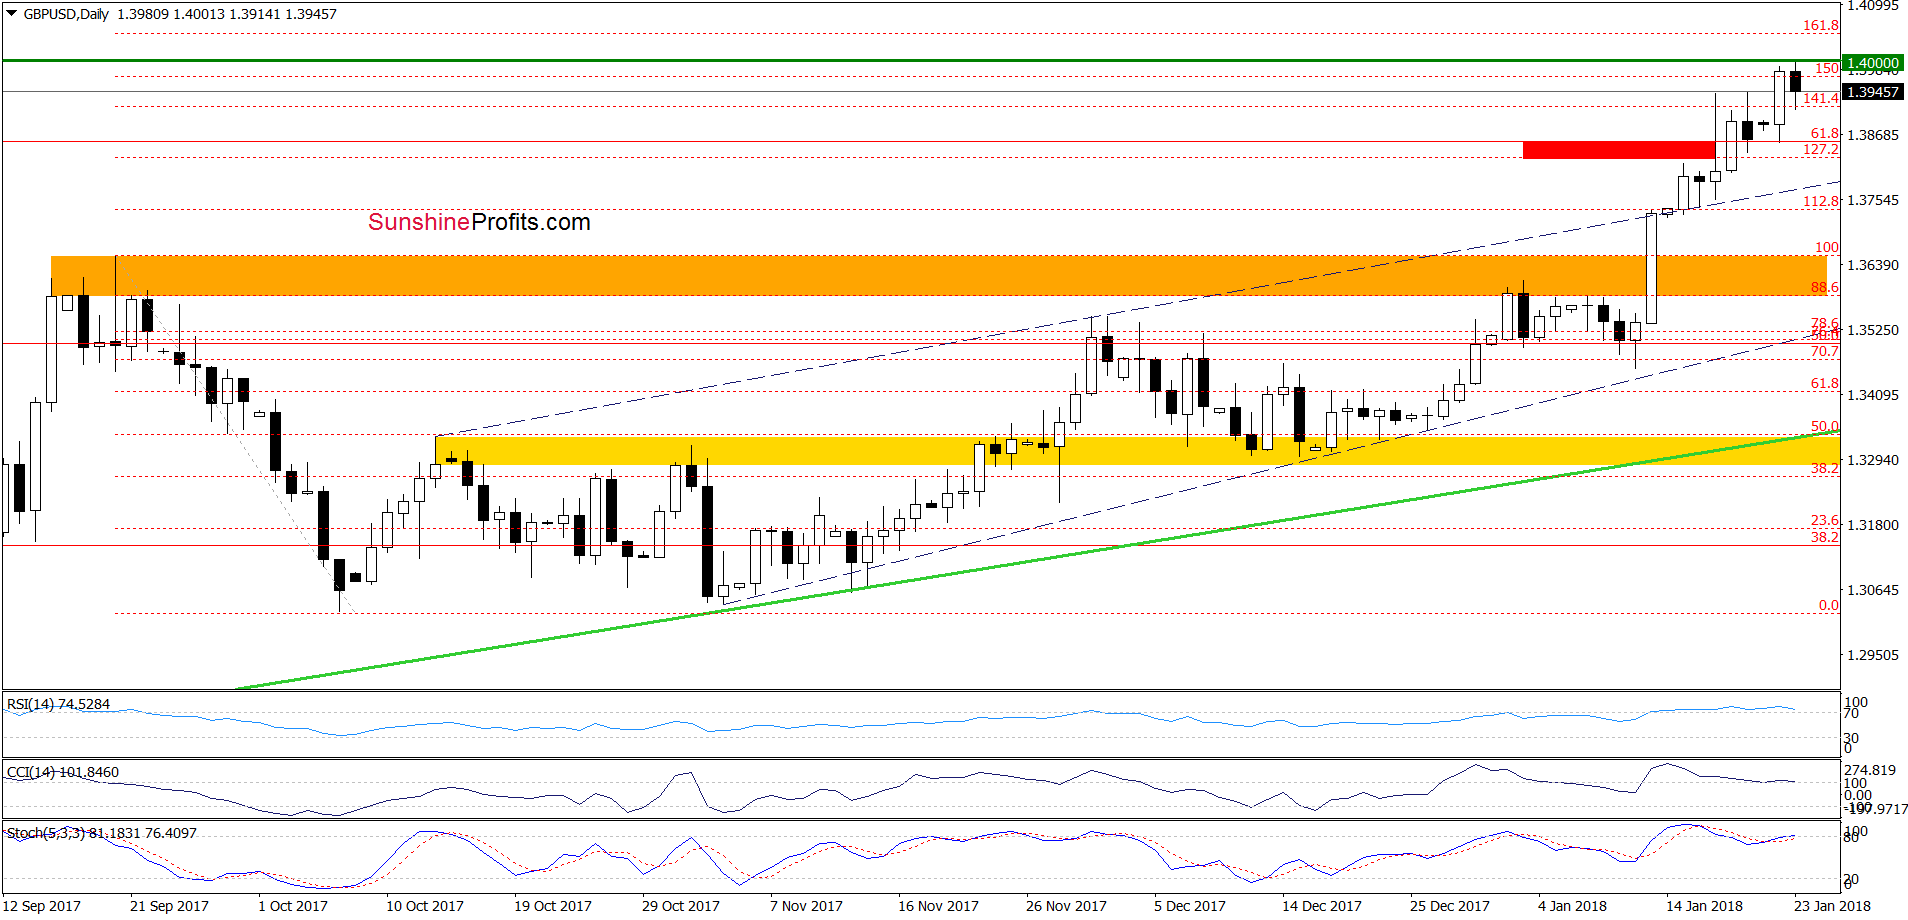
(…) GBP/USD broke above the red resistance zone created by the 61.8% Fibonacci retracement (it will be seen more clearly on the weekly chart below) and the 127.2% Fibonacci extension based on the entire September-October downward move. Taking this fact into account (…) we think that GBP/USD could test the 150% Fibonacci extension or even barrier of 1.4000.
From today’s point of view, we see that the situation developed in line with the above scenario and currency bulls pushed GBP/USD to our upside target earlier today. Thanks to today’s move the exchange rate also increased to the 38.2% Fibonacci retracement, which increases the probability of reversal and a bigger move to the downside.
Nevertheless, in our opinion, such price action will be more likely and reliable if the pair closes one of the following session under the September high and the upper line of the black rising trend channel marked with dashed lines on the daily chart. If we see such deterioration, we’ll consider opening short positions.
Trading position (short-term; our opinion): no positions are justified from the risk/reward perspective. However, if GBP/USD closes one of the following session under the September high and the upper line of the black rising trend channel, we’ll consider opening short positions. We will keep you informed should anything change, or should we see a confirmation/invalidation of the above.
USD/JPY
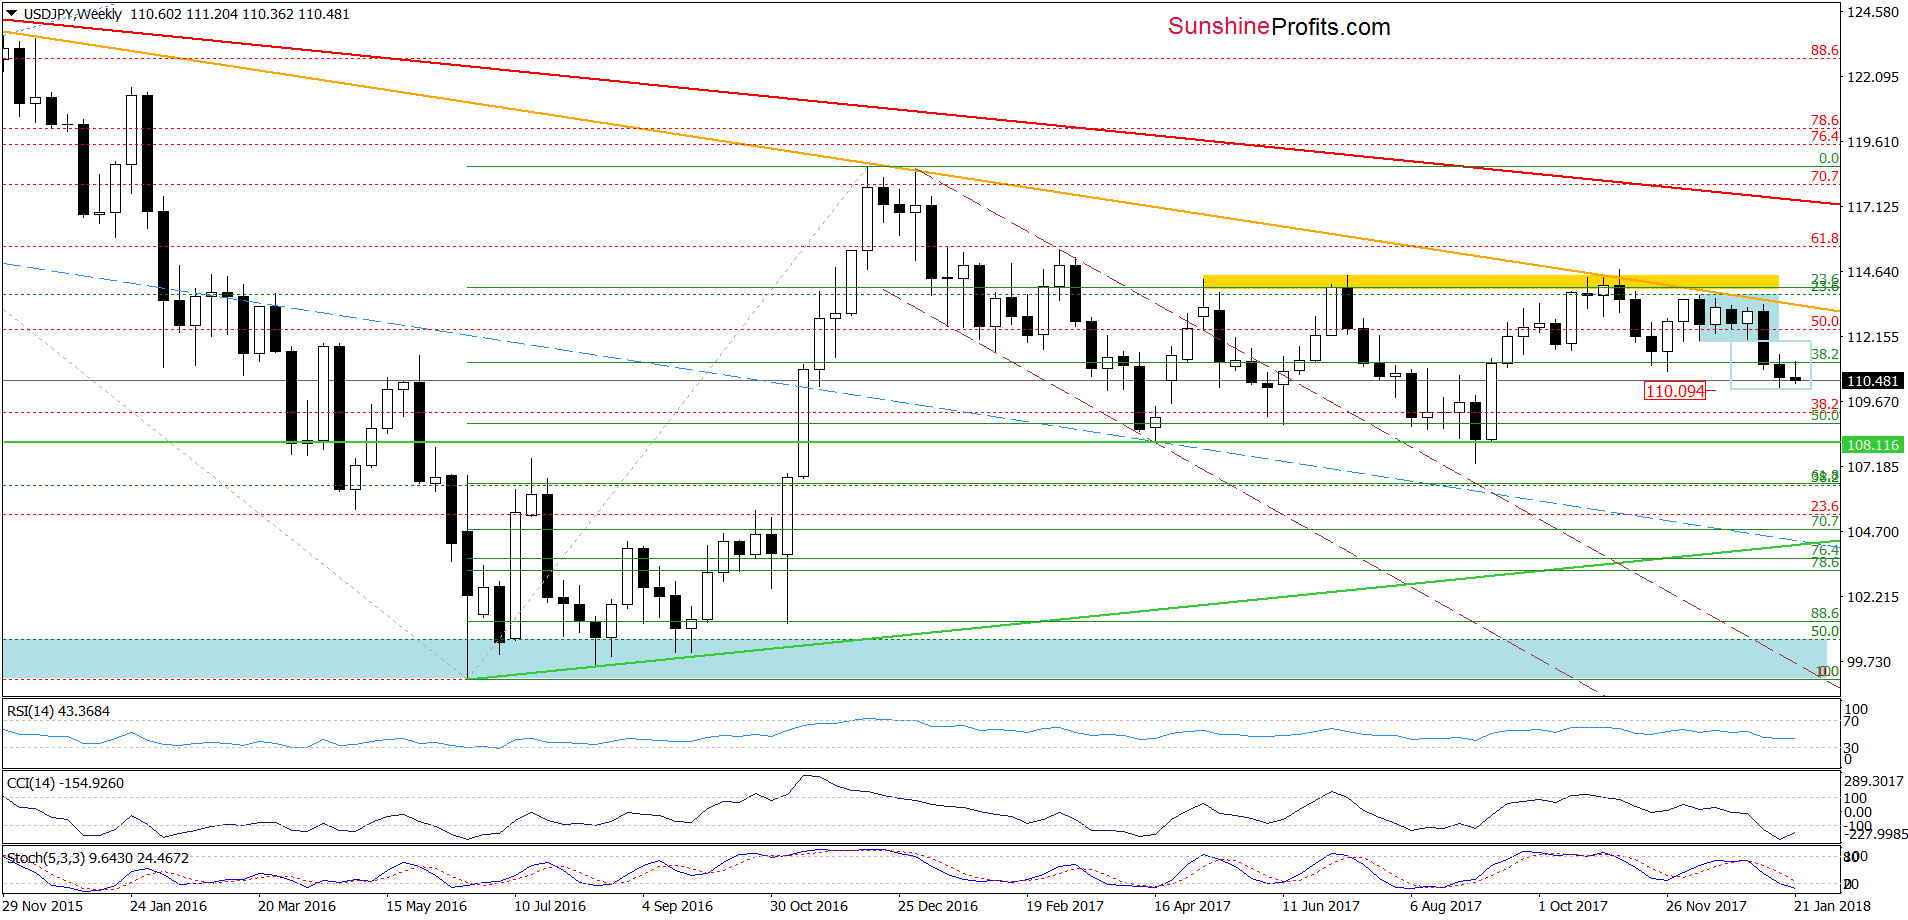
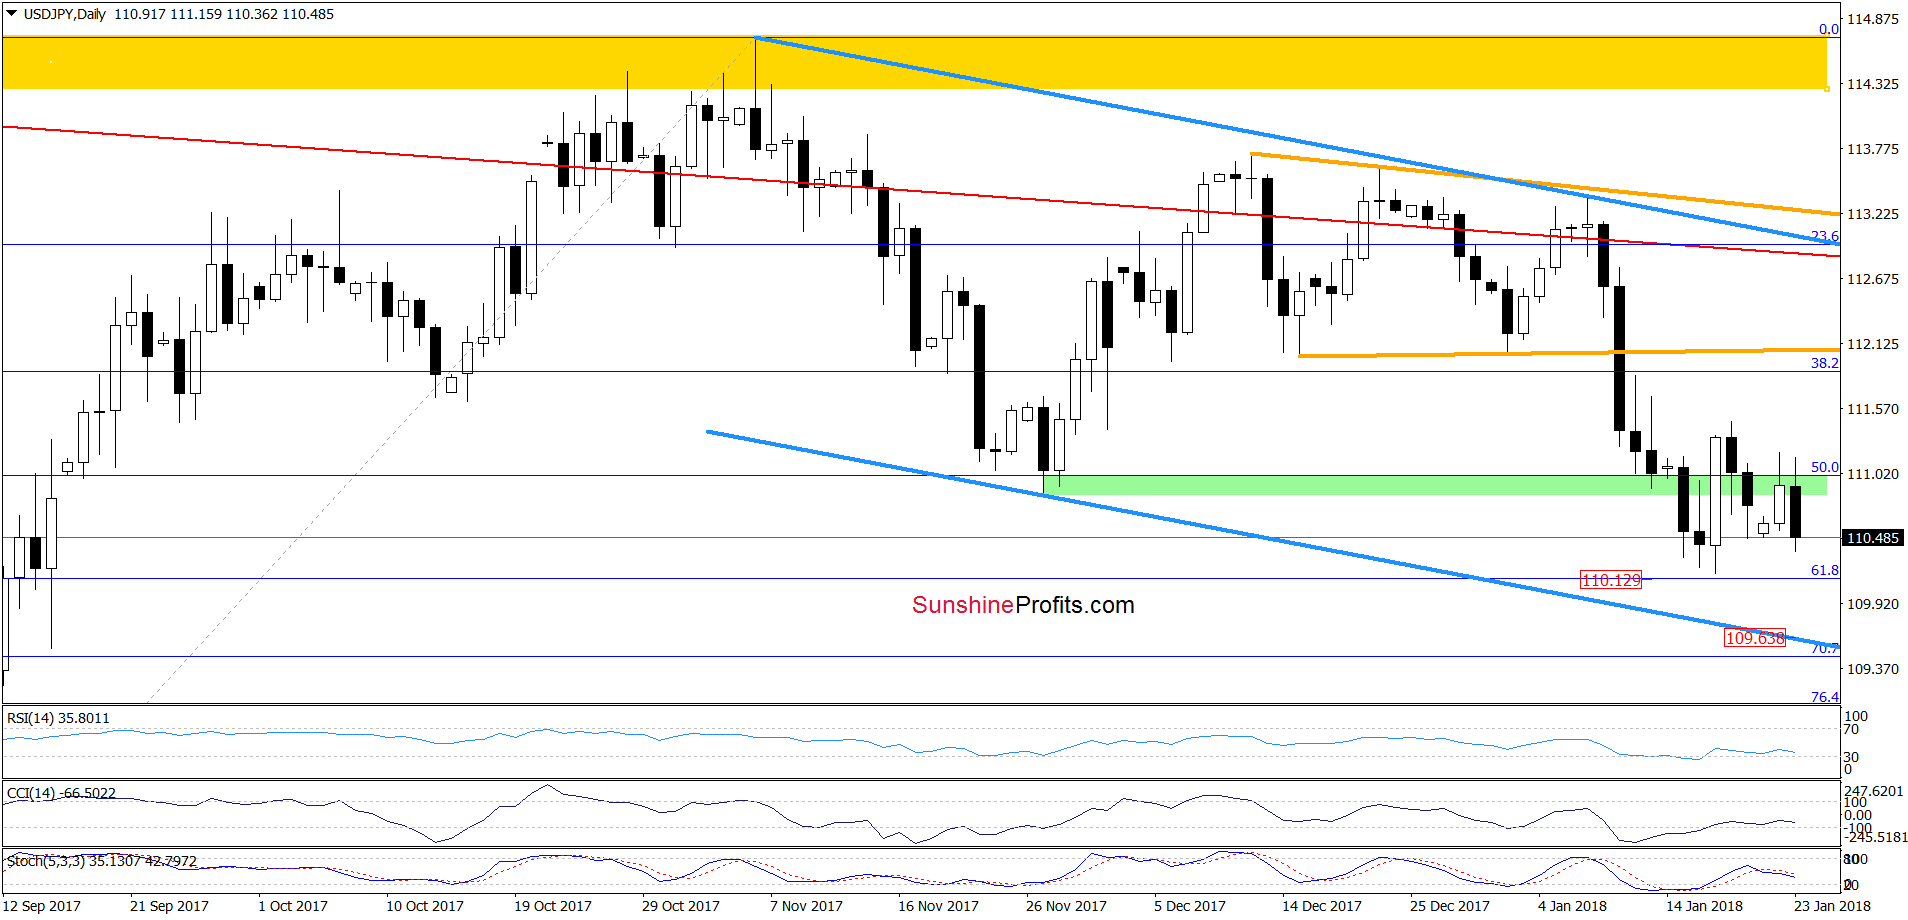
From today’s point of view, we see that although USD/JPY invalidated the earlier breakdown under the green support zone (created by the November lows and the 50% Fibonacci retracement) in the previous week, currency bulls didn’t manage to push the pair higher. This show of weakness triggered another move to the downside, which suggests a test of the 61.8% Fibonacci retracement. However, if this support is broken, the next downside target for currency bears will be the lower border of the blue declining trend channel (currently around 109.64) in the coming days.
Trading position (short-term; our opinion): No positions are justified from the risk/reward perspective now. We will keep you informed should anything change, or should we see a confirmation/invalidation of the above.
Thank you.
Nadia Simmons
Forex & Oil Trading Strategist
Przemyslaw Radomski, CFA
Founder, Editor-in-chief, Gold & Silver Fund Manager
Gold & Silver Trading Alerts
Forex Trading Alerts
Oil Investment Updates
Oil Trading Alerts

