

Although the British pound moved higher against the greenback on Friday, currency bears stopped their opponents and erased almost the entire upswing. As a result, GBP/USD invalidated the earlier breakout above important line and created a disturbing formation on the daily chart. Currency bulls felt its consequences earlier today. We invite you to read today's alert, in which we explain the whole situation.
In our opinion the following forex trading positions are justified - summary:
- EUR/USD: short (a stop-loss order at 1.2677; the initial downside target at 1.2186)
- GBP/USD: short (a stop-loss order at 1.4432; the initial downside target at 1.3820)
- USD/JPY: none
- USD/CAD: none
- USD/CHF: none
- AUD/USD: short (a stop-loss order at 0.8137; the initial downside target at 0.7730)
EUR/USD
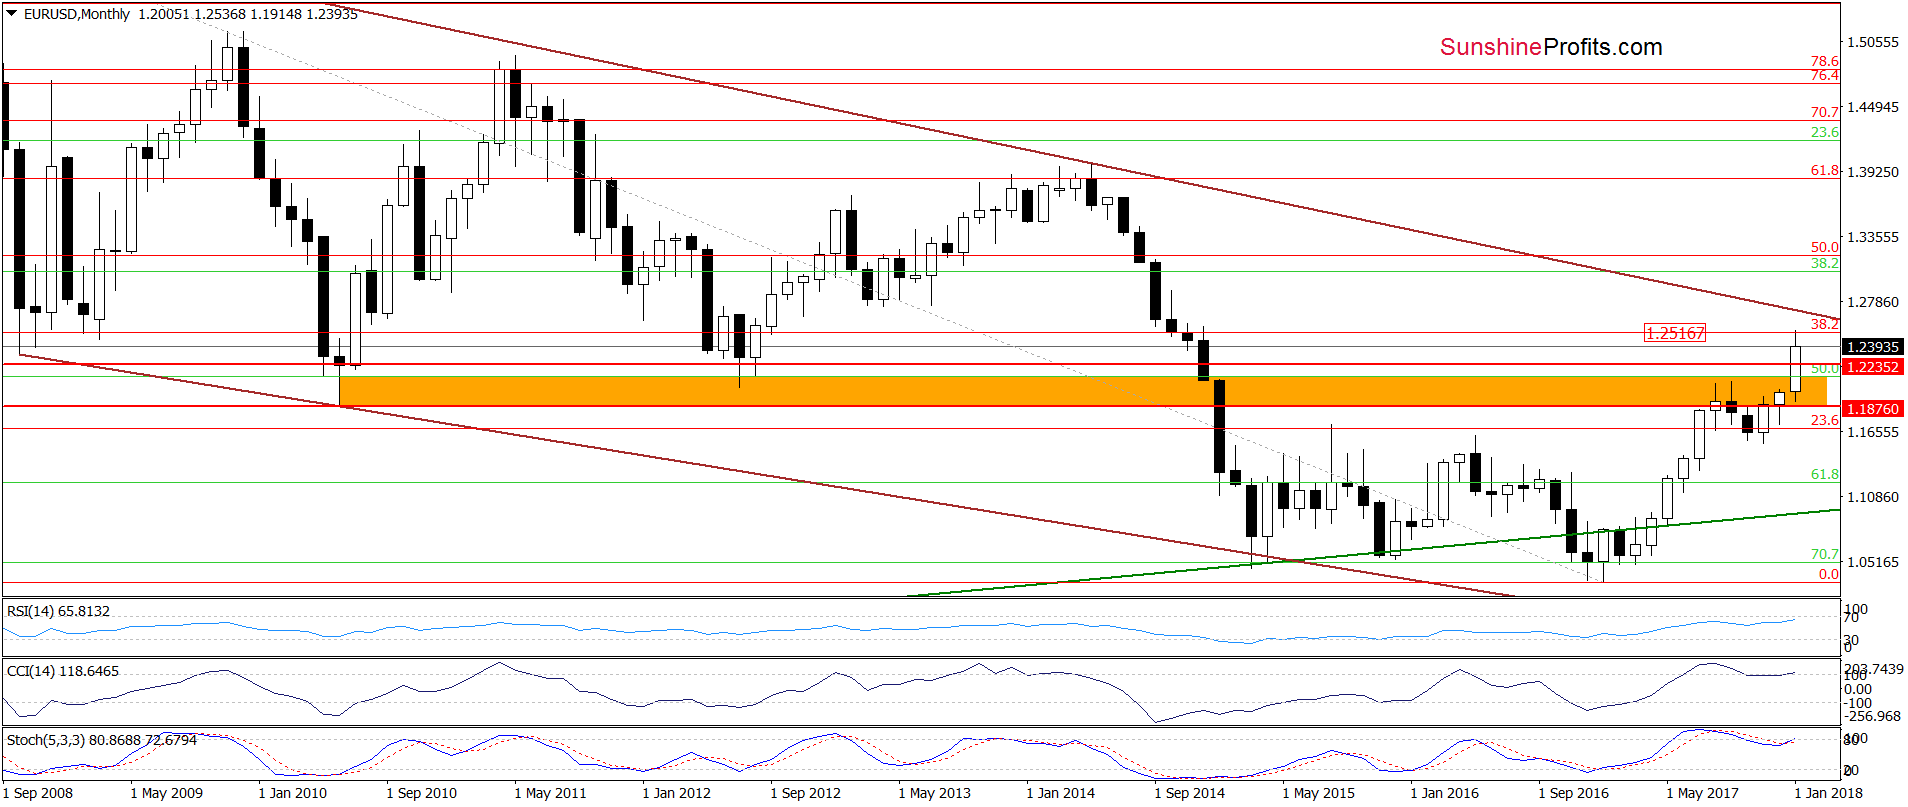
Looking at the long-term chart, we see that the 38.2% Fibonacci retracement based on the entire 2008-2017 downward move continues to keep gains in check. Are there any reliable reasons to open short positions? Before we know the answer to this question let’s recall the quote from our Friday alert and examine the daily chart.
In our last Forex Trading Alert, we wrote the following:
(…) the exchange rate increased to our upside target (…) this important resistance triggered a quite sharp pullback, which erased all Thursday’s gains. As a result, currency bears created a shooting star on the (…) chart (a bearish candlestick formation), which doesn’t bode well for currency bulls.
Earlier today, the buyers tried to push the pair higher, but during the pre-session trading their efforts were unsuccessful, which suggests that we may see another bearish candle on the daily chart. If we see such price action, we’ll consider opening short positions.
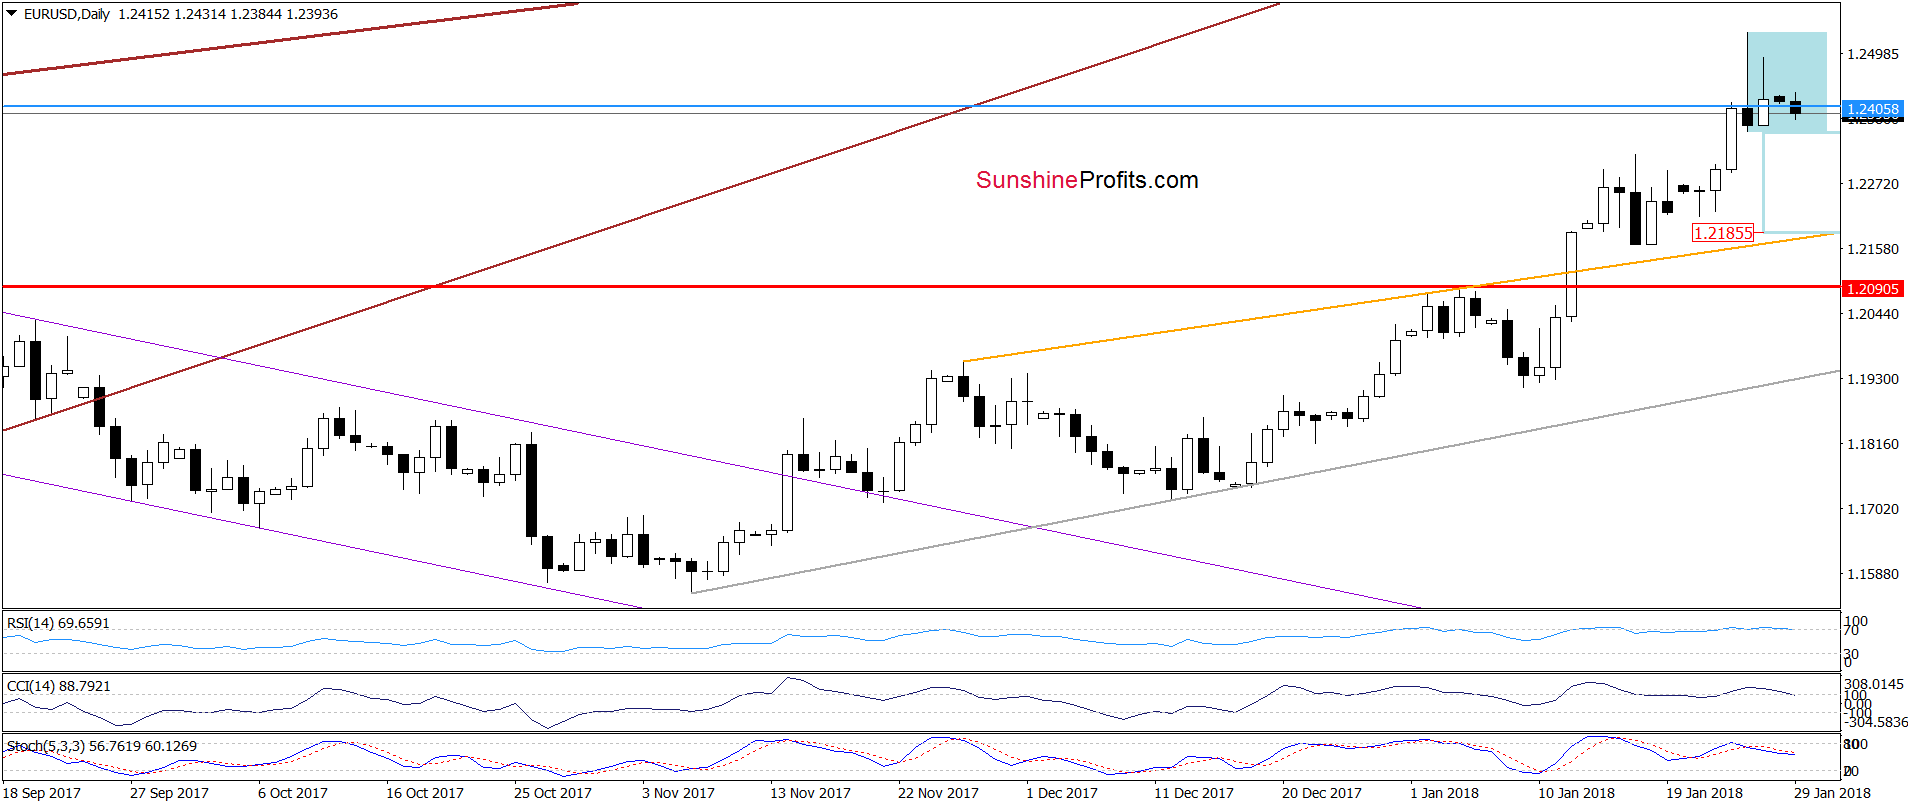
As you see on the daily chart, currency bears pushed EUR/USD lower (as we had expected) and created one more candle with a long upper shadow, which confirms that the resistance area around the above-mentioned 38.2% Fibonacci retracement is strong at the moment.
Additionally, all indicators generated sell signals, which together with the current situation in the USD Index (the comment that we made on Friday is up-to-date and you will find it under the index chart) increases the probability of further declines.
Although the exchange rate is trading in the blue consolidation now, we think that the breakdown below the lower line of the formation is more likely than not. Therefore, opening short positions is justified from the risk/reward perspective.
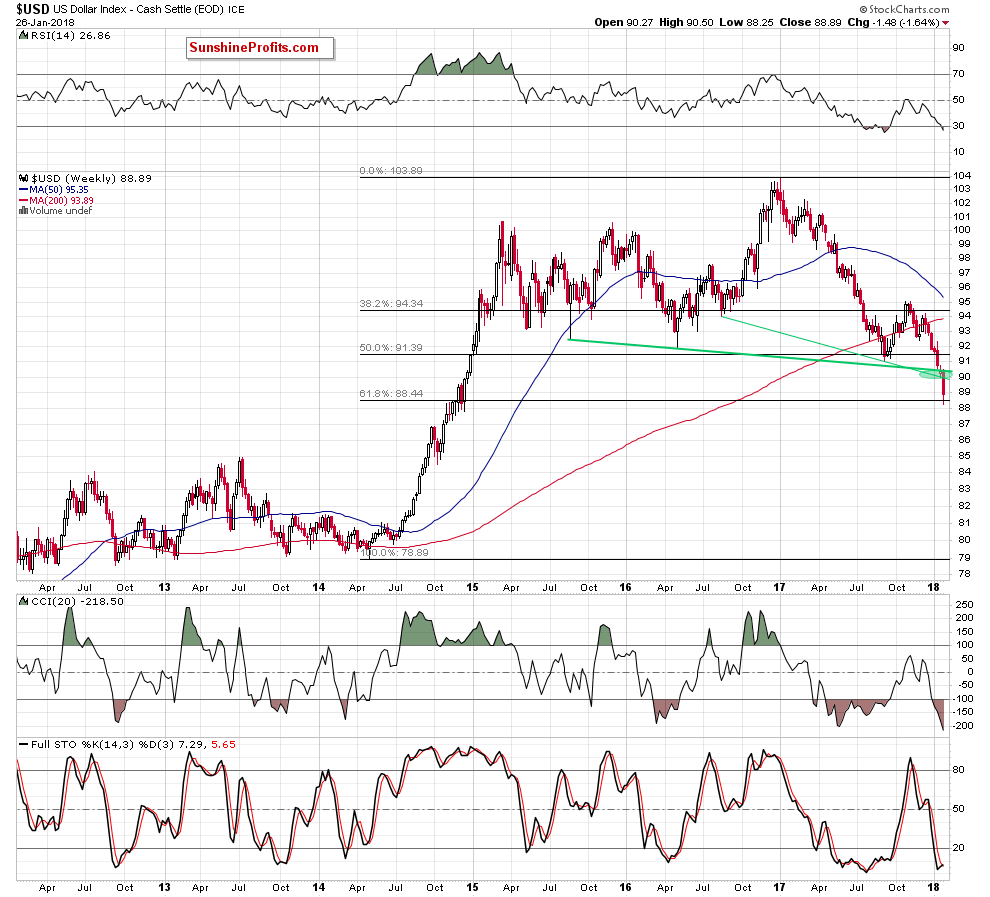
(...) On the weekly chart, we also see that the 61.8% Fibonacci retracement triggered a rebound and created a pro bullish candlestick, which increases the probability of further improvement in the coming week.
How high could the USD Index go? In our opinion, the first upside target will be the previously-broken lower border of the black declining trend channel. If the buyers manage to invalidate the breakdown under this line, the way to higher levels will be likely open.
Trading position (short-term; our opinion): Short positions (with a stop-loss order at 1.2677 and the initial downside target at 1.2186) are justified from the risk/reward perspective. We will keep you informed should anything change, or should we see a confirmation/invalidation of the above.
GBP/USD
Quoting our last commentary on this currency pair:
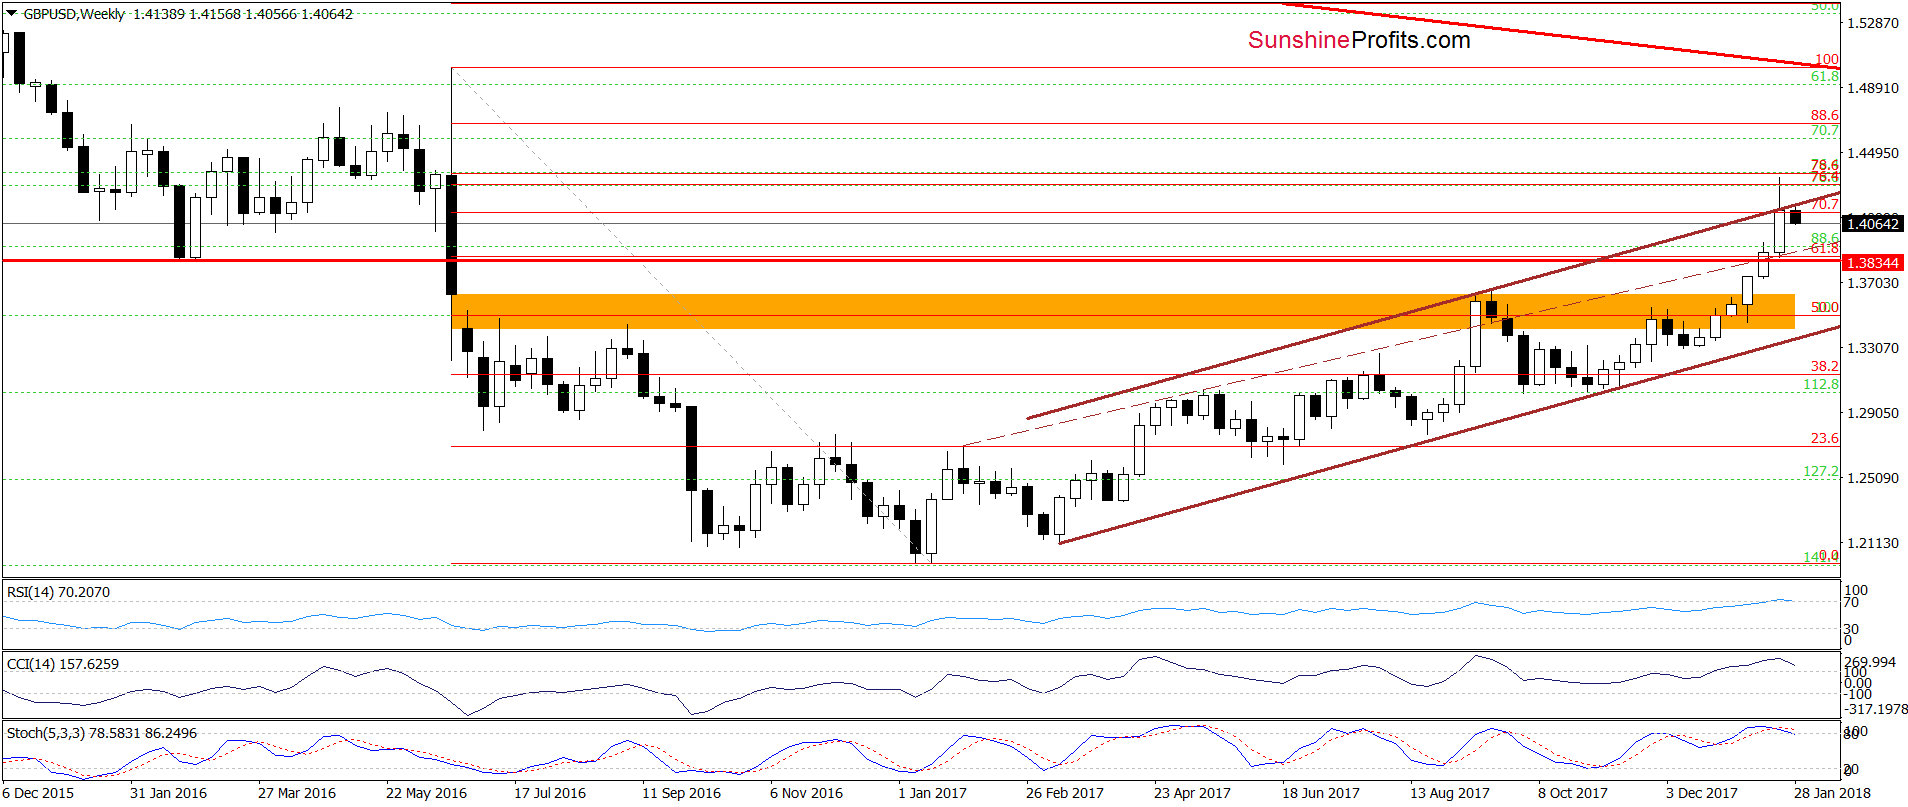
(…) the breakout above the upper line of the brown rising trend channel encouraged currency bulls to act. As a result, they took GBP/USD to the resistance area created by the 76.4% and 78.6% Fibonacci retracements.
What does it mean for the exchange rate? In our opinion, as long as this resistance area remains in the cards, the way to higher levels is blocked. Additionally, the current position of the indicators and the technical picture of the USD Index suggest that reversal and lower values of the exchange rate may be just around the corner.
From todays point of view, we see that the situation developed in line with the above scenario and GBP/USD closed the last week under the previously-broken upper border of the brown rising trend channel. This bearish signal triggered further deterioration earlier today, which suggests that the way to lower levels could be open.
Is it really so bearish as it looks at the first sight? Let’s take a look at the daily chart.
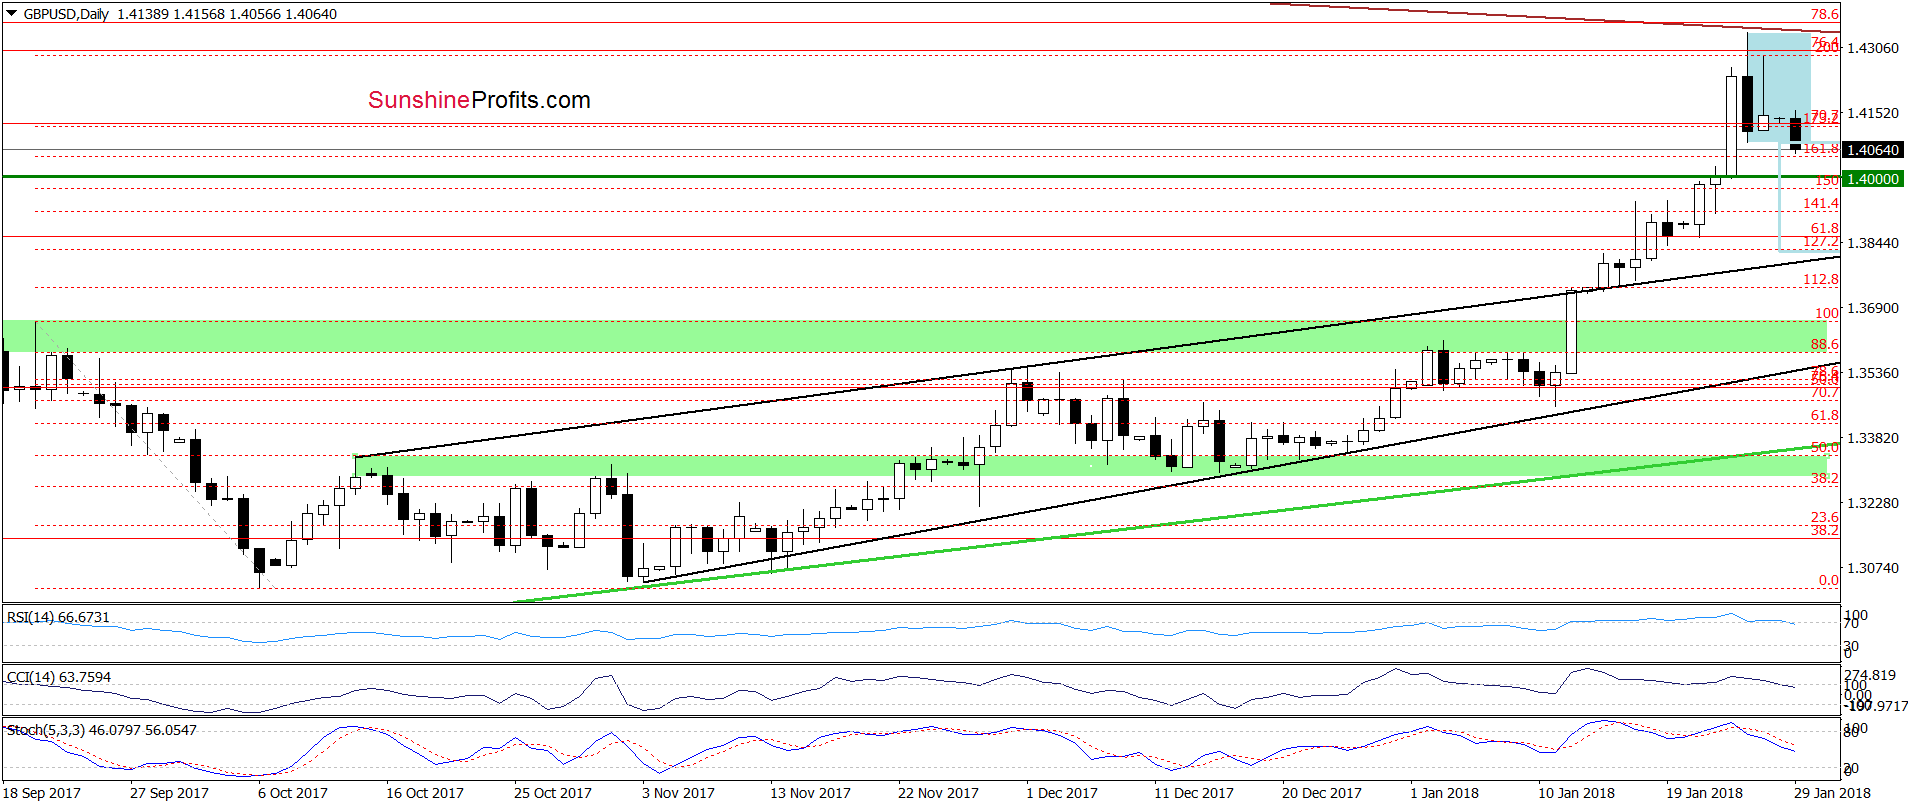
From this perspective, we see that the recent decline took GBP/USD not only under the upper line of the above-mentioned trend channel, but also resulted in a breakdown below the lower border of the blue consolidation. On top of that, currency bears created a shooting star on the daily chart, which together with the sell signals generated by the indicators indicate lower values of the exchange rate.
How low could GBP/USD go in the coming days? Considering the breakdown below the blue consolidation, we think that we’ll see a drop to at least 1.3820, where the size of the downward move will correspond to the height of the formation. In this area is also the previously-broken upper line of the black rising trend channel, which could pause declines. Nevertheless, we will continue to monitor the market in the coming days and if anything invalidates our outlook we will send you an additional message.
Meanwhile, taking into account all the above, we think that opening short positions is justified from the risk/reward perspective.
Finishing today’s commentary on this currency pair, we would like to add something more about the shooting star pattern for those who are at the beginning of their investment adventure, who do not know much about Japanese candlesticks or simply don’t remember this formation.
The shooting star is one of the most popular and characteristic one-candle formation of the reversal of the upward trend, announcing declines. It has a long upper shadow, a small body (in our case it is white, but it also can be black) and a small lower shadow. The upper shadow should be larger than the body from 2 to 3 times and there are cases that there is no lower shadow or it is barely visible – just like on Friday.
What is the psychological overtone of this formation? Simply speaking, it is a sign of a sudden weakening of the power of demand. The place where the price reached was the level of profit taking after an uptrend and currency bulls didn’t give up here without a reason. What could be the reason in our case? We think it was the above-mentioned resistance area created by the Fibonacci retracements (marked on the weekly chart).
Investors who closed their positions after an intraday high caused that the market reversed and declined. Those who had long positions get a clear signal that the price of the exchange rate reached a significant resistance level.
Such thinking usually causes an avalanche closing position and opening opposing ones, which accelerates declines in the following days. At this point, it is worth noting that if the body of the shooting star is black, it even more affects the imagination of investors. Why? Because, it indicates that the bears took control in the period represented by the candlestick.
Returning, however, to Friday session… as you can see on the daily chart, this bearish formation initially fulfilled its role and triggered further deterioration earlier today, increasing the probability of a bigger move to the downside in the coming week.
Trading position (short-term; our opinion): Short (with a stop-loss order at 1.4432 and the initial downside target at 1.3820) are justified from the risk/reward perspective. We will keep you informed should anything change, or should we see a confirmation/invalidation of the above.
USD/JPY
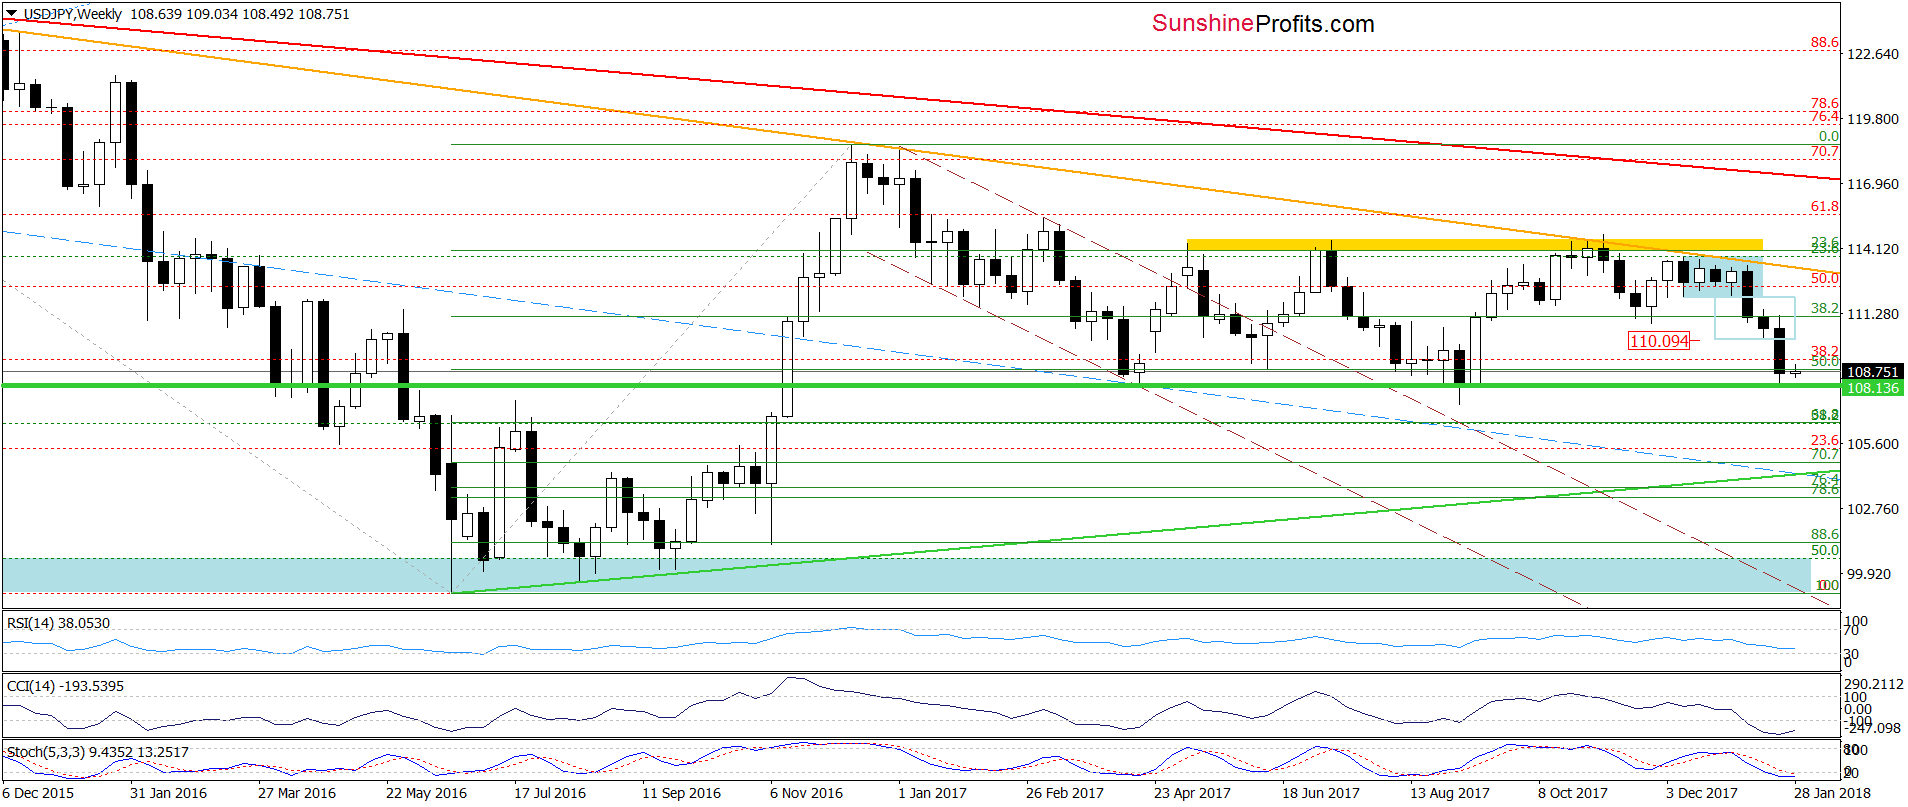
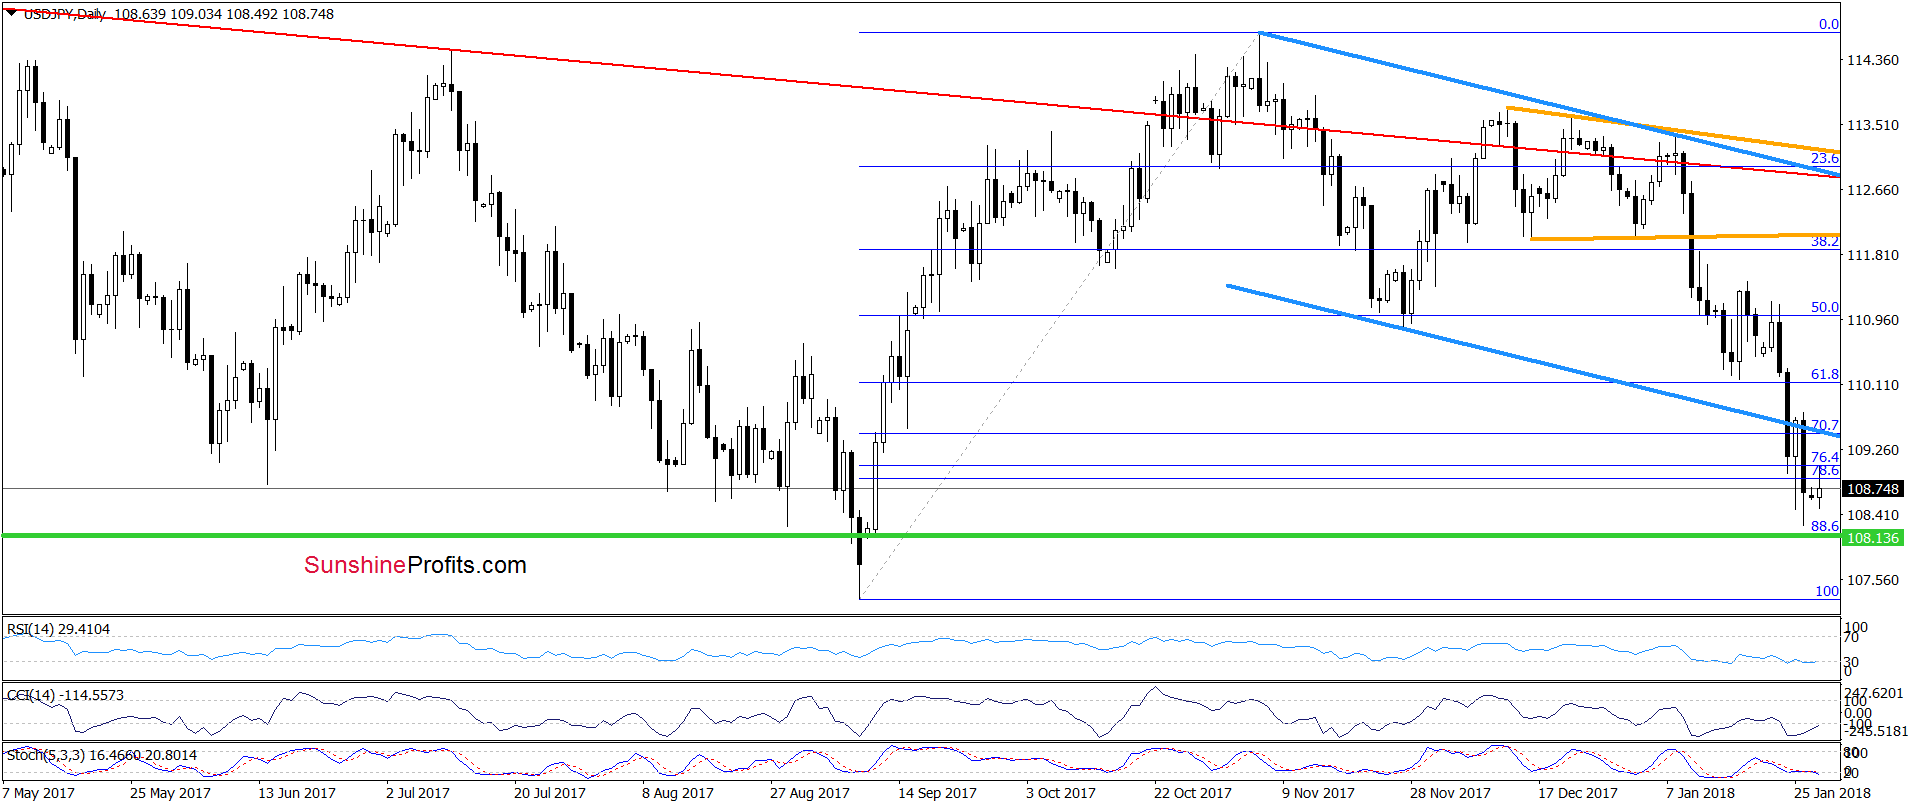
In our alert posted on Thursday, we wrote:
(…) currency bears not only took the exchange rate to our downside targets, but also managed to push the pair below it, which suggests that we may see further deterioration and a test of the green horizontal line based on the mid-April and September 2017 lows in the coming days.
Looking at the above charts, we see that USD/JPY almost touched our downside target and then rebounded, which together with the current position of daily and weekly indicators suggests higher values of the exchange rate.
Nevertheless, in our opinion, a bigger move to the upside will be more likely and reliable if the pair invalidates the breakdown under the lower border of the blue declining trend channel. If we see such price action, we will likely open long positions.
Trading position (short-term; our opinion): No positions are justified from the risk/reward perspective now. We will keep you informed should anything change, or should we see a confirmation/invalidation of the above.
Thank you.
Nadia Simmons
Forex & Oil Trading Strategist
Przemyslaw Radomski, CFA
Founder, Editor-in-chief, Gold & Silver Fund Manager
Gold & Silver Trading Alerts
Forex Trading Alerts
Oil Investment Updates
Oil Trading Alerts

