

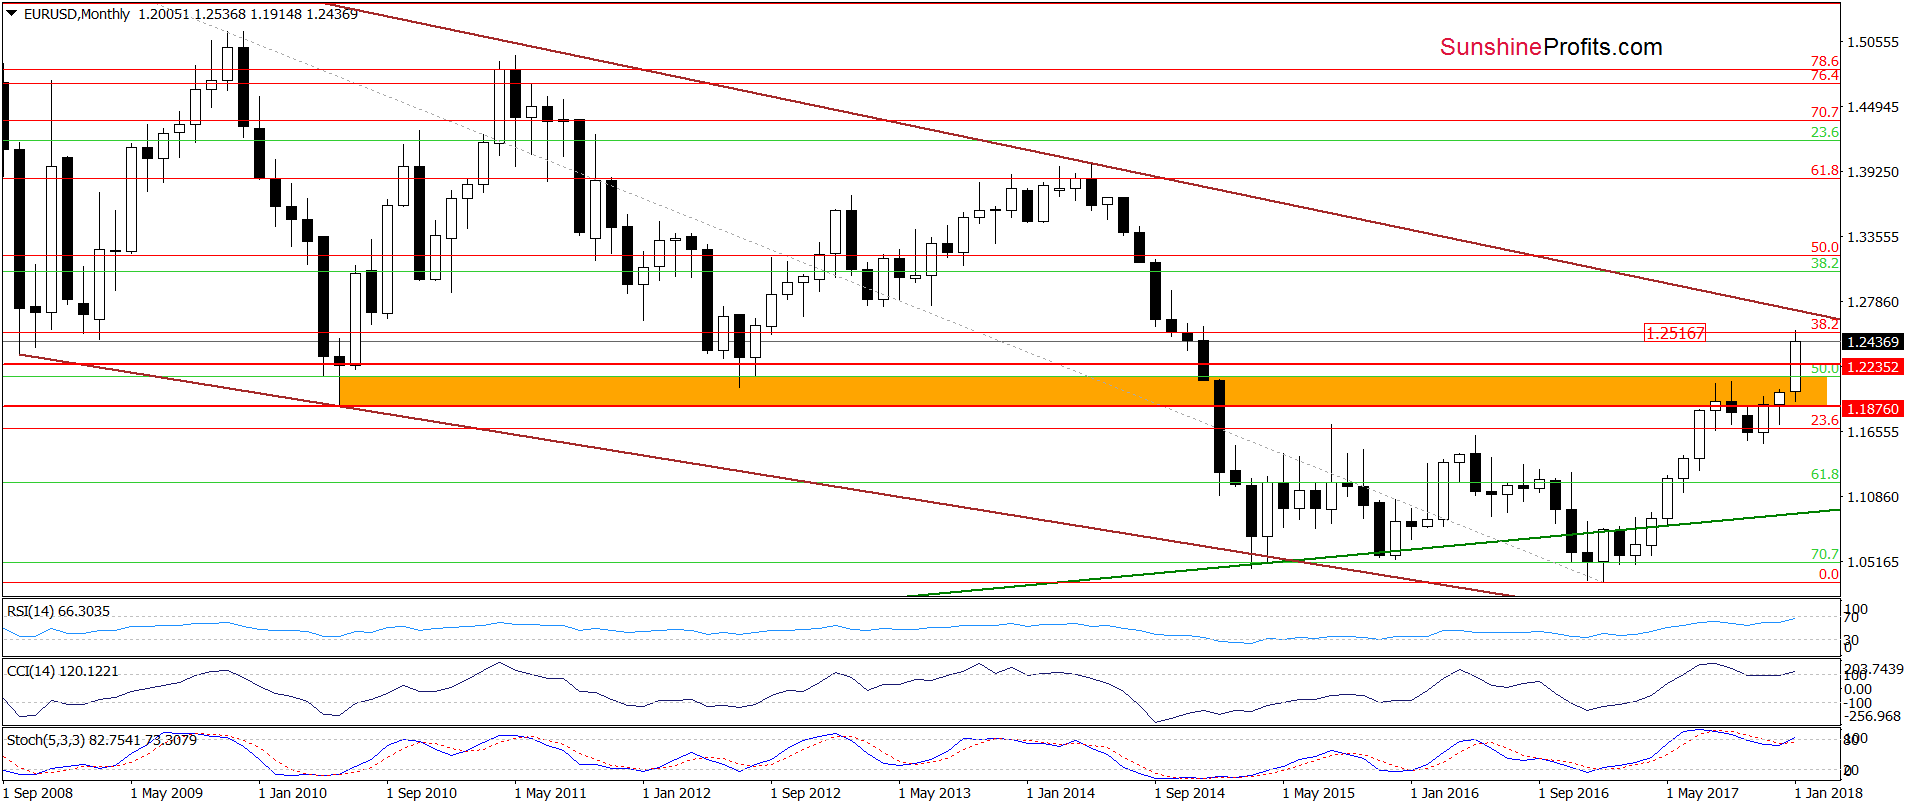
Yesterday, the euro increased against the greenback once again, which resulted in a climb to the 38.2% Fibonacci retracement. Is it enough for currency bulls or higher values of EUR/USD are still ahead of us?
In our opinion the following forex trading positions are justified - summary:
- EUR/USD: none
- GBP/USD: none
- USD/JPY: none
- USD/CAD: none
- USD/CHF: none
- AUD/USD: short (a stop-loss order at 0.8178; the initial downside target at 0.7730)
EUR/USD
In our Forex Trading Alert posted on January 18, we wrote the following:
(…) What could happen at the same time with EUR/USD?
We think that such decline in the greenback could push the exchange rate to the 38.2% Fibonacci retracement based on the entire 2008-2017 downward move.
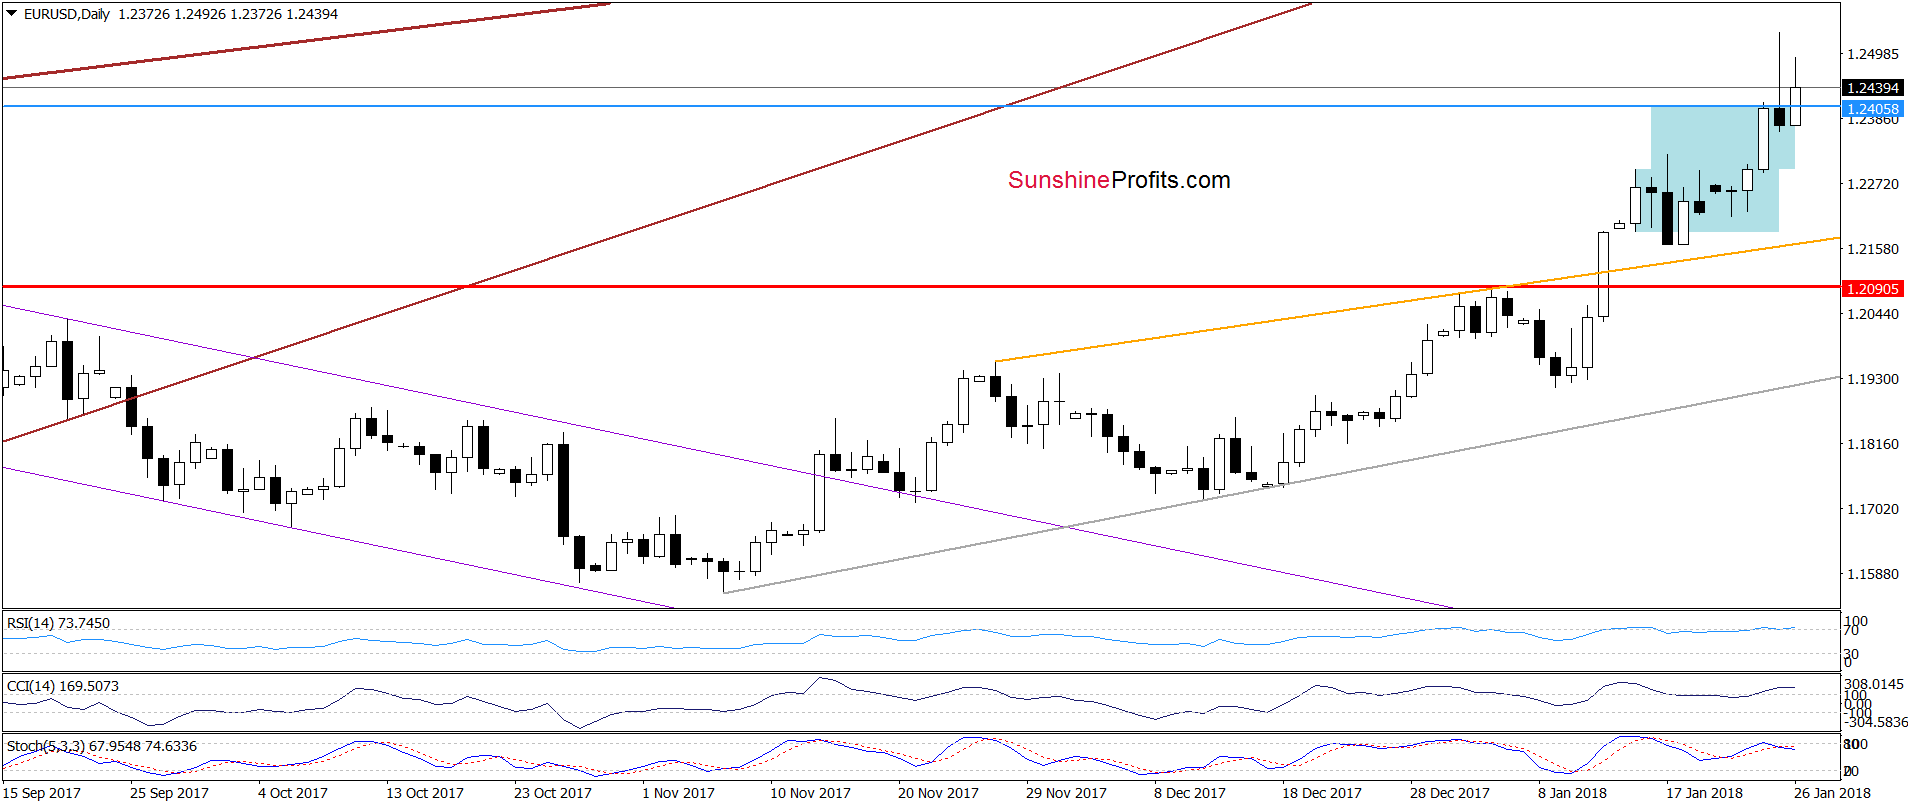
From today’s point of view, we see that the situation developed in line with the above scenario and the exchange rate increased to our upside target yesterday. As you see on the daily chart, this important resistance triggered a quite sharp pullback, which erased all Thursday’s gains. As a result, currency bears created a shooting star on the very short-term chart (a bearish candlestick formation), which doesn’t bode well for currency bulls.
Earlier today, the buyers tried to push the pair higher, but during the pre-session trading their efforts were unsuccessful, which suggests that we may see another bearish candle on the daily chart. If we see such price action, we’ll consider opening short positions.
At this point it is also worth noting that the pro bearish scenario is also reinforced by the position of the daily indicators and the current situation in the USD Index. Let’s take a look at the charts below and recall the quote from our alert published on Wednesday.
Two days ago, we wrote:
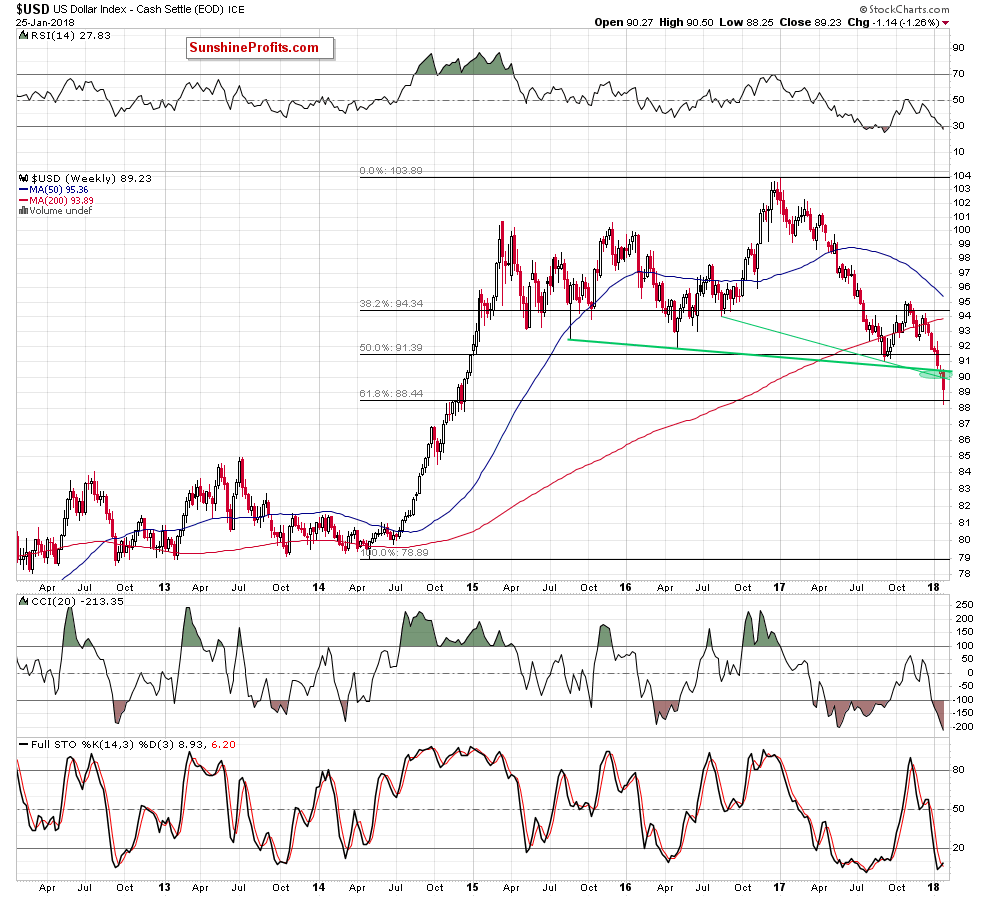
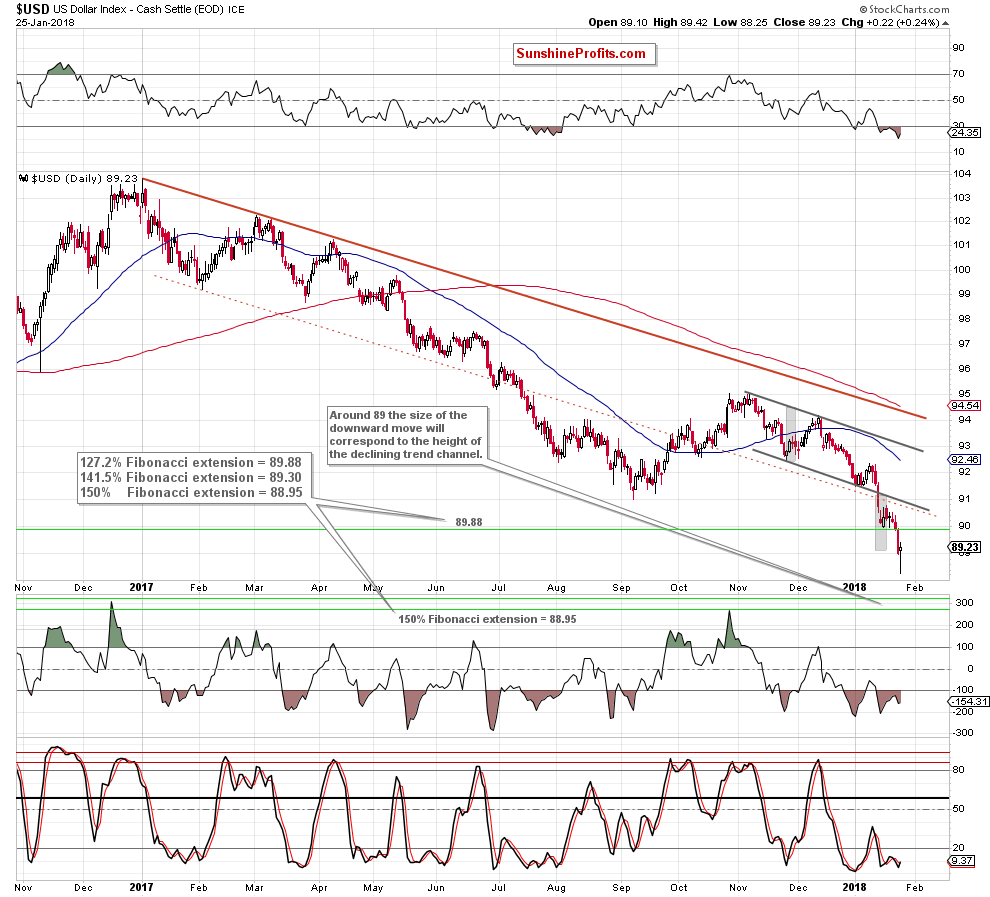
(…) if the support area around 89 doesn’t stop declines in the USD Index, the next downside target for the bears will be likely the 61.8% Fibonacci retracement (around 88.44) based on the entire 2014-2017 upward move).
As you see on the above chart, currency bears took the index to our downside target yesterday. On the weekly chart, we also see that the 61.8% Fibonacci retracement triggered a rebound and created a pro bullish candlestick, which increases the probability of further improvement in the coming week.
How high could the USD Index go? In our opinion, the first upside target will be the previously-broken lower border of the black declining trend channel. If the buyers manage to invalidate the breakdown under this line, the way to higher levels will be likely open.
Trading position (short-term; our opinion): No positions are justified from the risk/reward perspective. We will keep you informed should anything change, or should we see a confirmation/invalidation of the above.
GBP/USD
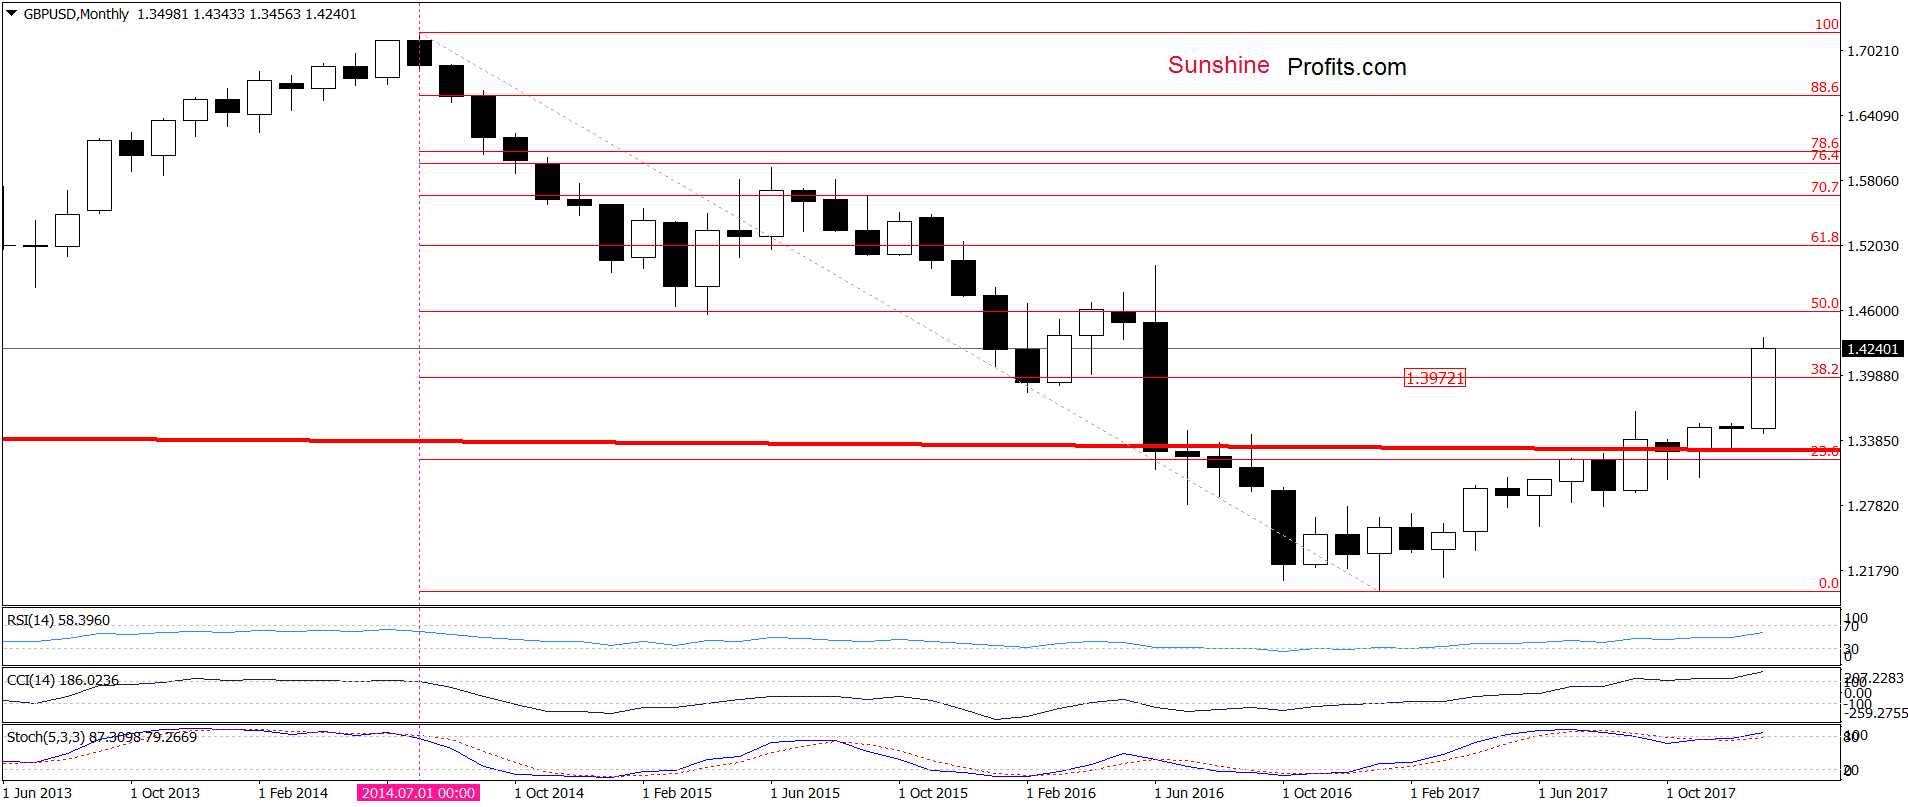
The first thing that catches the eye on the long-term chart is a breakout above the 38.2% Fibonacci retracement, which is a bullish signal. But will we see a test of the next retracement in the coming week? Let’s take a look at the chart below and check where the nearest resistances are.
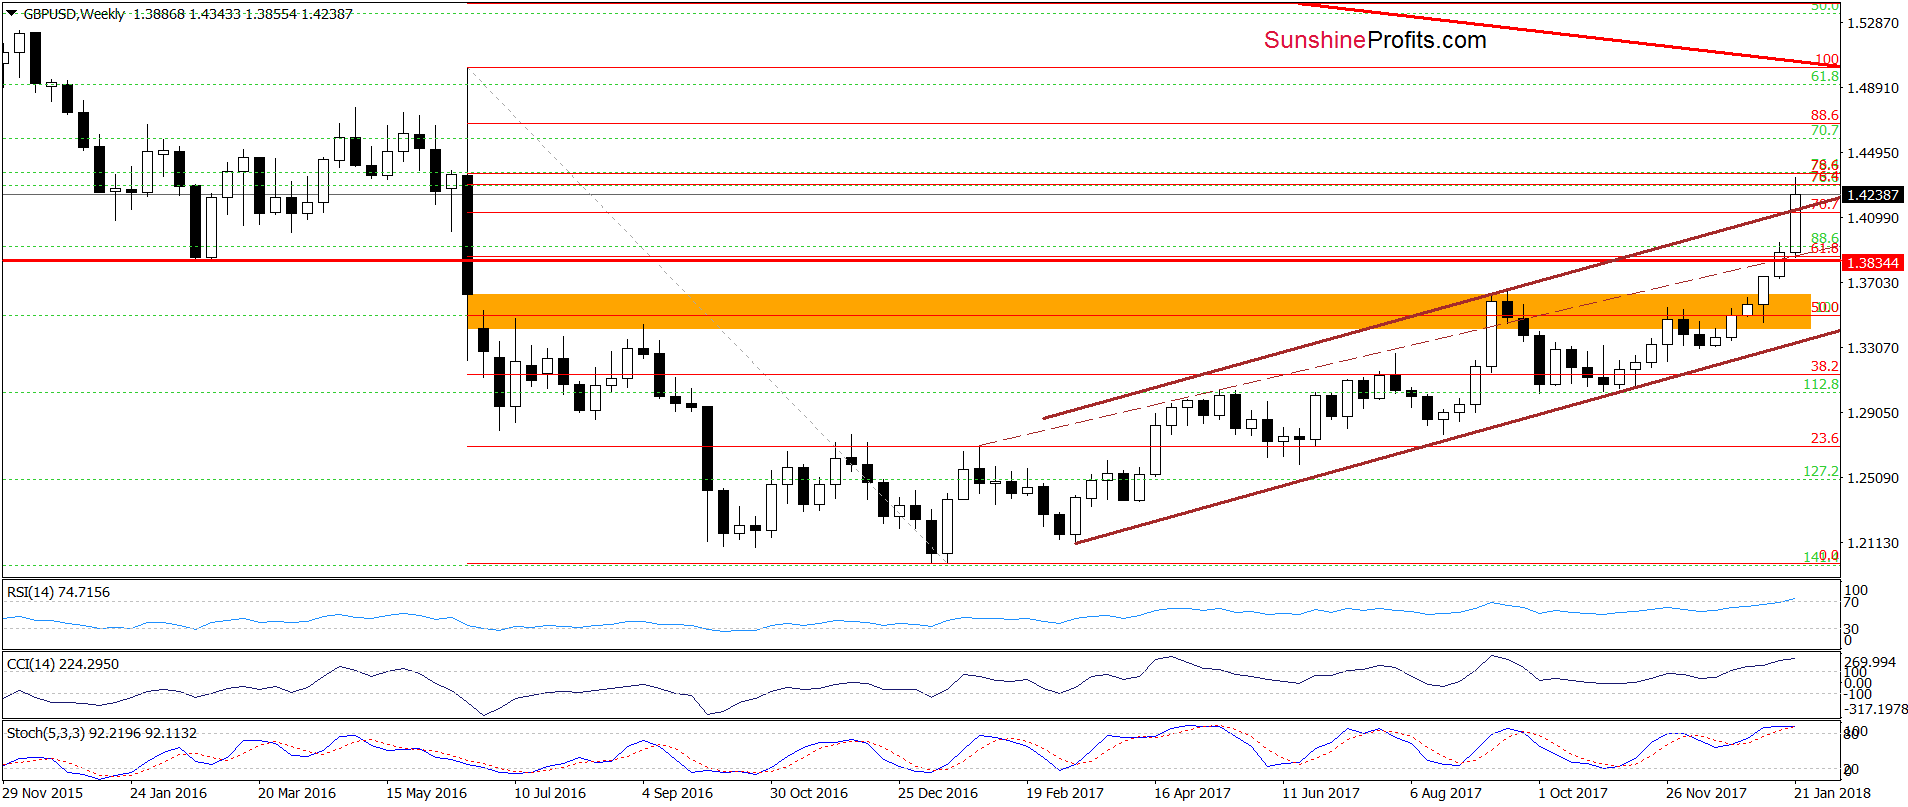
From this perspective, we see that the breakout above the upper line of the brown rising trend channel encouraged currency bulls to act. As a result, they took GBP/USD to the resistance area created by the 76.4% and 78.6% Fibonacci retracements.
What does it mean for the exchange rate? In our opinion, as long as this resistance area remains in the cards, the way to higher levels is blocked. Additionally, the current position of the indicators and the technical picture of the USD Index suggest that reversal and lower values of the exchange rate may be just around the corner.
Therefore, if we see any reliable bearish signals, we’ll consider opening short positions in the coming week.
Trading position (short-term; our opinion): no positions are justified from the risk/reward perspective. We will keep you informed should anything change, or should we see a confirmation/invalidation of the above.
USD/CHF
Quoting our last commentary on this currency pair:
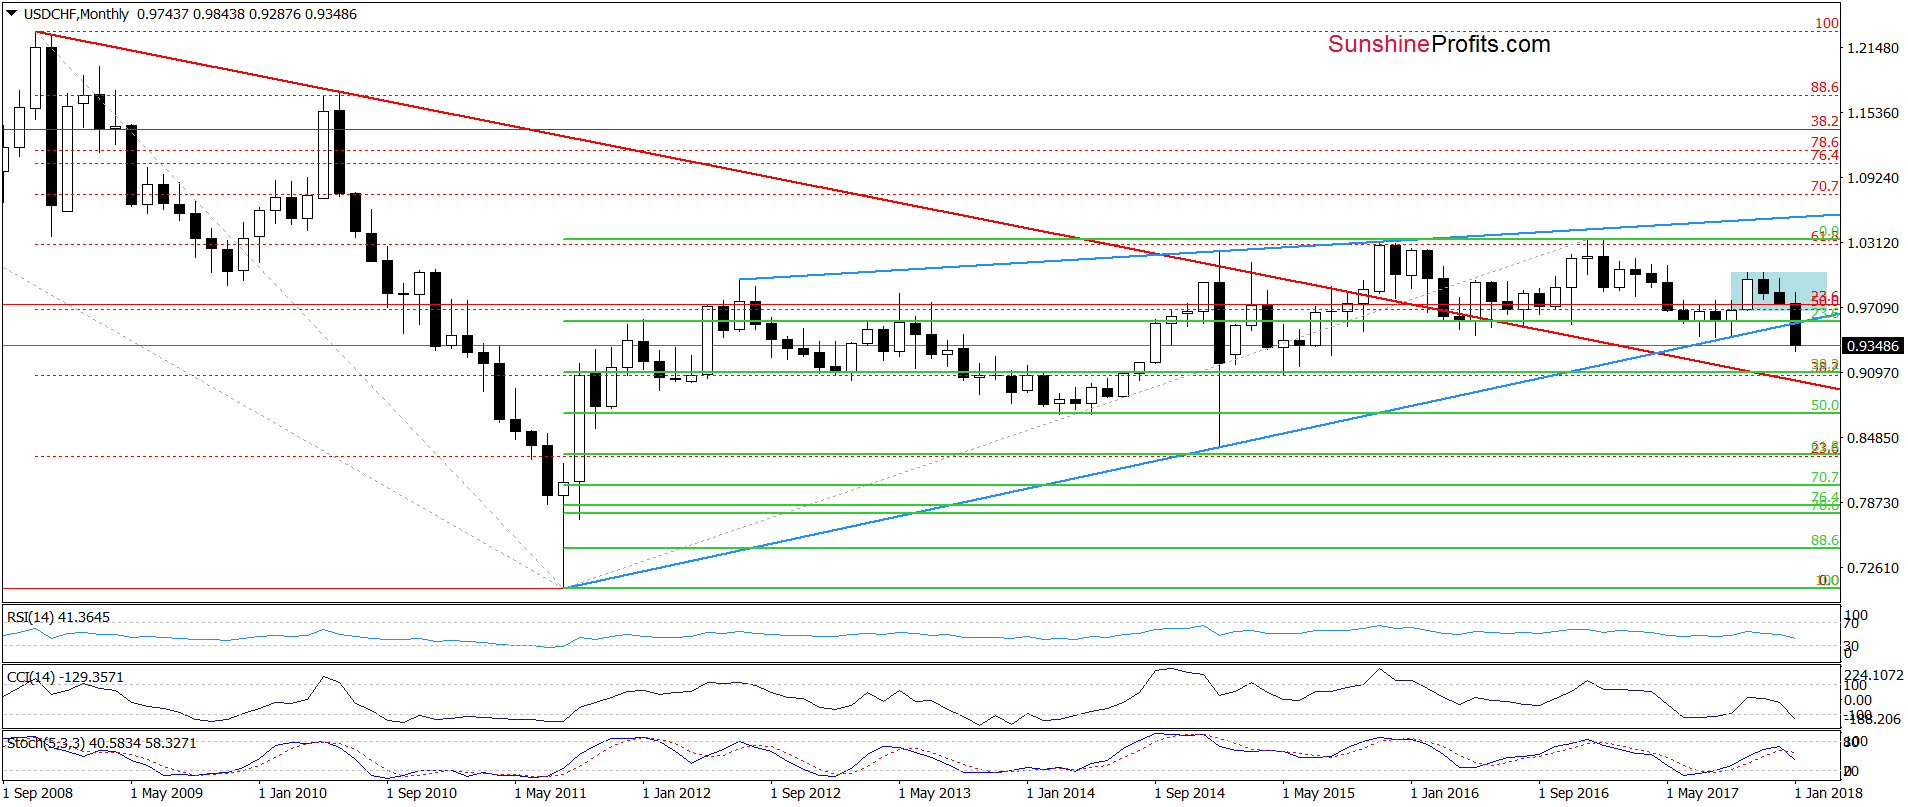
(…) USD/CHF slipped slightly below the long-term blue support line based on the previous important lows, which doesn’t bode well for currency bulls – especially when we factor in the sell signal generated by the Stochastic Oscillator.
Looking at the long-term chart, we see that currency bears extended losses as we had expected. Thanks to the recent decline, the exchange rate broke below the July, August and September lows, which suggests that we could see a drop even to the 38.2% Fibonacci retracement (based on the entire 2011-2016 upward move) in the coming month(s).
But ale there any supports that could stop currency bears? Before we answer this question, let’s recall the quote from our Wednesday’s alert:
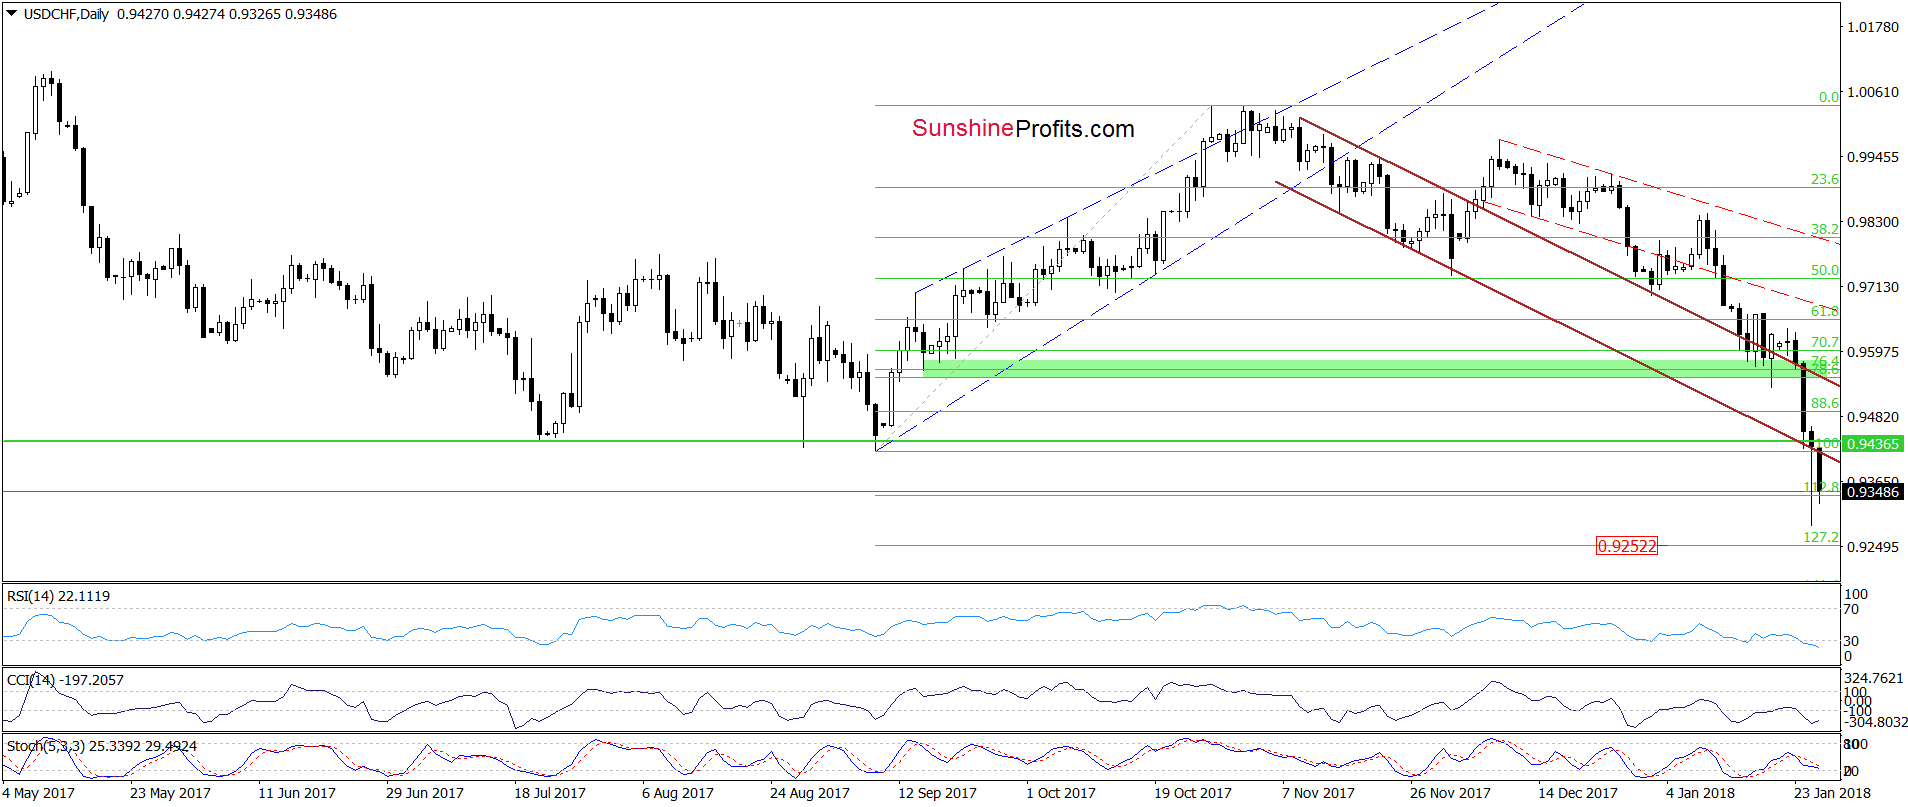
(…) the exchange rate came back under the above-mentioned line and slipped under the green support zone, which opened the way to the lower border of the brown declining trend channel, which currently intersects the support area created by the recent lows.
The pro bearish scenario is also reinforced by the current position of the indicators – the CCI invalidated the buy signal, while the Stochastic Oscillator generated the sell signal, supporting lower values of USD/CHF in the coming days.
On the above chart, we clearly see that USD/CHF not only slipped to our downside target, but also declined below it, which suggests that we could see a test of the 127.2% Fibonacci extension (around 0.9252), which serves as the nearest support at the moment of writing these words.
Trading position (short-term; our opinion): No positions are justified from the risk/reward perspective at the moment. We will keep you informed should anything change, or should we see a confirmation/invalidation of the above.
Thank you.
Nadia Simmons
Forex & Oil Trading Strategist
Przemyslaw Radomski, CFA
Founder, Editor-in-chief, Gold & Silver Fund Manager
Gold & Silver Trading Alerts
Forex Trading Alerts
Oil Investment Updates
Oil Trading Alerts

