

Although the yen dropped against the greenback yesterday after the Bank of Japan left its monetary policy unchanged, the Japanese currency rebounded earlier today as the USD Index gave up some gains. Will we see USD/JPY at lower levels in the coming days?
In our opinion the following forex trading positions are justified - summary:
EUR/USD
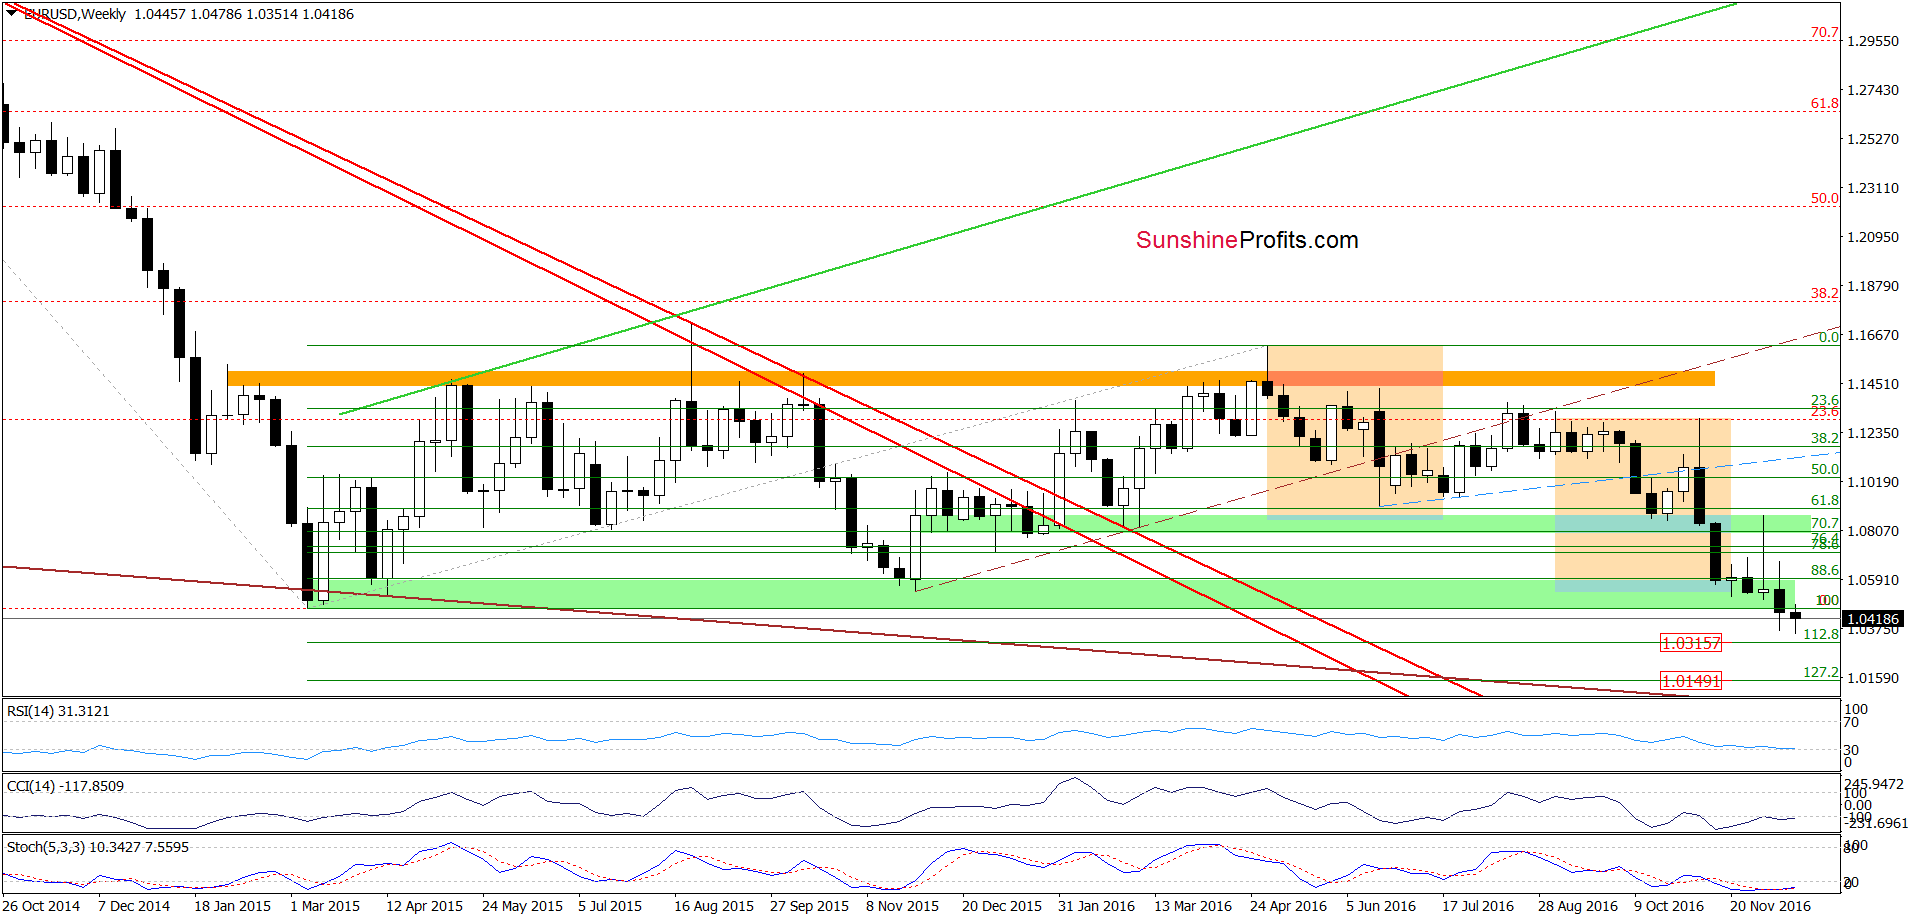
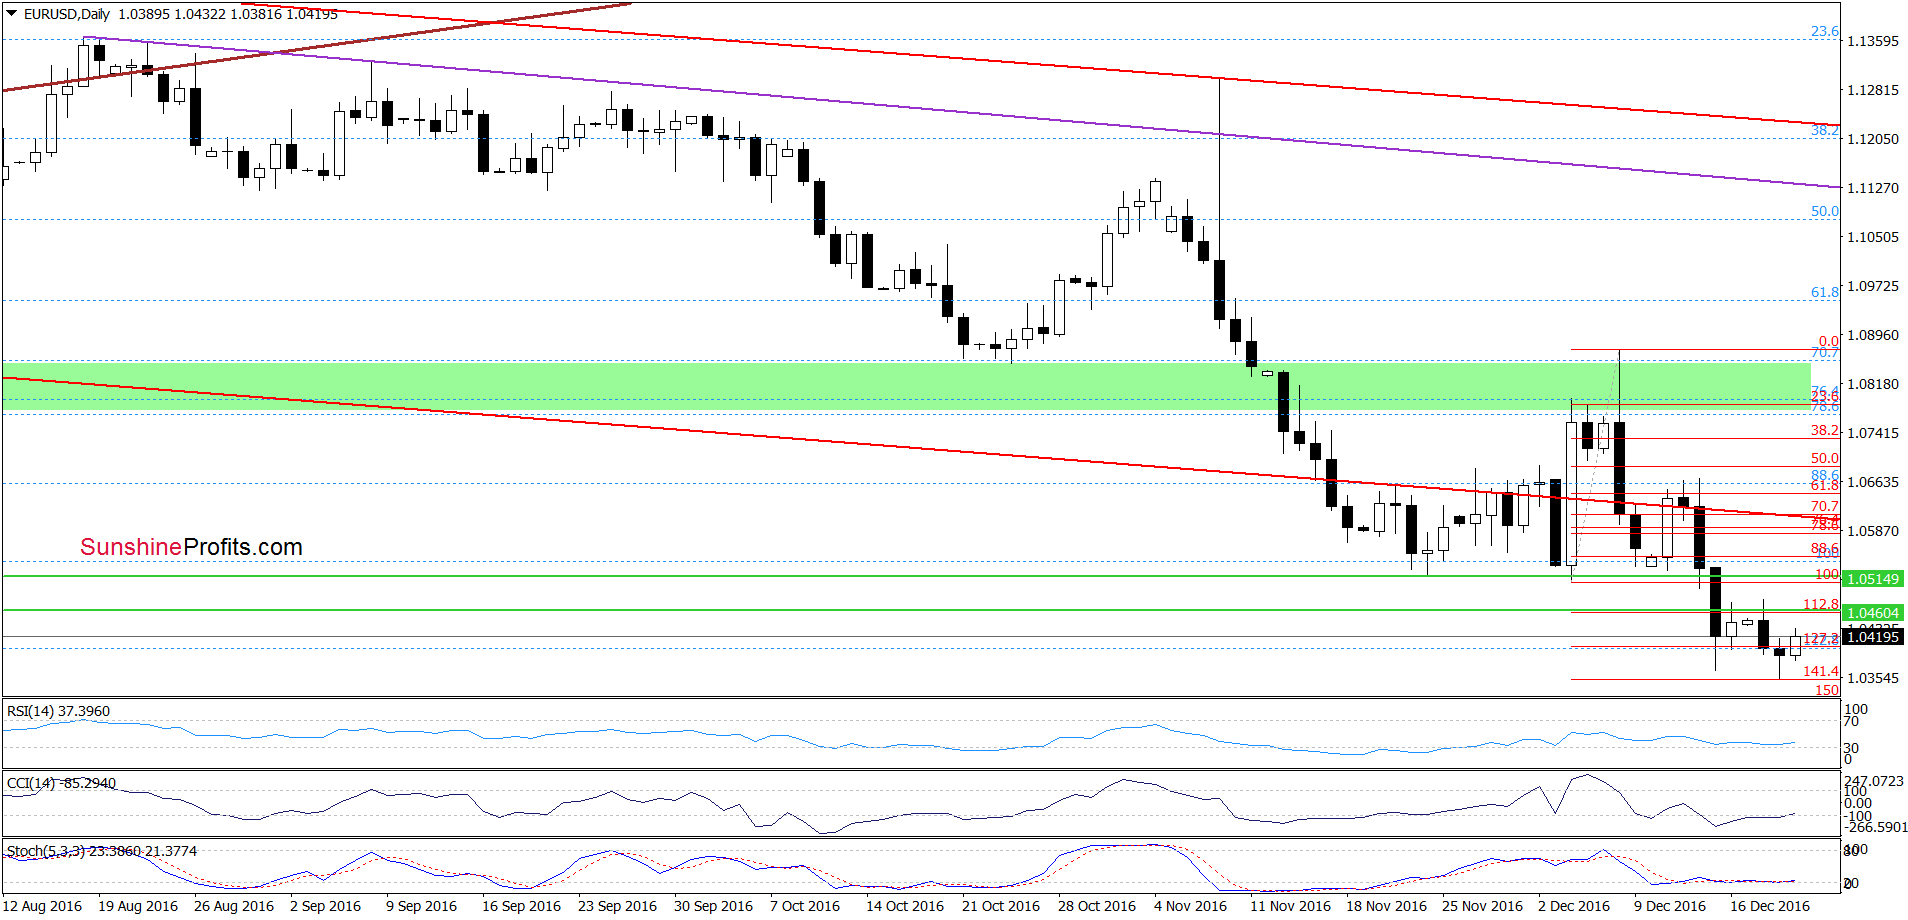
On the daily chart, we see that EUR/USD rebounded earlier today, which in combination with buy signals generated by the indicators suggests further improvement. However, in our opinion, as long as there won’t be an invalidation of the breakdown under the green support zone marked on the weekly chart (created by the Apr and Nov 2015 lows) another bigger move to the upside is not likely to be seen and another attempt to move lower can’t be ruled out.
If we see a decline, downside targets from our previous alert would be in play:
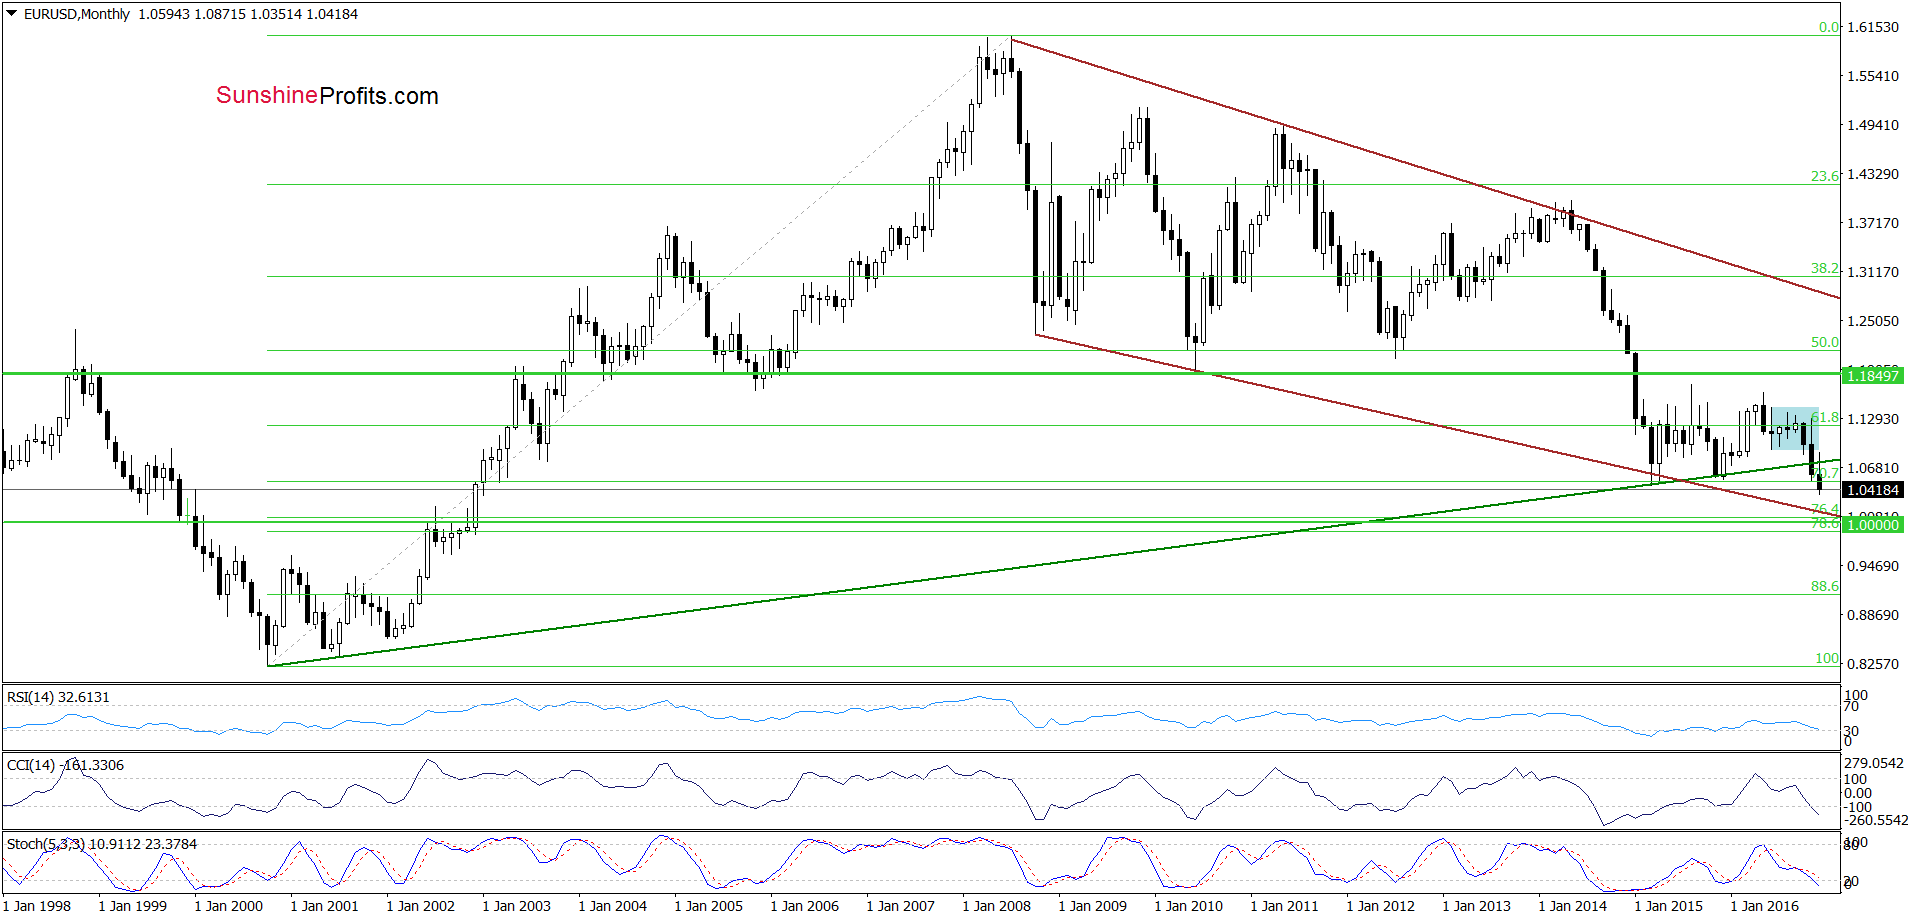
(…) a verification of a breakdown under the previously-broken Nov and early-Dec lows (…) suggests further deterioration to the 112.8%, 127.2% Fibonacci extension (both marked on the weekly chart) or even a test of the lower border of the long-term brown declining trend channel and the barrier of 1.0000 seen on the long-term chart below.
Very short-term outlook: mixed
Short-term outlook: mixed
MT outlook: mixed
LT outlook: mixed
Trading position (short-term; our opinion): No positions are justified from the risk/reward perspective. We will keep you informed should anything change, or should we see a confirmation/invalidation of the above.
USD/JPY
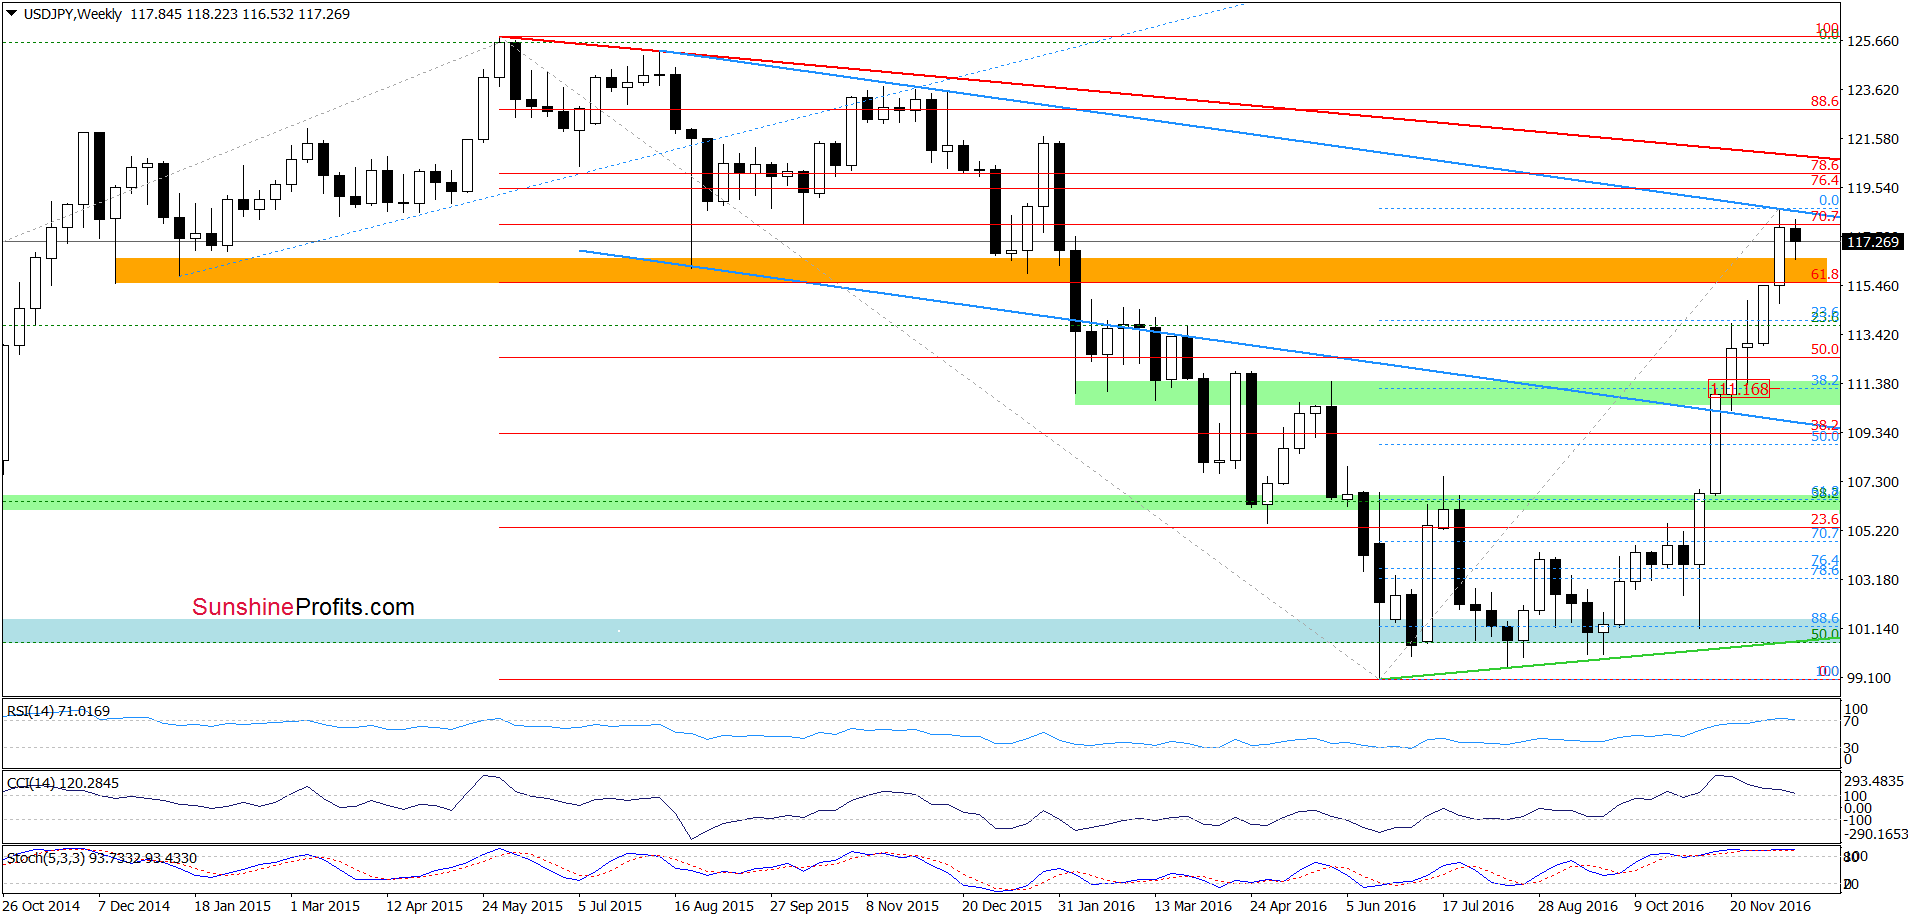
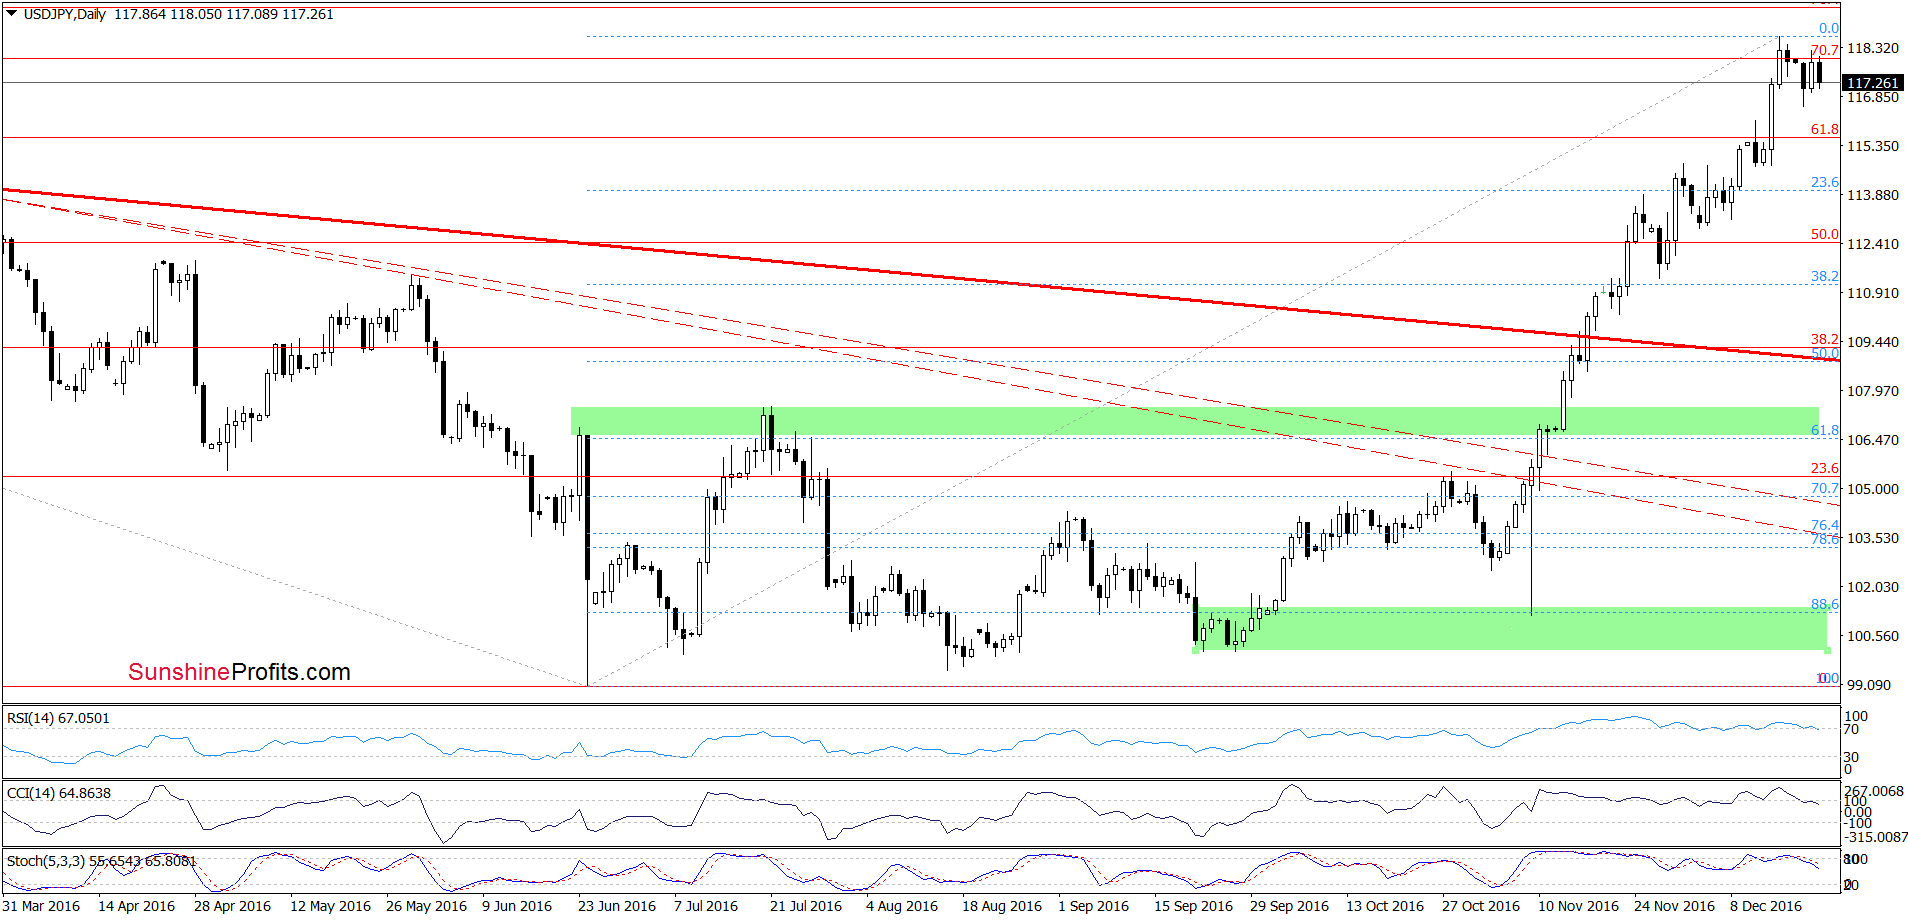
Looking at the daily chart, we see that although USD/JPY moved higher yesterday, the pair reversed and declined earlier today, erasing Tuesday’s gains, which suggests that what we wrote on Monday is up-to-date also today:
(…) USD/JPY (…) broke above the orange resistance zone, which took the exchange rate to the upper border of the blue declining trend channel. As you see, this area is also reinforced by the 70.7% Fibonacci retracement, which triggered a pullback earlier today. Additionally, weekly and daily and weekly indicators are very close to generating sell signals, which increases the probability of further declines in the coming days. Nevertheless, in our opinion, such price action would be more likely if the exchange rate declines below the orange zone (marked on the weekly chart), which serves now as the nearest support. If this area is broken, USD/JPY could drop to around 111.17, where the 38.2% Fibonacci retracement and the green support zone are.
Very short-term outlook: mixed with bearish bias
Short-term outlook: mixed
MT outlook: mixed
LT outlook: mixed
Trading position (short-term; our opinion): No positions are justified from the risk/reward perspective. We will keep you informed should anything change, or should we see a confirmation/invalidation of the above.
USD/CAD
On Friday, we wrote:
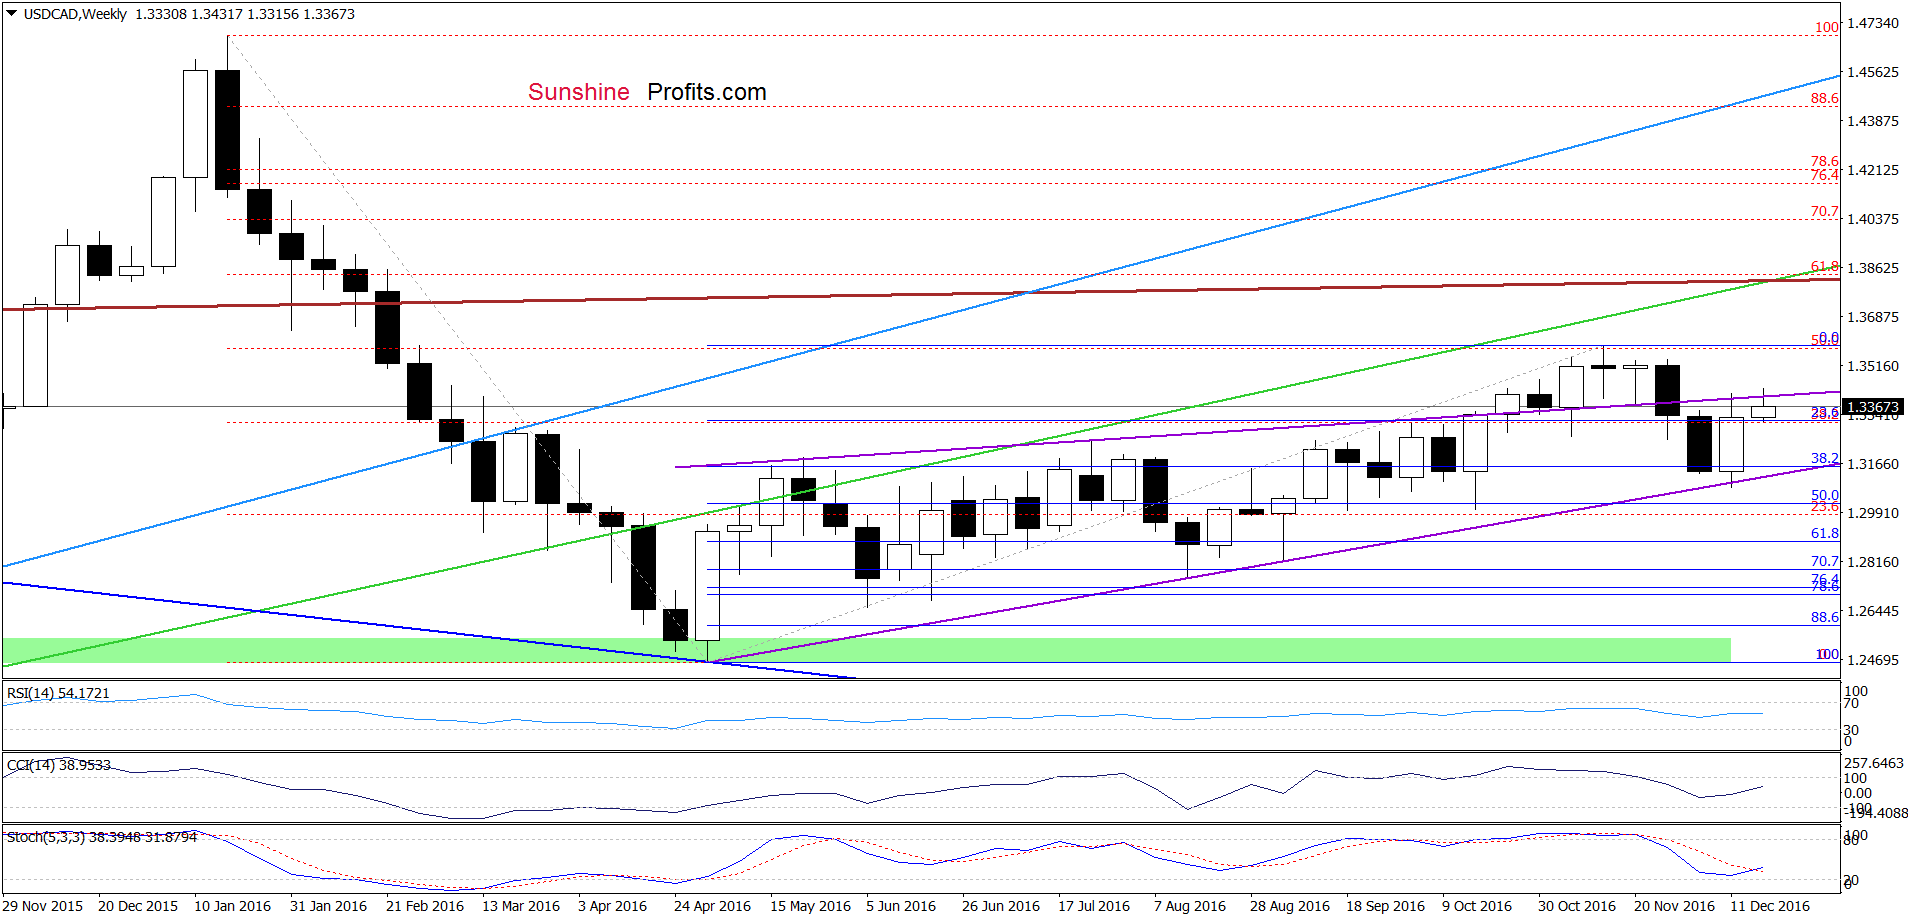
(…) the green support zone triggered a sharp rebound, which took the pair not only above the orange resistance zone, but also the lower border of the purple declining trend channel (seen on the daily chart). In this way, USD/CAD invalidated earlier breakdowns, which is a bullish development that suggests further improvement and a test of the upper line of the blue rising trend channel and the upper line of the purple trend channel (we marked this area with an orange ellipse) in the coming days.
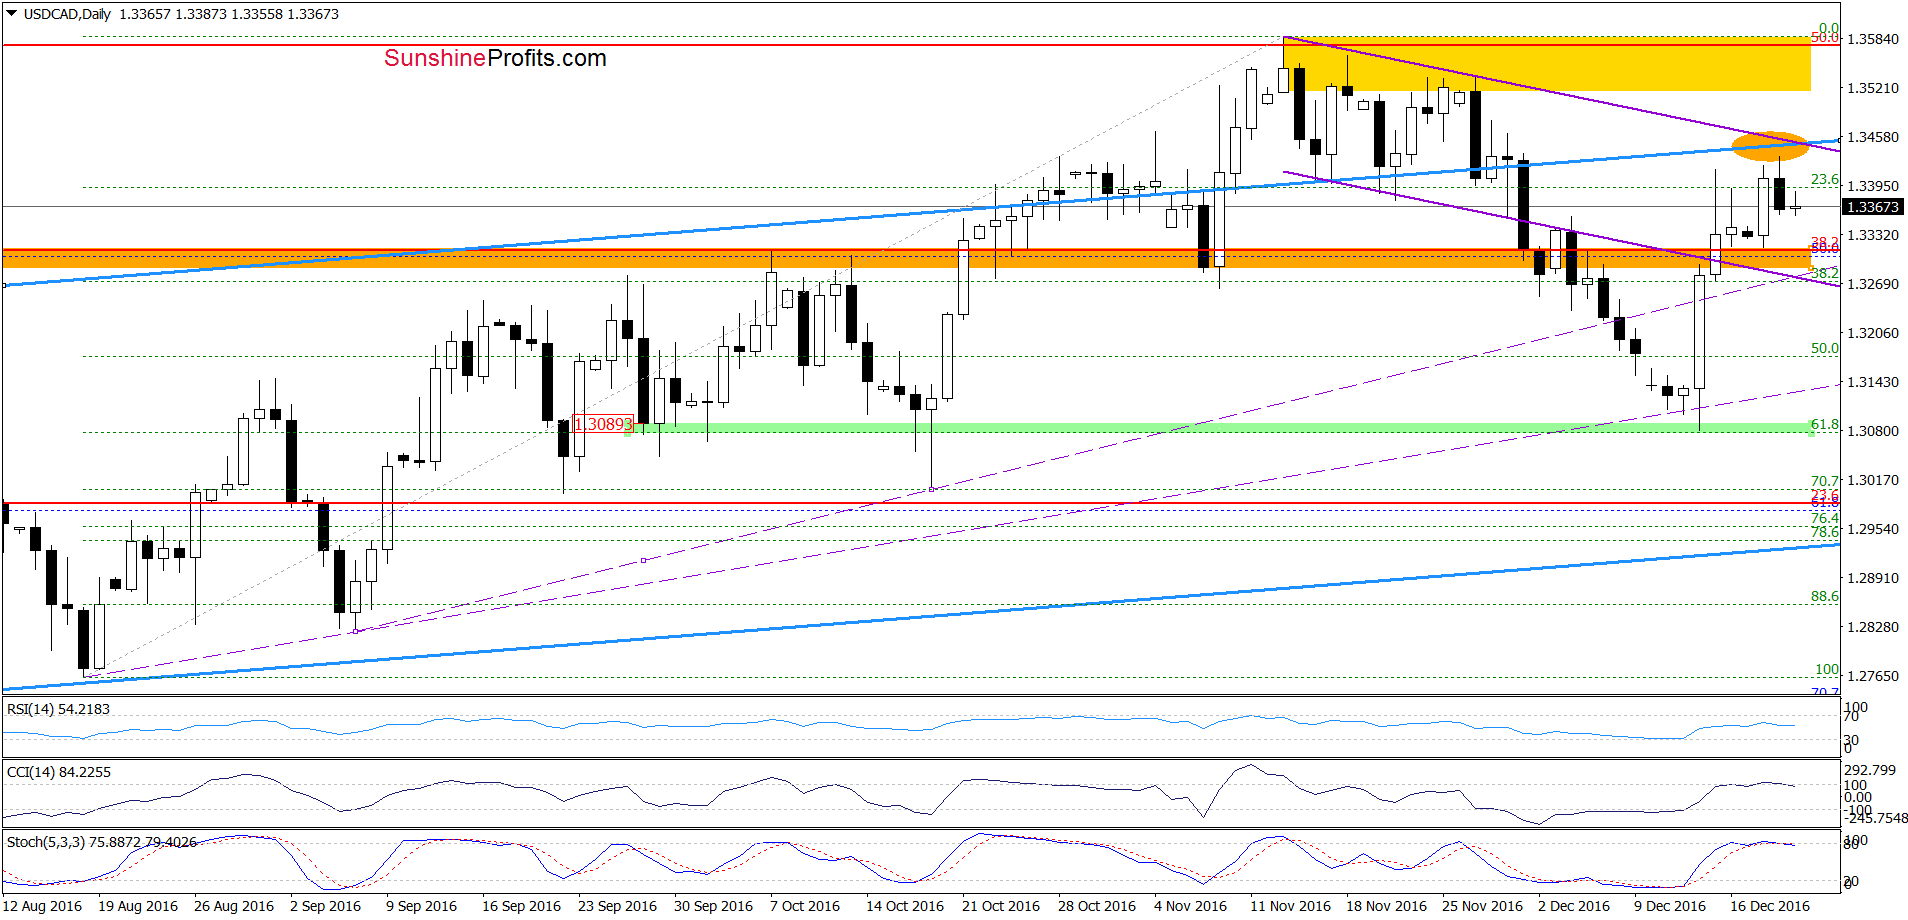
From today’s point of view, we see that USD/CAD moved higher as we had expected. With this increase, the exchange rate approached the orange area and re-tested the upper line of the purple trend channel. However, currency bulls didn’t manage to hold gained levels, which resulted in a pullback and another invalidation of a breakout above the purple line. Such price action in combination with sell signals generated by the daily indicators and the proximity to the orange resistance area suggest further deterioration in the coming days. If this is the case and USD/CAD extends declines, the initial downside target would be the lower border of the purple declining trend channel (currently around 1.3276).
Very short-term outlook: mixed with bearish bias
Short-term outlook: mixed
MT outlook: mixed
LT outlook: mixed
Trading position (short-term; our opinion): No positions are justified from the risk/reward perspective. We will keep you informed should anything change, or should we see a confirmation/invalidation of the above.
Thank you.
Nadia Simmons
Forex & Oil Trading Strategist
Przemyslaw Radomski, CFA
Founder, Editor-in-chief, Gold & Silver Fund Manager
Gold & Silver Trading Alerts
Forex Trading Alerts
Oil Investment Updates
Oil Trading Alerts

