

Although today’s data showed that U.S. building permits dropped 4.7% in the previous month, the greenback remains close to multi-month highs as the Federal Reserve’s decision to raise interest rates continues to support the U.S. currency. What impact did the recent greenback’s rally have on the technical picture of AUD/USD?
In our opinion the following forex trading positions are justified - summary:
EUR/USD
Last Friday, we wrote the following:
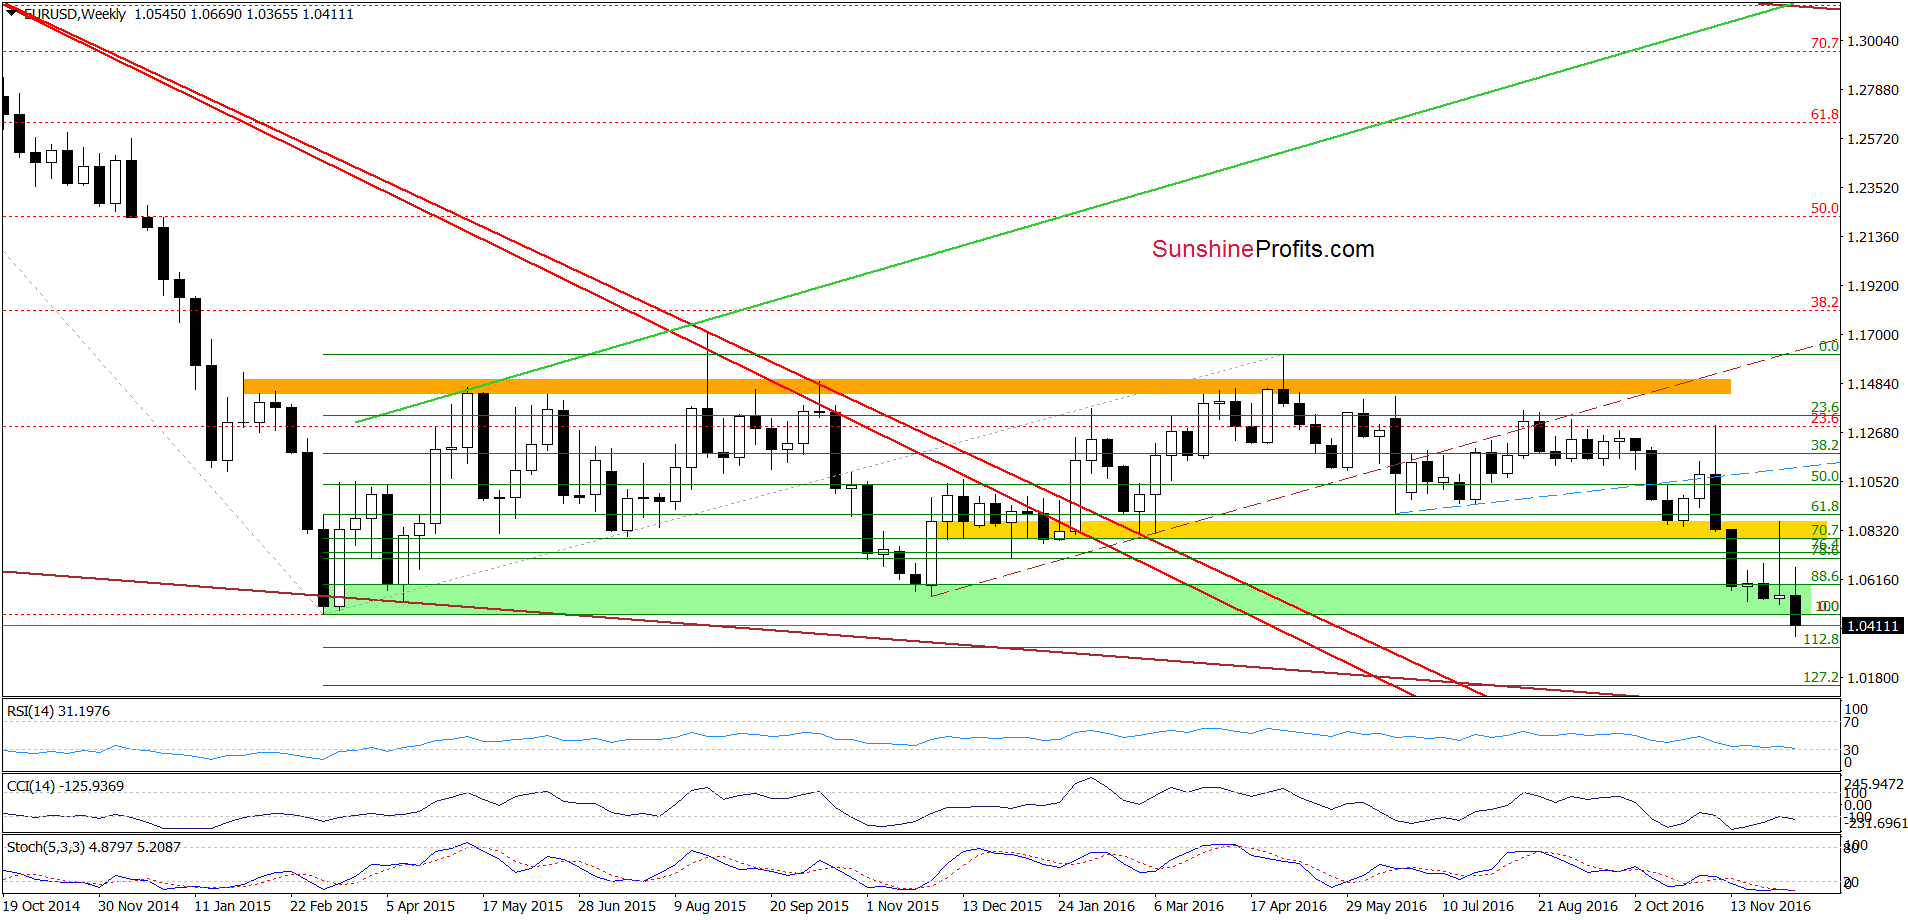
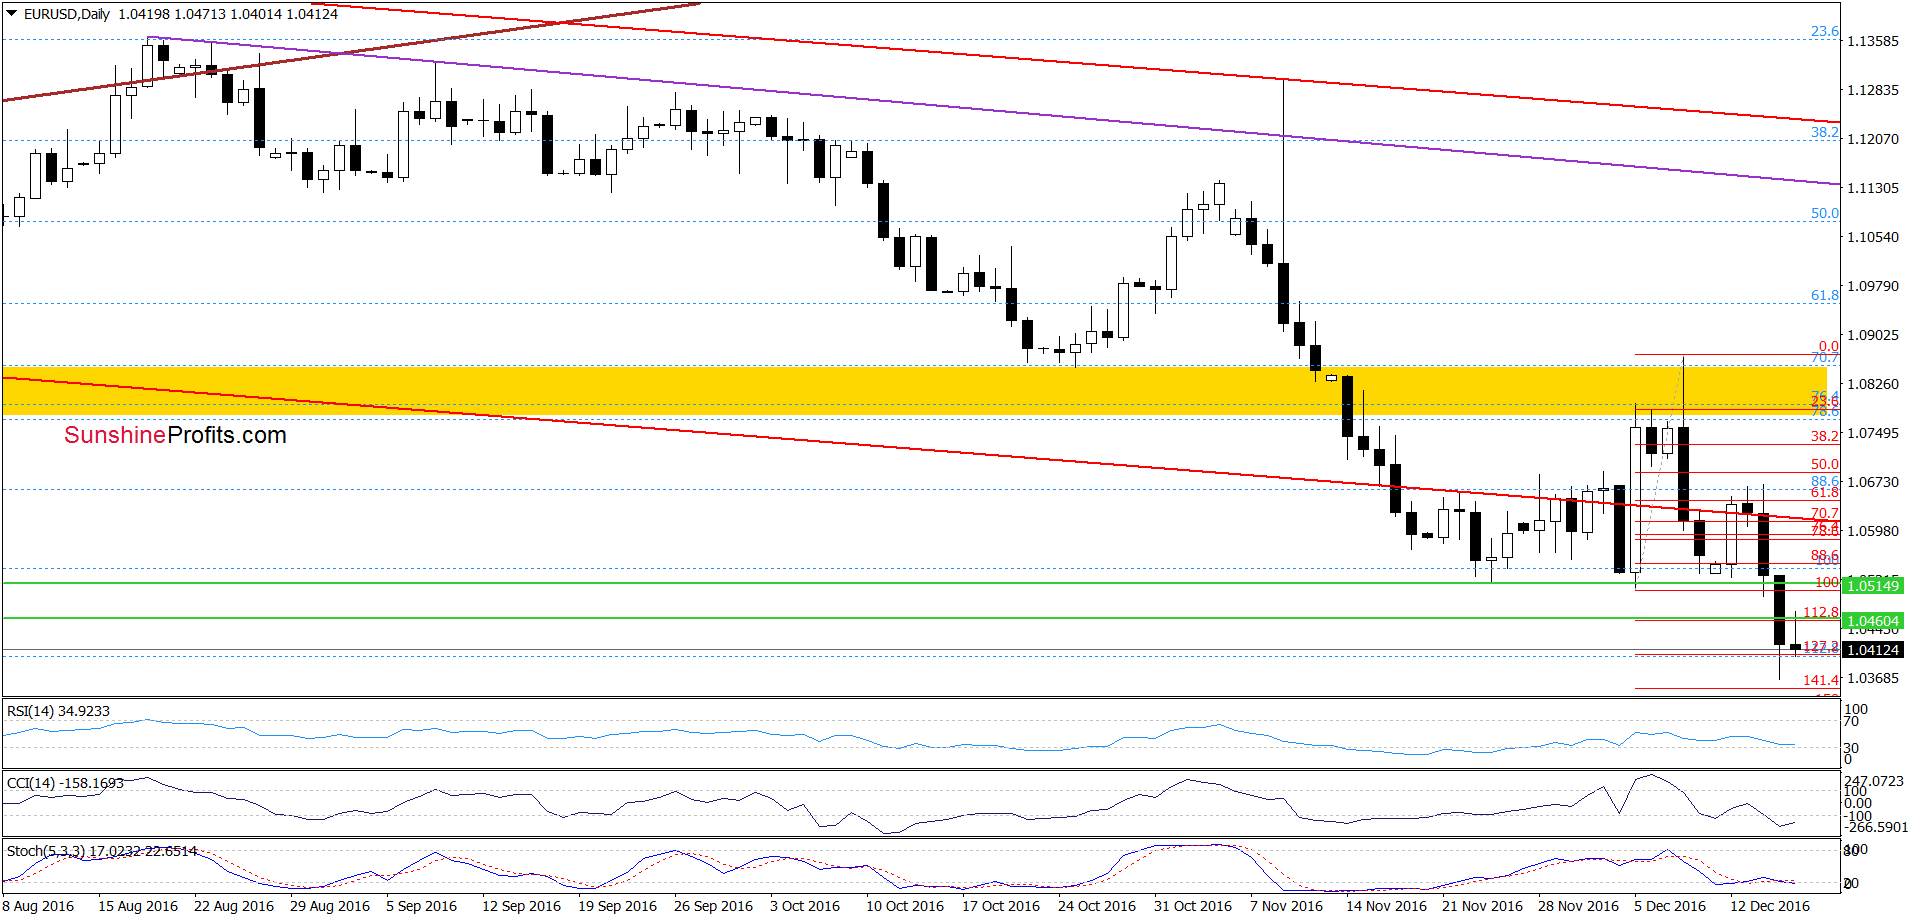
(…) the exchange rate climbed above the upper border of the green zone, however, this improvement was very temporary and the pair reversed. As a result, currency bears took control and erased over 70% of earlier increases in the following hours. With this decline, the pair dropped under the red support line, which in combination with sell signals generated by the indicators suggests further deterioration and a test of the recent lows in the coming day(s).
On the above charts, we see that EUR/USD not only tested the recent lows, but also slipped under the green support zone marked on the weekly chart, which is a bearish signal that suggests further deterioration and even a test of the green support zone seen on the long-term chart below.
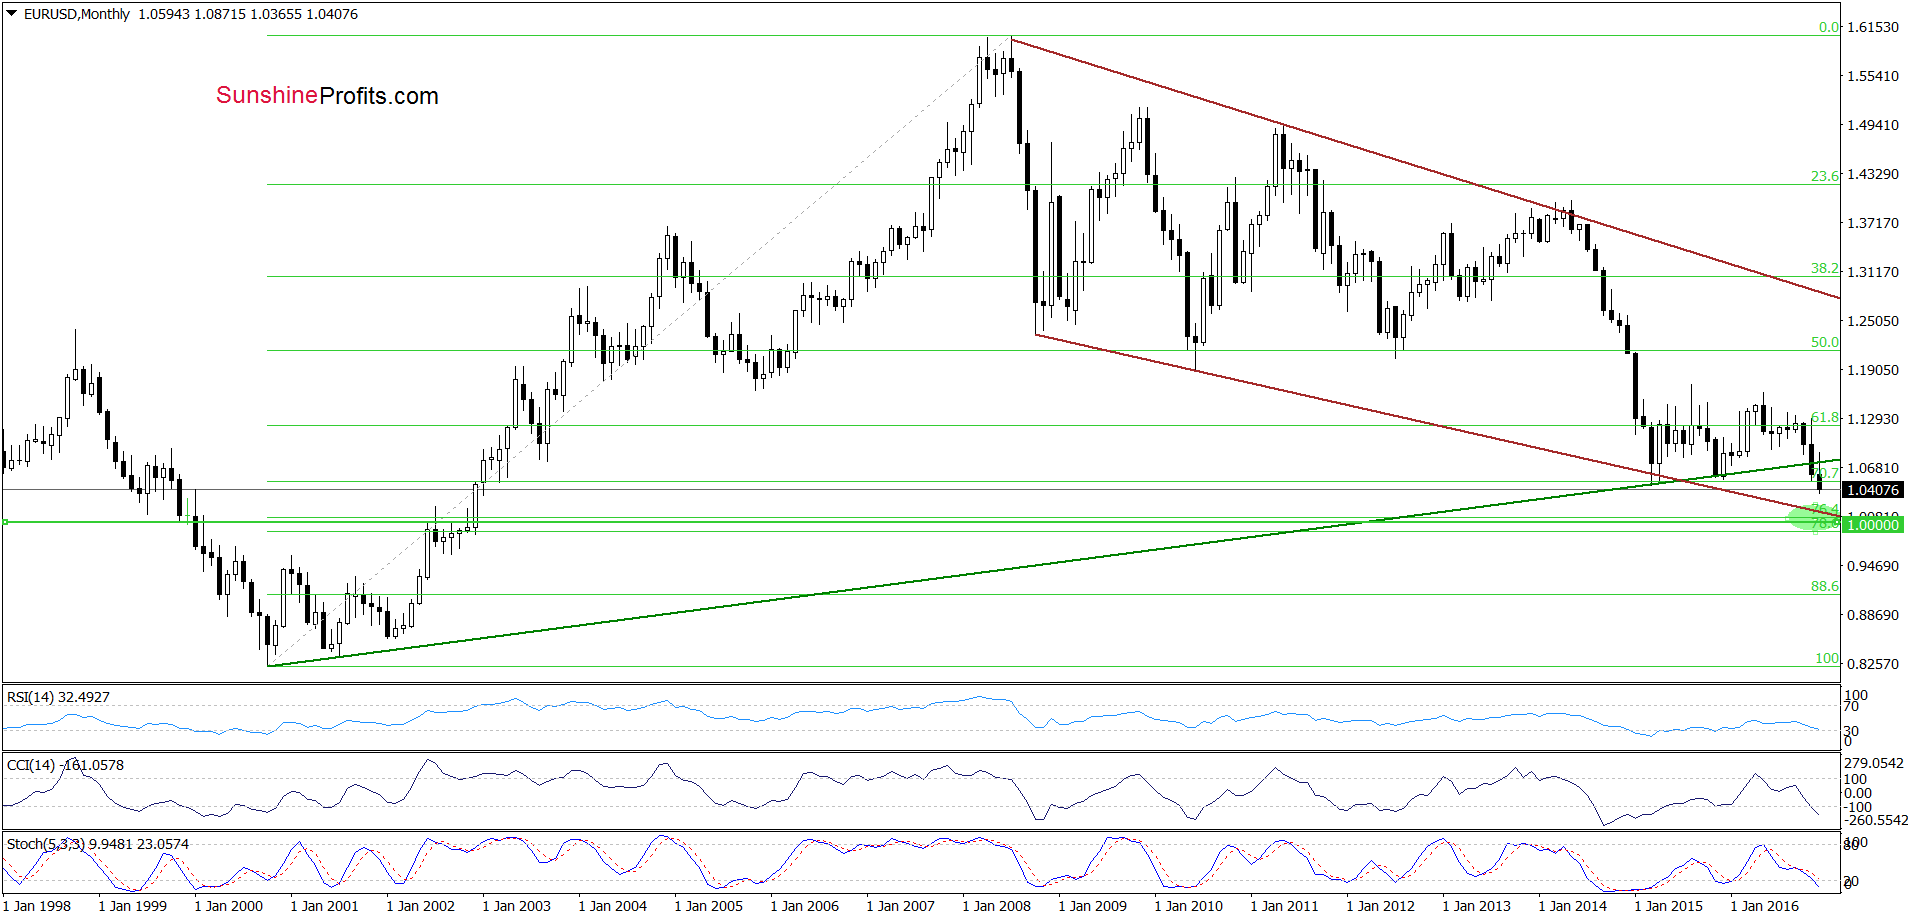
As you see, this area is created by the lower border of the brown declining trend channel, the 78.6% and 76.4% Fibonacci retracements and the barrier of 1.0000, which together could stop declines in the coming week.
Very short-term outlook: bearish
Short-term outlook: mixed
MT outlook: mixed
LT outlook: mixed
Trading position (short-term; our opinion): No positions are justified from the risk/reward perspective. We will keep you informed should anything change, or should we see a confirmation/invalidation of the above.
USD/CAD
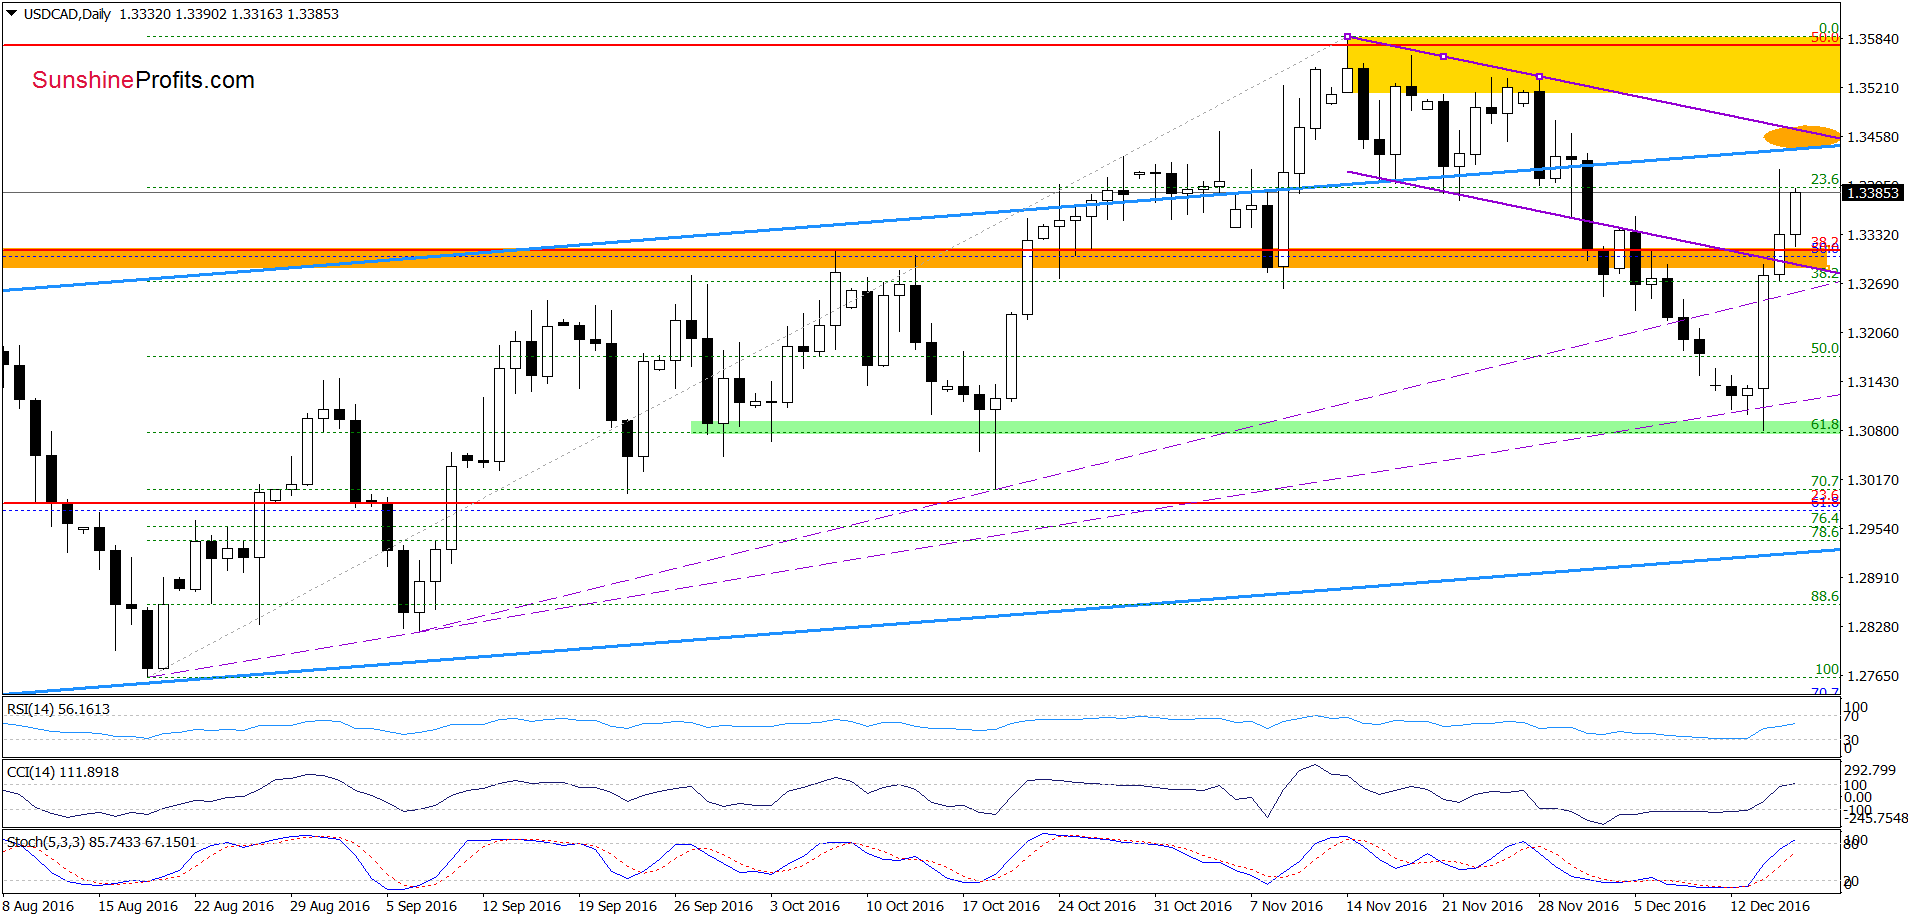
In our previous commentary on this currency pair, we wrote:
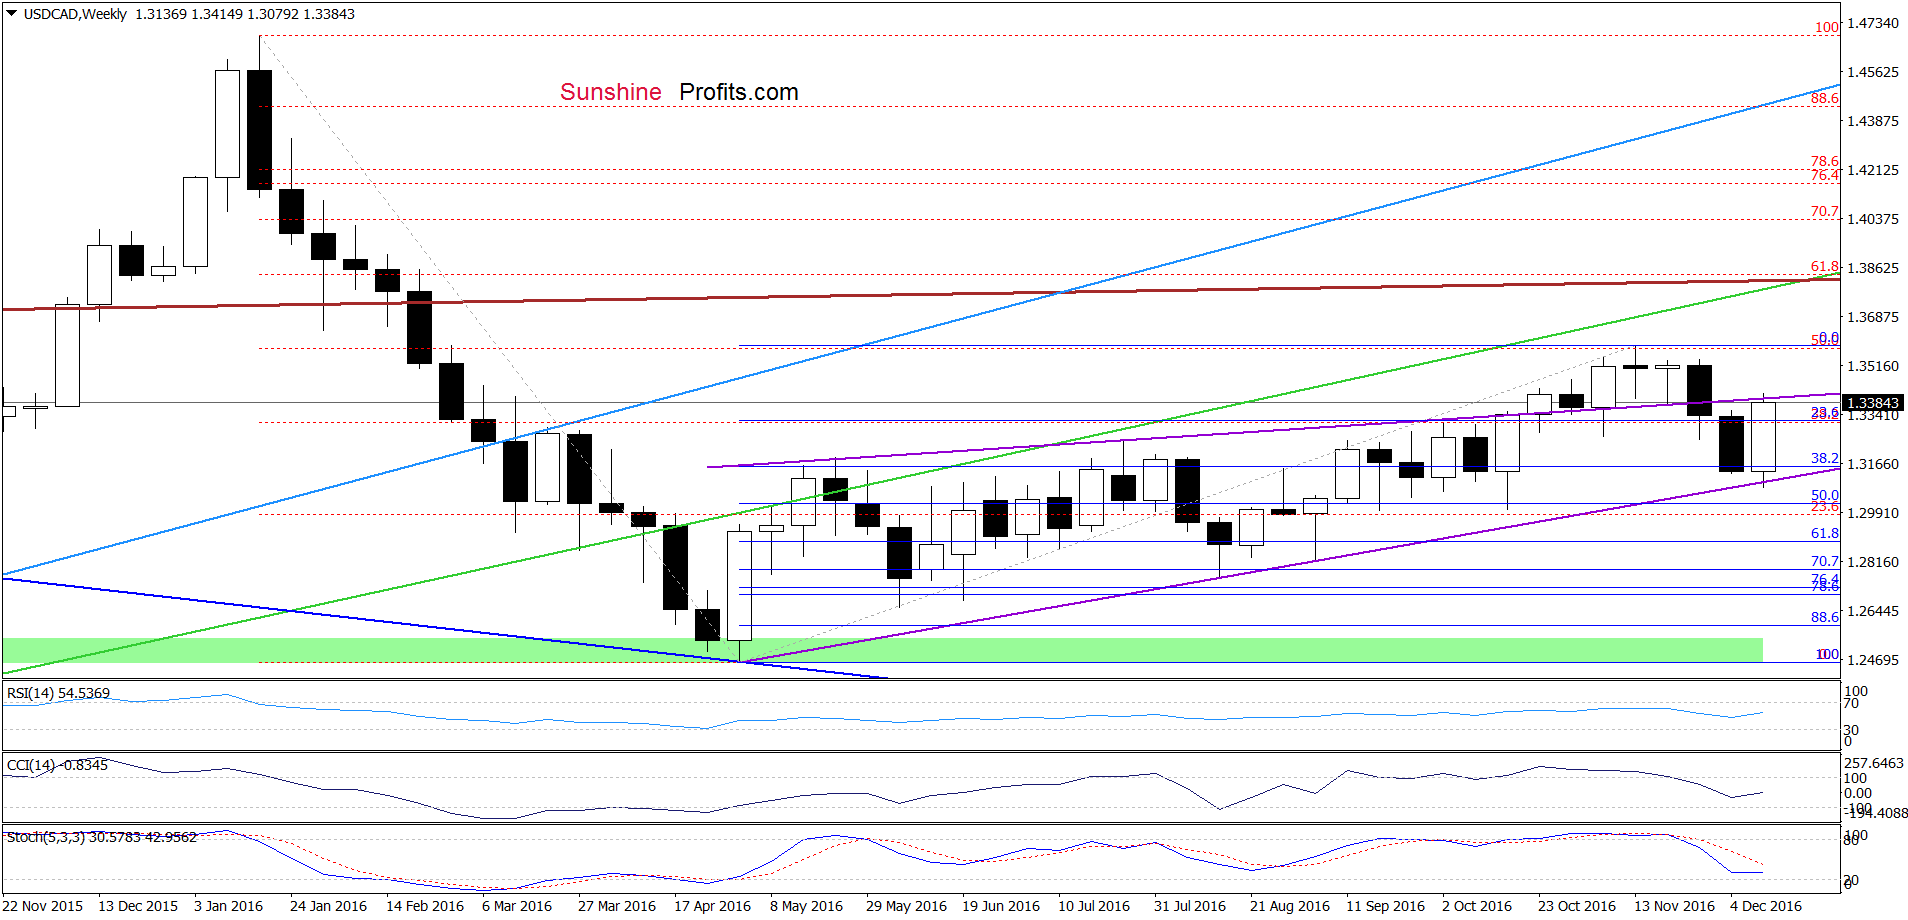
(…) as long as there won’t be buy signals, which could encourage currency bulls to act, another attempt to move lower can’t be ruled out. Therefore, if the pair declines from here, we may see a drop to the green support zone marked on the daily chart (created by the late Sep lows, the 61.8% retracement and the lower purple rising support line) around 1.3078-1.3090. Additionally, this area is reinforced by the lower border of the purple rising trend channel seen on the weekly chart.
Looking at the charts, we see that currency bears pushed the exchange rate lower (as we had expected), which resulted in a drop to our downside target. As you see, the green support zone triggered a sharp rebound, which took the pair not only above the orange resistance zone, but also the lower border of the purple declining trend channel (seen on the daily chart). In this way, USD/CAD invalidated earlier breakdowns, which is a bullish development that suggests further improvement and a test of the upper line of the blue rising trend channel and the upper line of the purple trend channel (we marked this area with an orange ellipse) in the coming days.
Very short-term outlook: bullish
Short-term outlook: mixed
MT outlook: mixed
LT outlook: mixed
Trading position (short-term; our opinion): No positions are justified from the risk/reward perspective. We will keep you informed should anything change, or should we see a confirmation/invalidation of the above.
AUD/USD
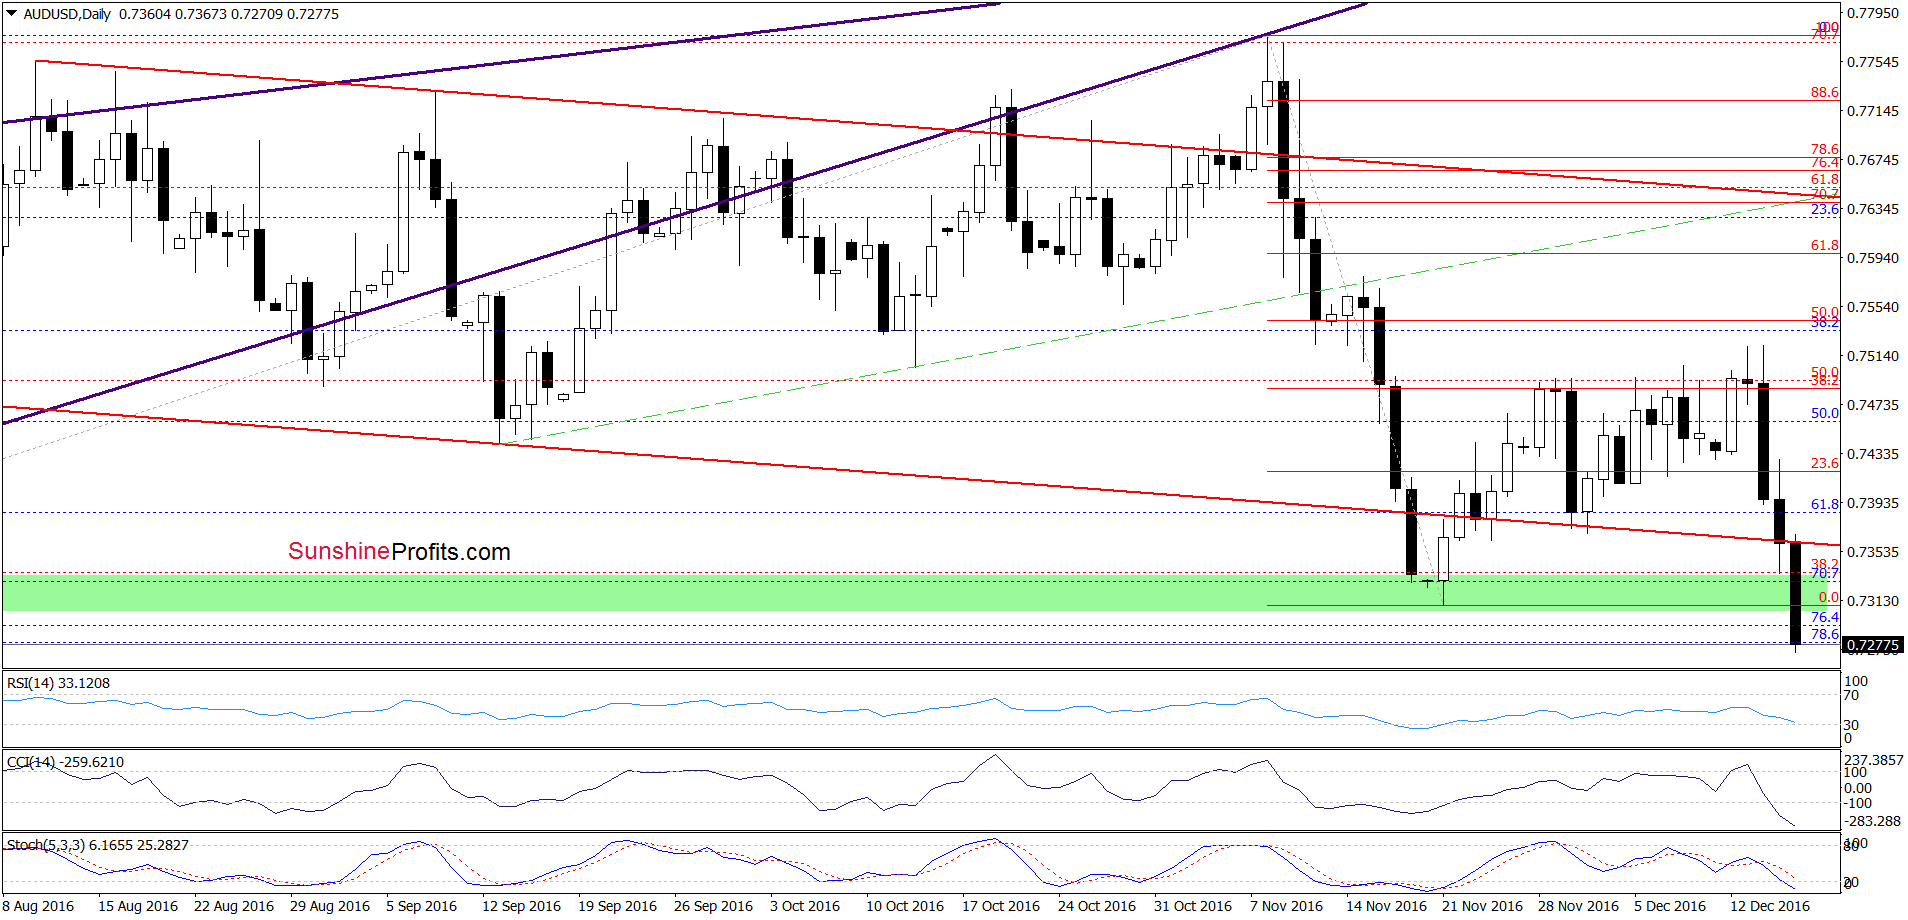
Quoting our Thursday’s alert:
(…) AUD/USD extended gains and reached the recent highs once again. Although this is a positive signal, the 38.2% Fibonacci retracement continues to keep gains in check, which suggests that we may see another attempt to move lower from here in very near future (especially if indicators generate sell signals). If we see such price action, AUD/USD will likely move lower once again and re-test the green support zone (based on the previous lows, which is currently reinforced by the red declining support line) in the coming day(s).
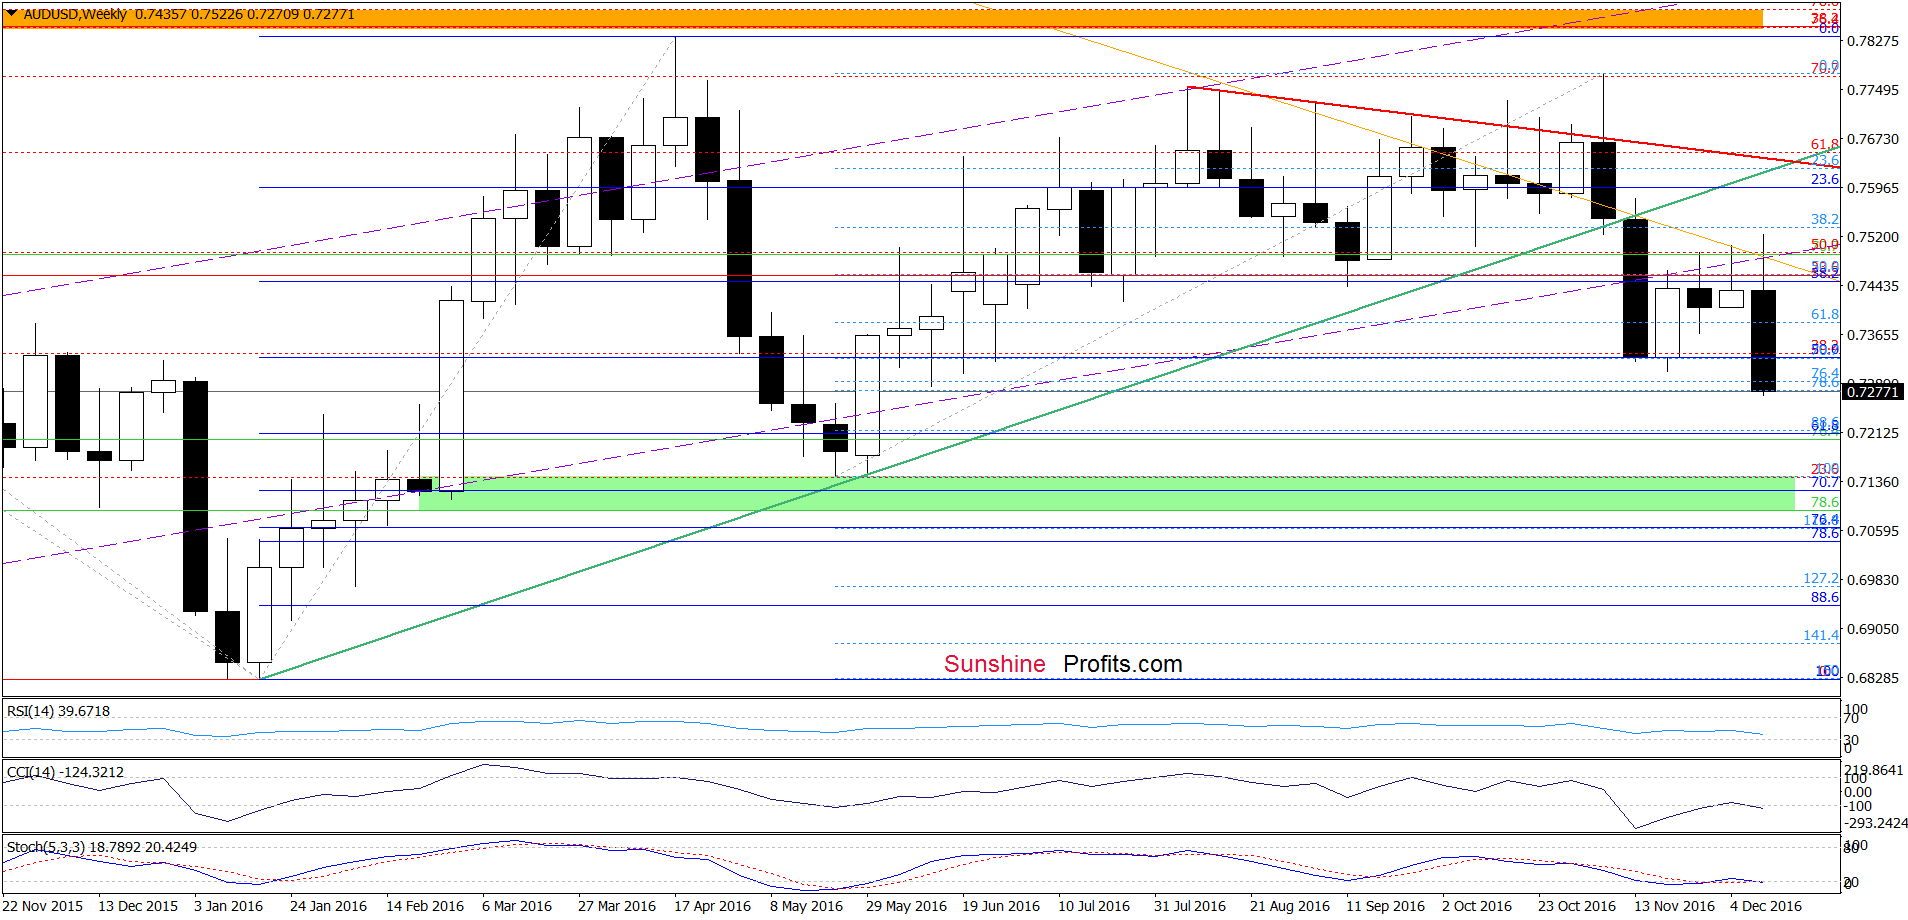
From today’s point of view, we see that the situation developed in line with the above scenario and AUD/USD declined to our downside target yesterday. Earlier today, the pair verified the breakdown under the red declining support line, which resulted in further deterioration and a breakdown below the green support zone.
What’s next? Taking into account the fact that sell signals generated by the indicators remain in place, we may see a decline to around 0.7211, where the 61.8% Fibonacci retracement is (based on the Jan-Apr upward move and marked on the weekly chart) or even a test of the May lows (0.7143-0.7182) in the coming week.
Very short-term outlook: bearish
Short-term outlook: mixed
MT outlook: mixed
LT outlook: mixed
Trading position (short-term; our opinion): No positions are justified from the risk/reward perspective. We will keep you informed should anything change, or should we see a confirmation/invalidation of the above.
Thank you.
Nadia Simmons
Forex & Oil Trading Strategist
Przemyslaw Radomski, CFA
Founder, Editor-in-chief, Gold & Silver Fund Manager
Gold & Silver Trading Alerts
Forex Trading Alerts
Oil Investment Updates
Oil Trading Alerts

