

Although the USD Index moved little lower in previous days, yesterday’s Federal Reserve Chair Janet Yellen’s comments supported the greenback and took the U.S. currency to fresh highs earlier today. As a result, EUR/USD extended losses. How low could the exchange rate go in the coming days?
In our opinion the following forex trading positions are justified - summary:
EUR/USD
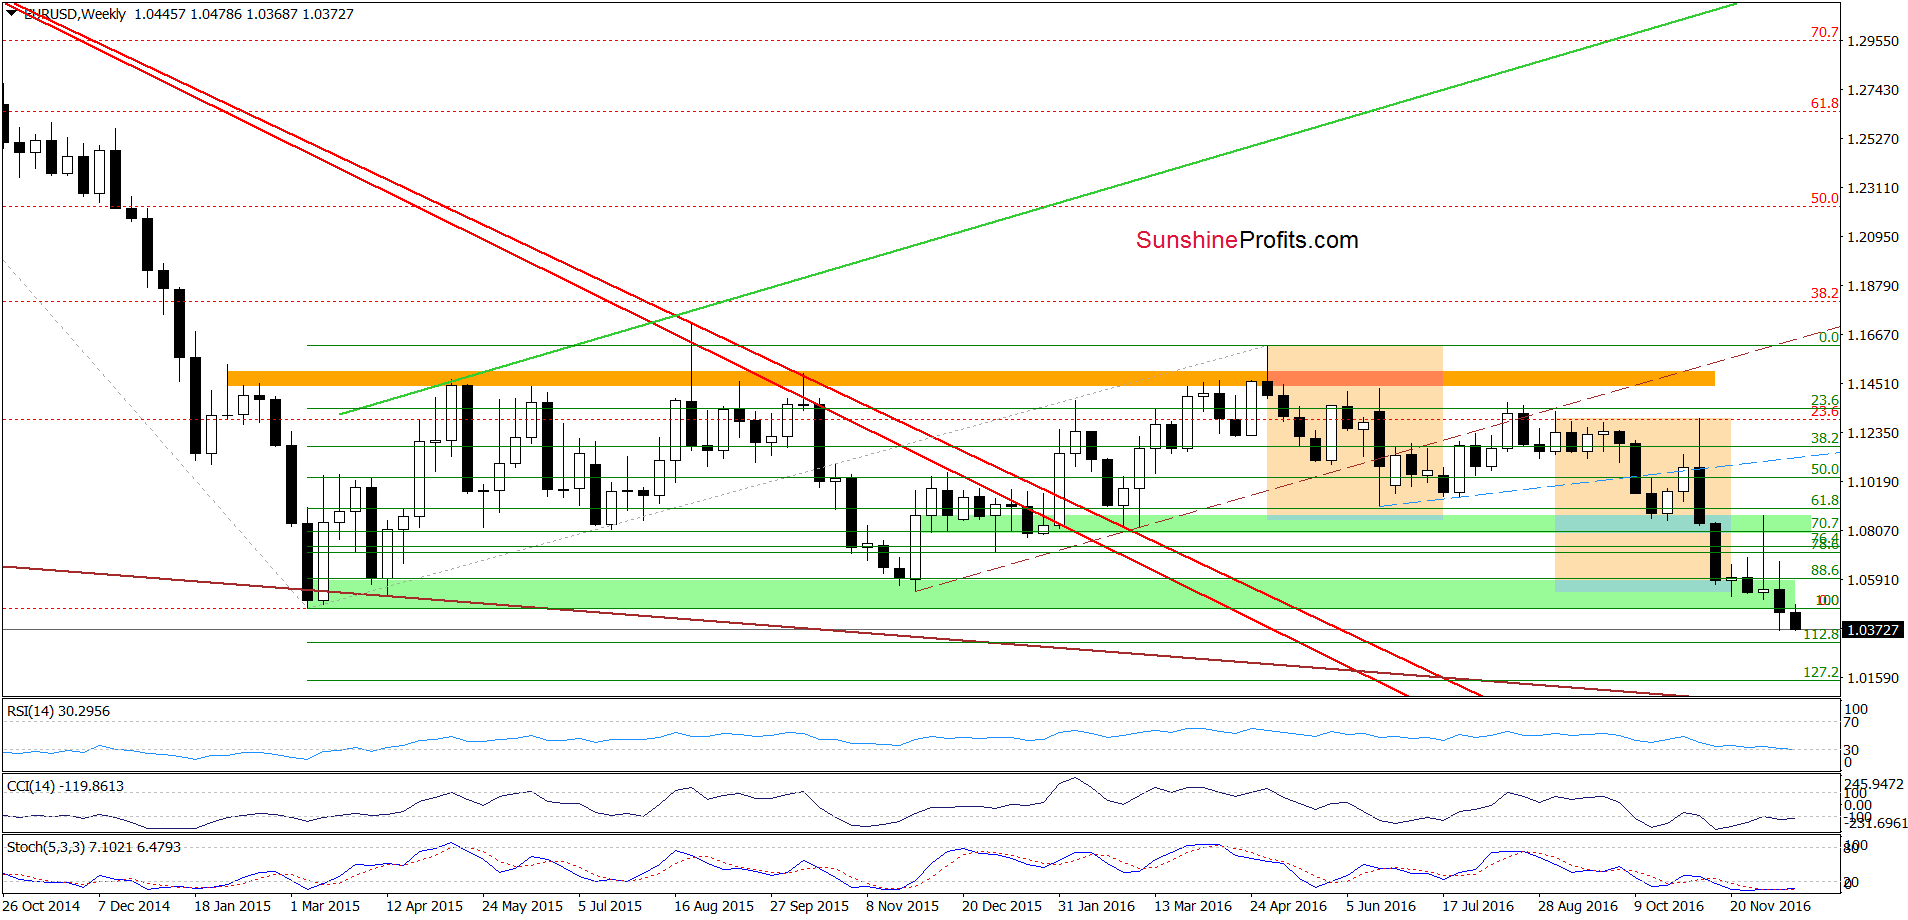
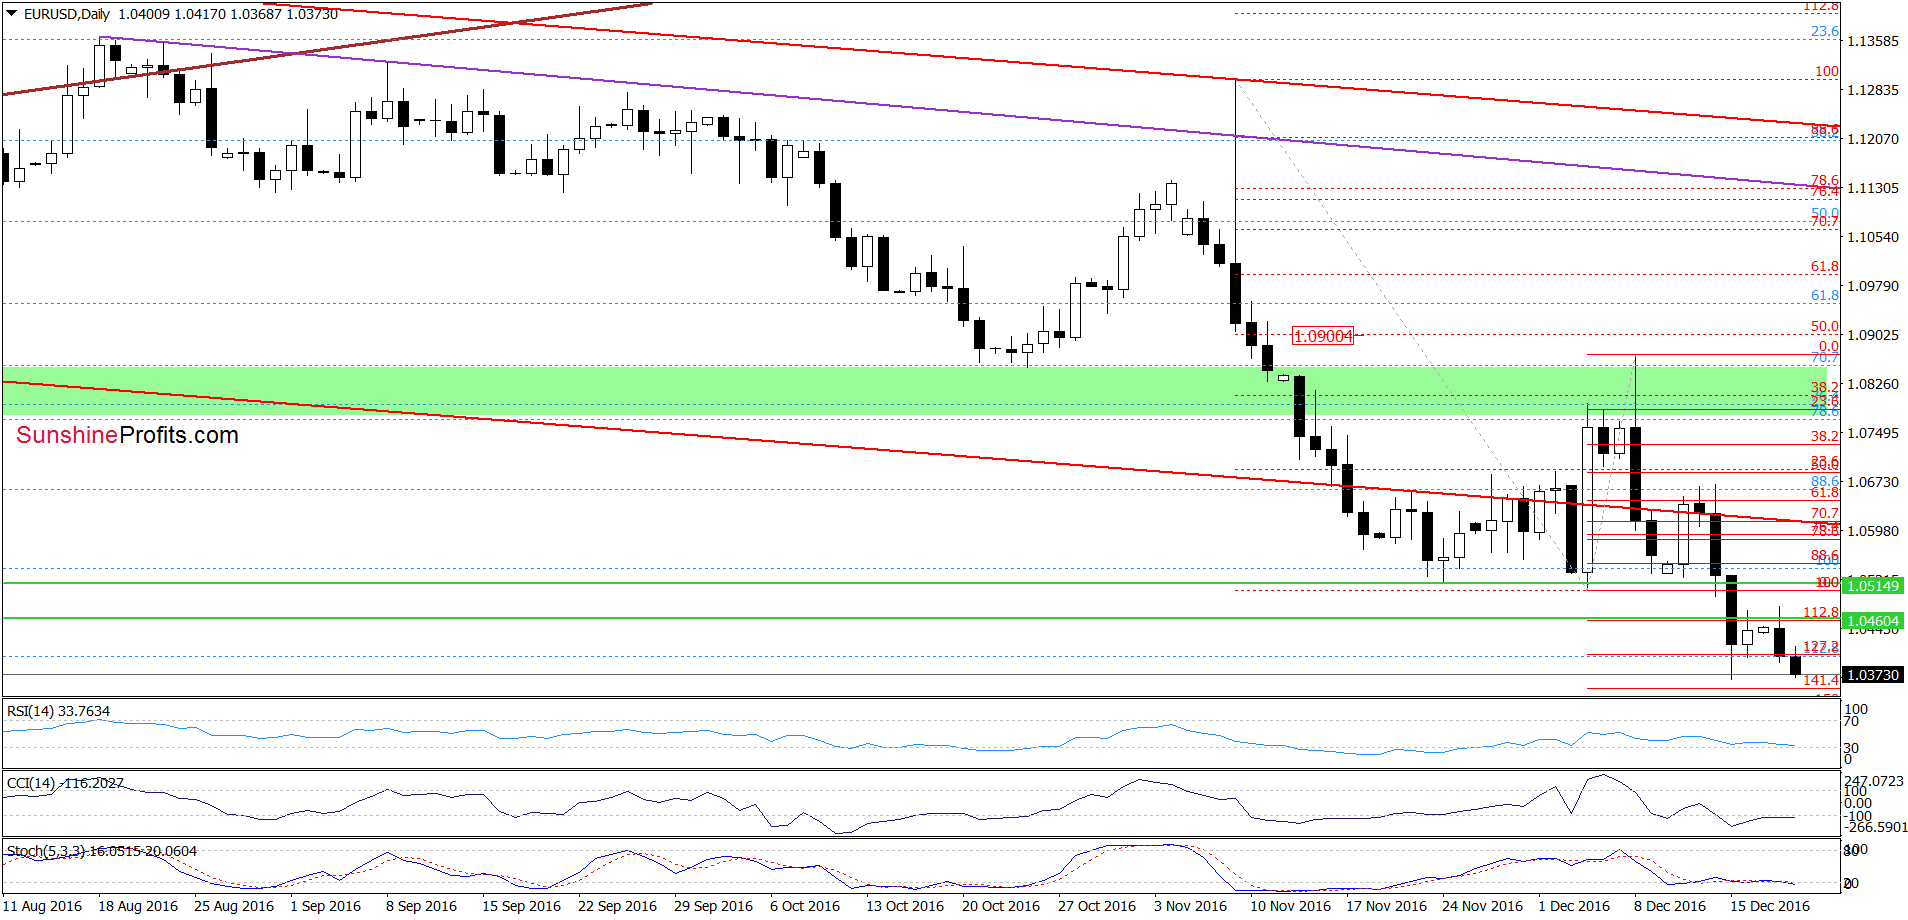
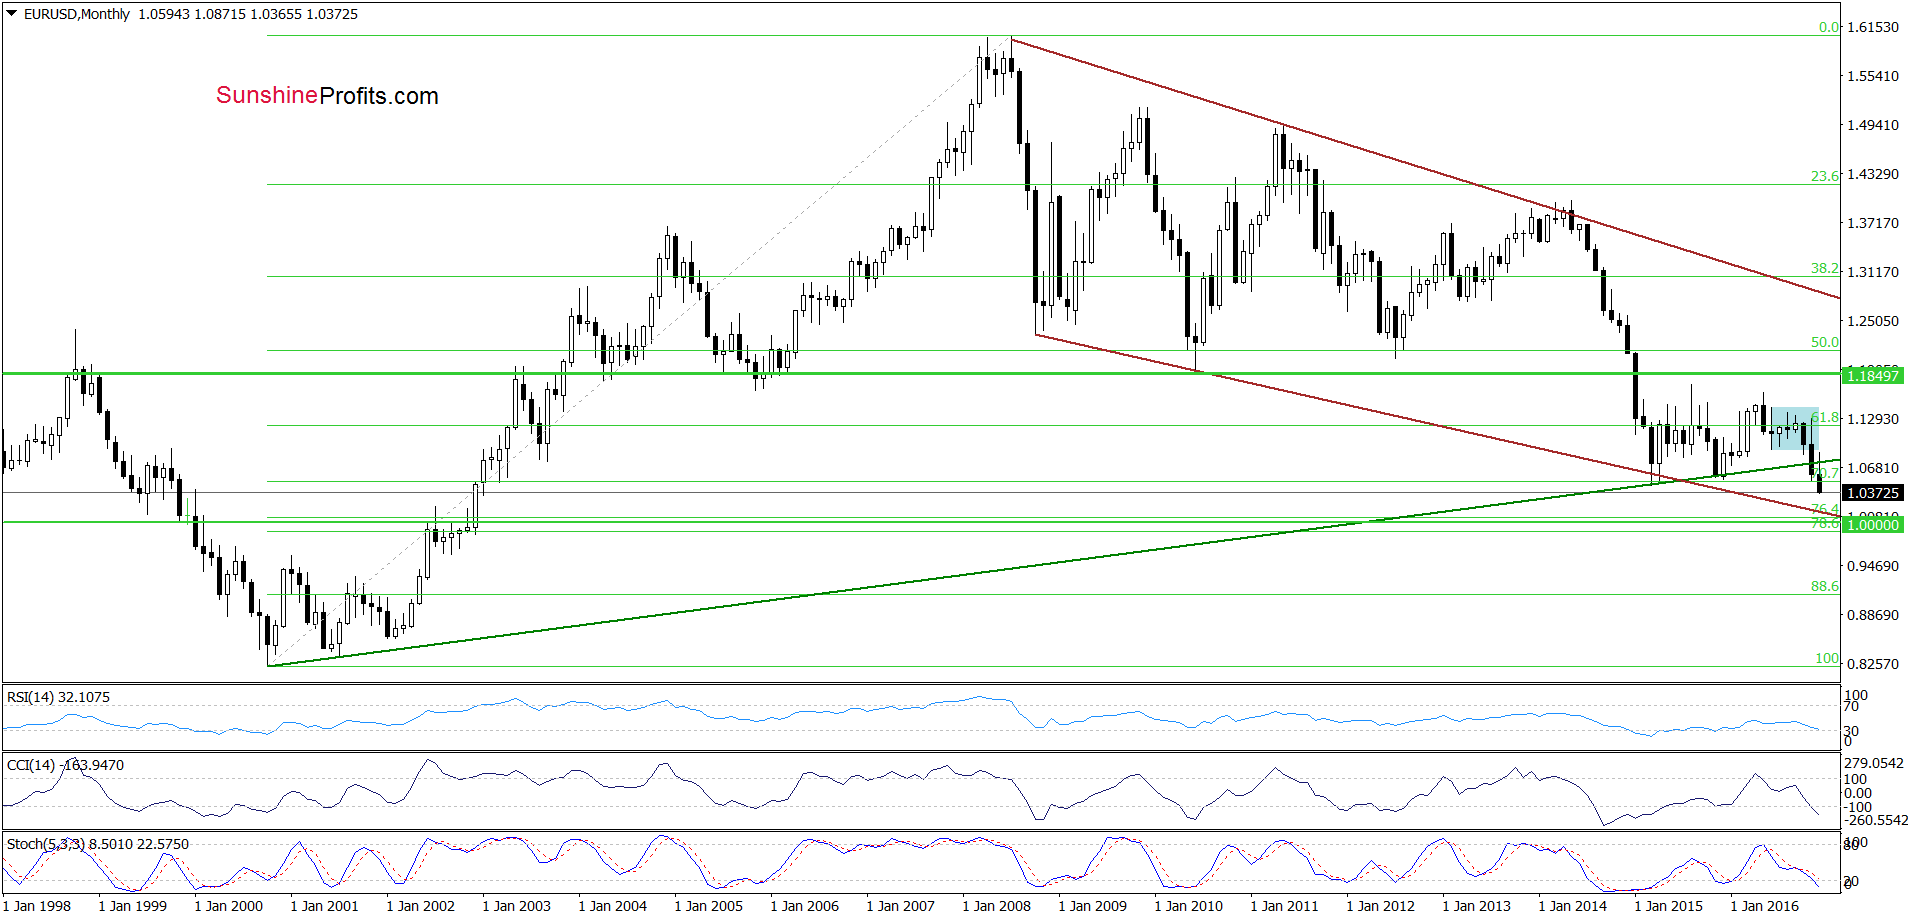
Looking at the charts, we see that although EUR/USD moved higher yesterday, the pair reversed and declined in the following hours, which looks like a verification of a breakdown under the previously-broken Nov and early-Dec lows. Such price action doesn’t bode well for the exchange rate and suggests further deterioration to the 112.8%, 127.2% Fibonacci extension (both marked on the weekly chart) or even a test of the lower border of the long-term brown declining trend channel and the barrier of 1.0000 seen on the long-term chart below.
Very short-term outlook: bearish
Short-term outlook: mixed with bearish bias
MT outlook: mixed
LT outlook: mixed
Trading position (short-term; our opinion): No positions are justified from the risk/reward perspective. We will keep you informed should anything change, or should we see a confirmation/invalidation of the above.
GBP/USD
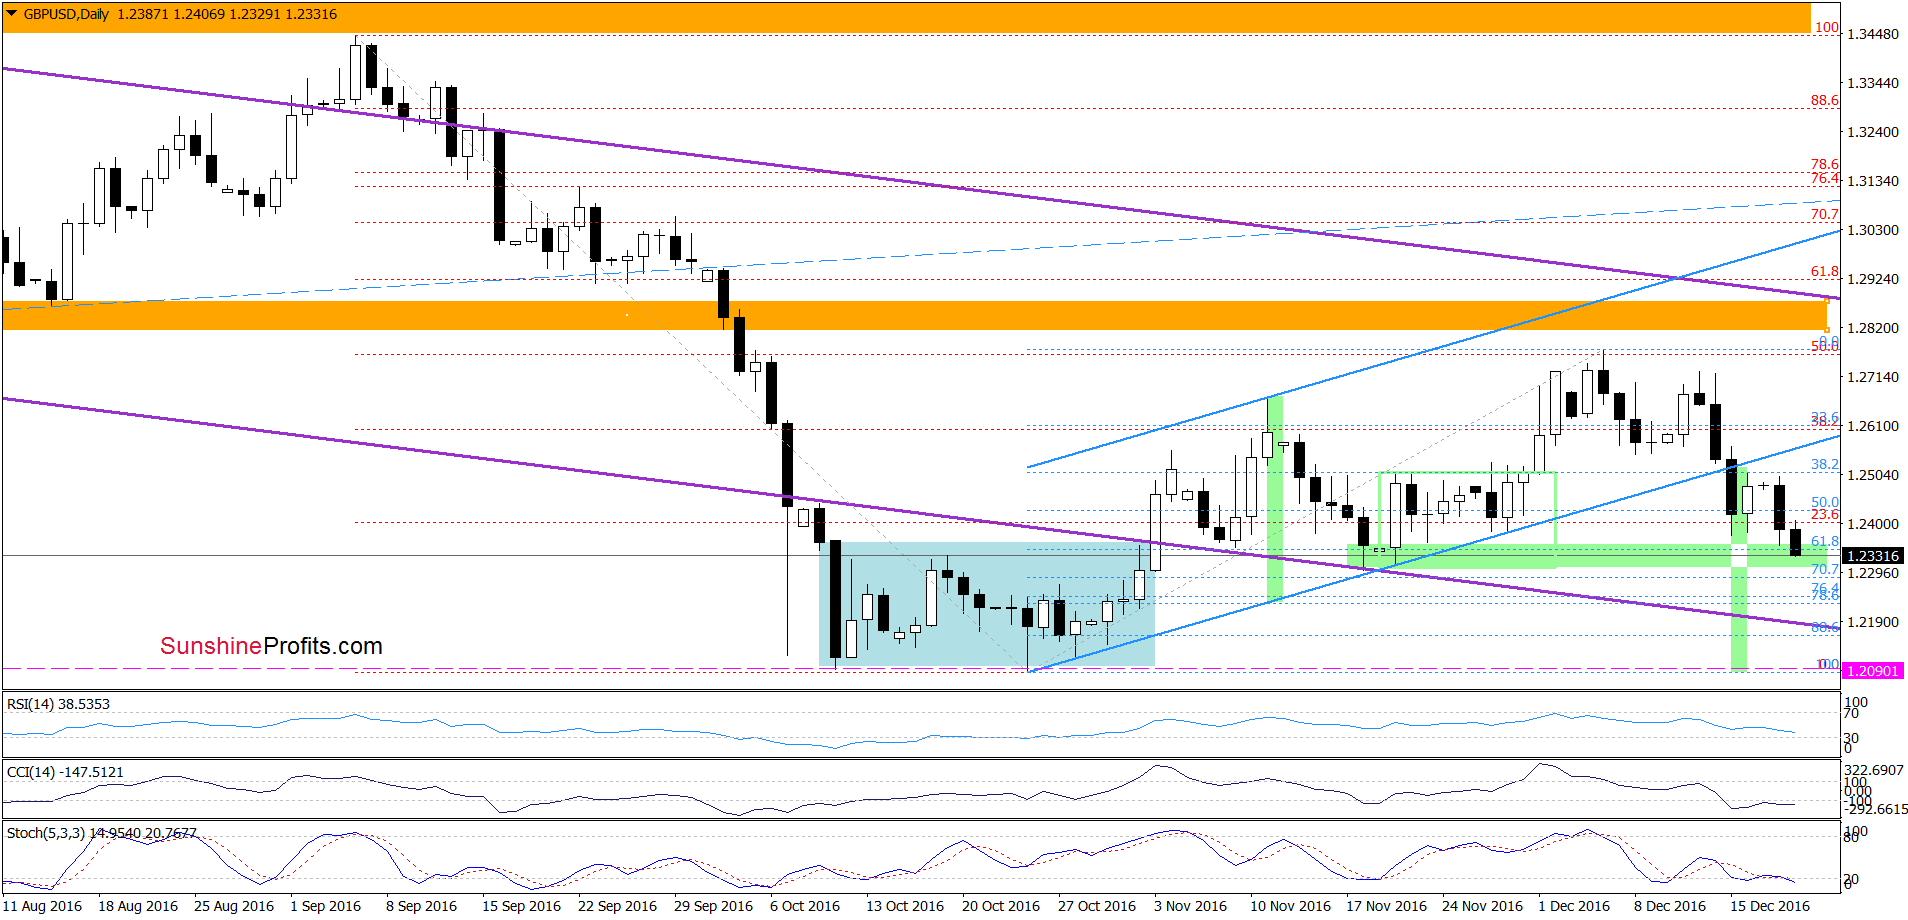
Looking at the charts, we see that GBP/USD extended losses earlier today, which means that what we wrote yesterday remains up-to-date:
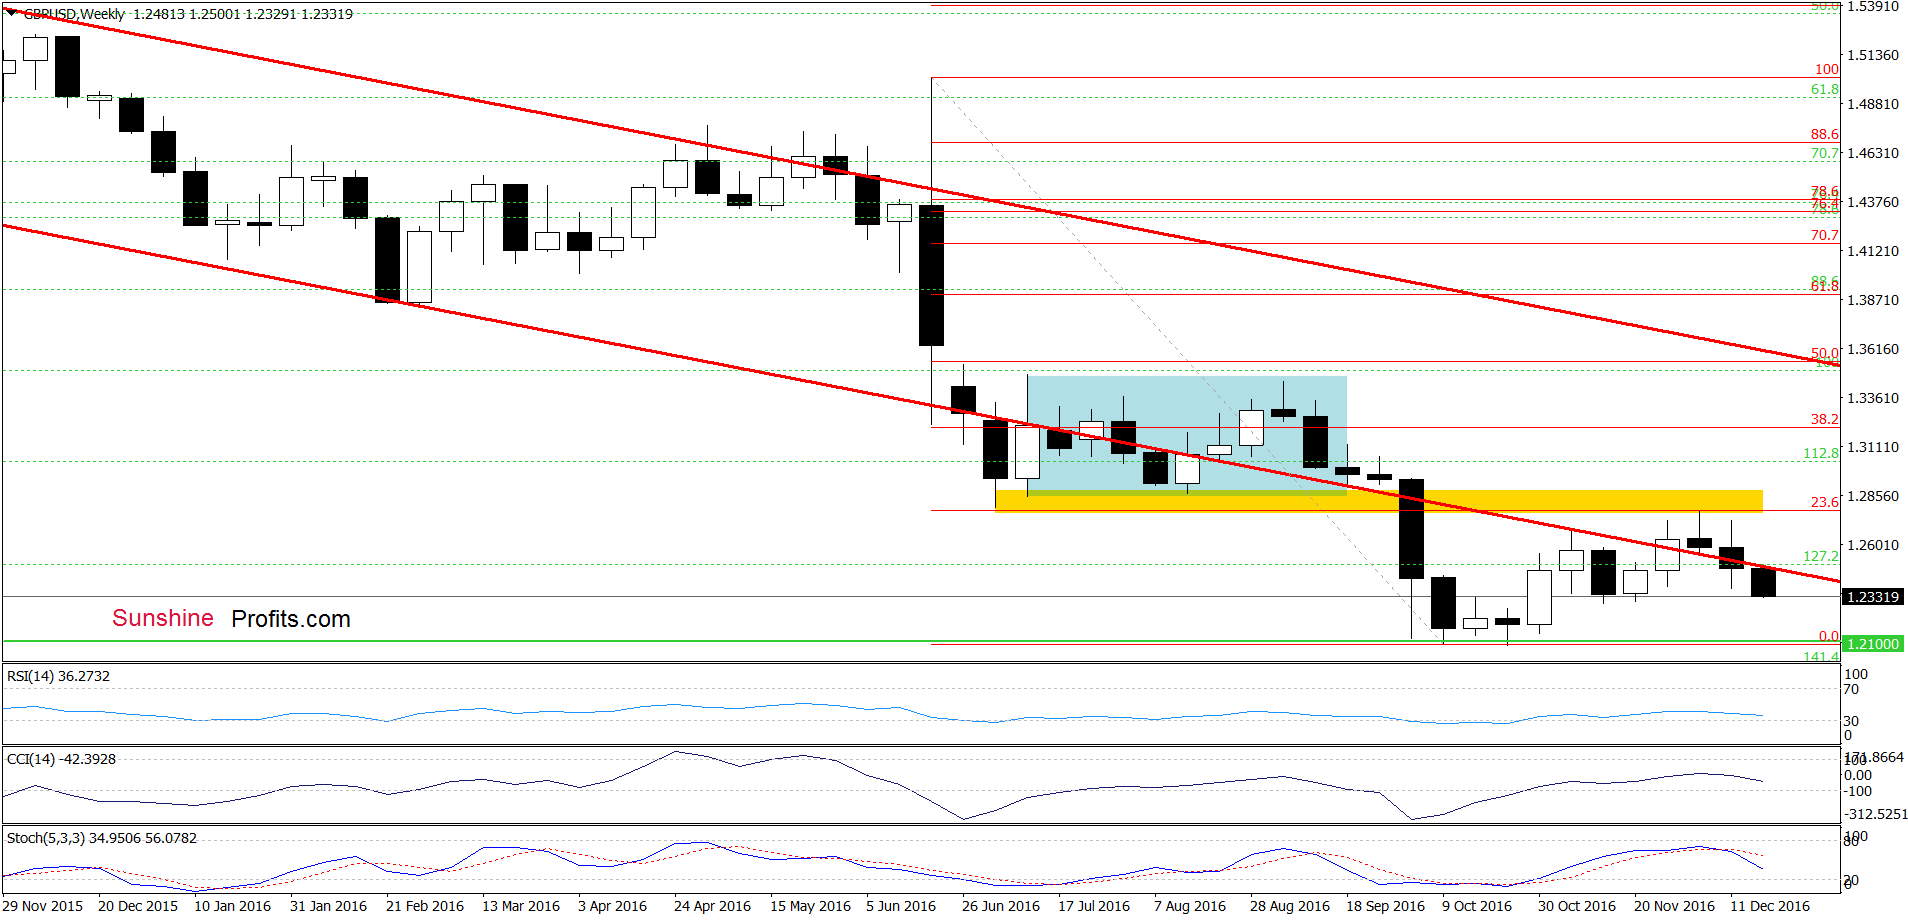
(…) GBP/USD moved lower and invalidted earlier breakout above the lower border of the red declining trend channel – similarly to what we saw at the beginning of Oct. Such price action doesn’t bode well for currency bulls and suggests further deterioration. This scenario is also reinforced by a sell signal generated by the Stochastic Oscillator.
How low could the exchange rate go?
(…) we should keep in mind that the last week’s decline pushed the pair below the lower border of the blue rising trend channel, which is a negative signal that suggests a drop to around 1.2090, where the size of the move would correspond to the height of the channel. In this area is also the Oct low and the barrier of 1.2000, which together could stop further deterioration once again.
Very short-term outlook: mixed with bearish bias
Short-term outlook: mixed
MT outlook: mixed
LT outlook: mixed
Trading position (short-term; our opinion): No positions are justified from the risk/reward perspective. We will keep you informed should anything change, or should we see a confirmation/invalidation of the above.
AUD/USD
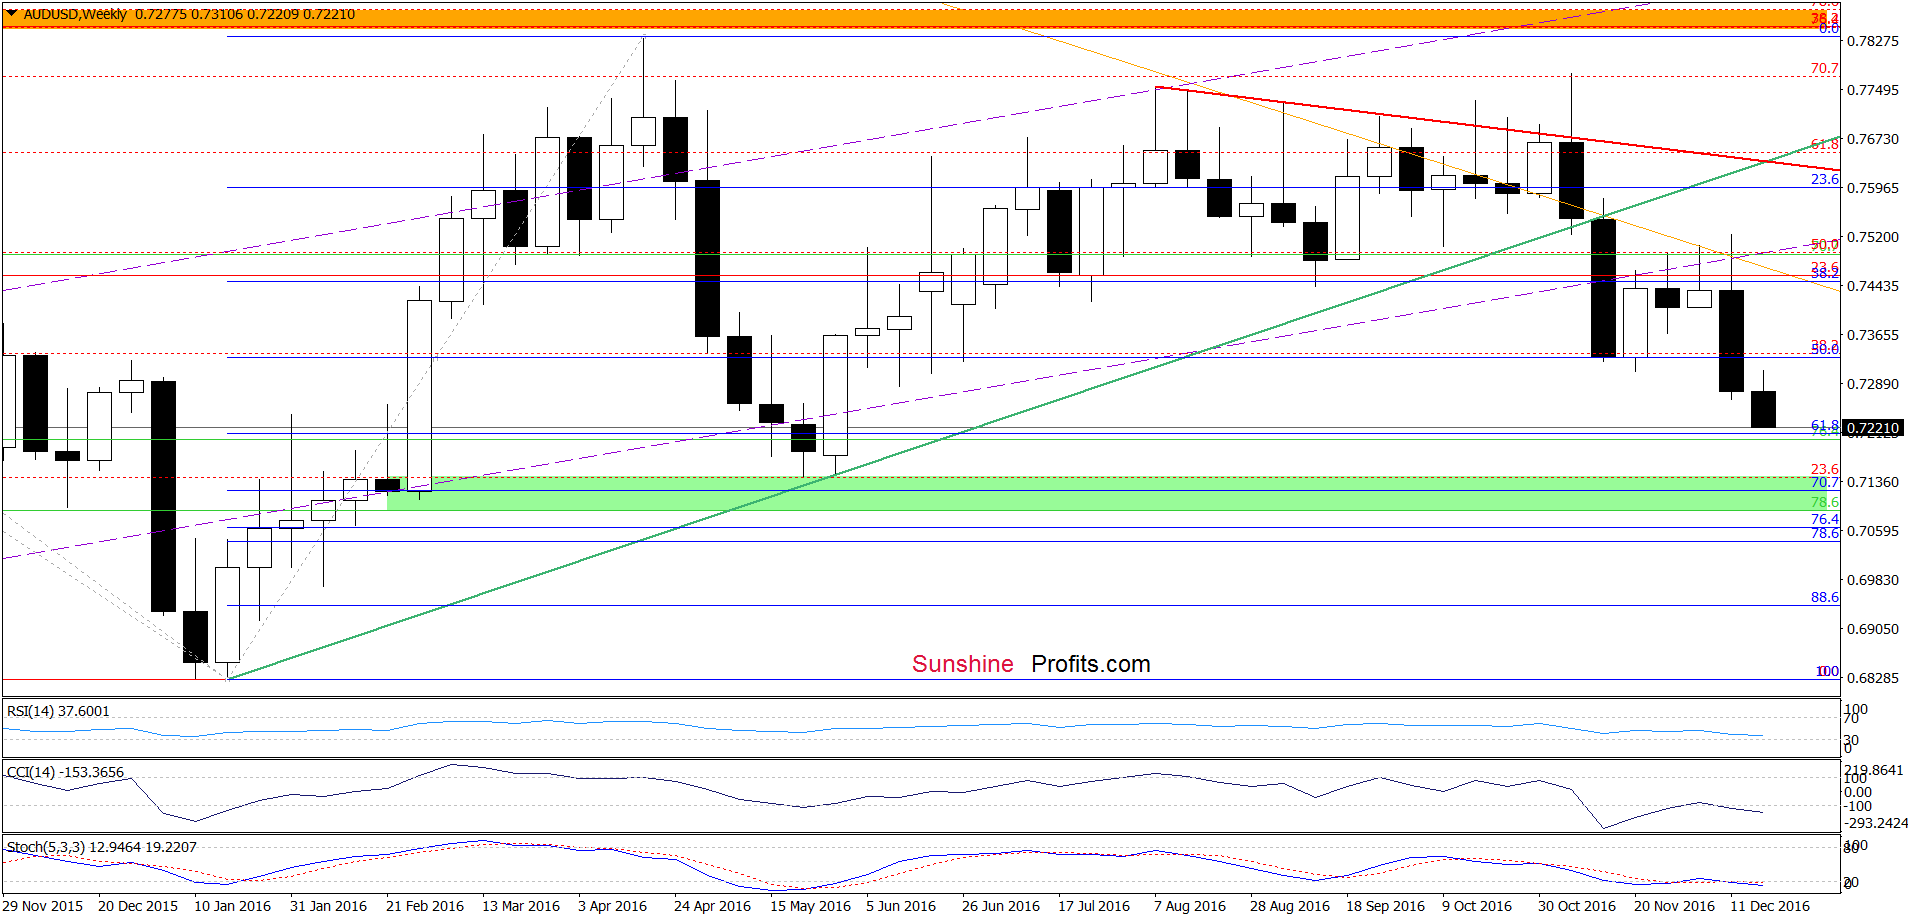
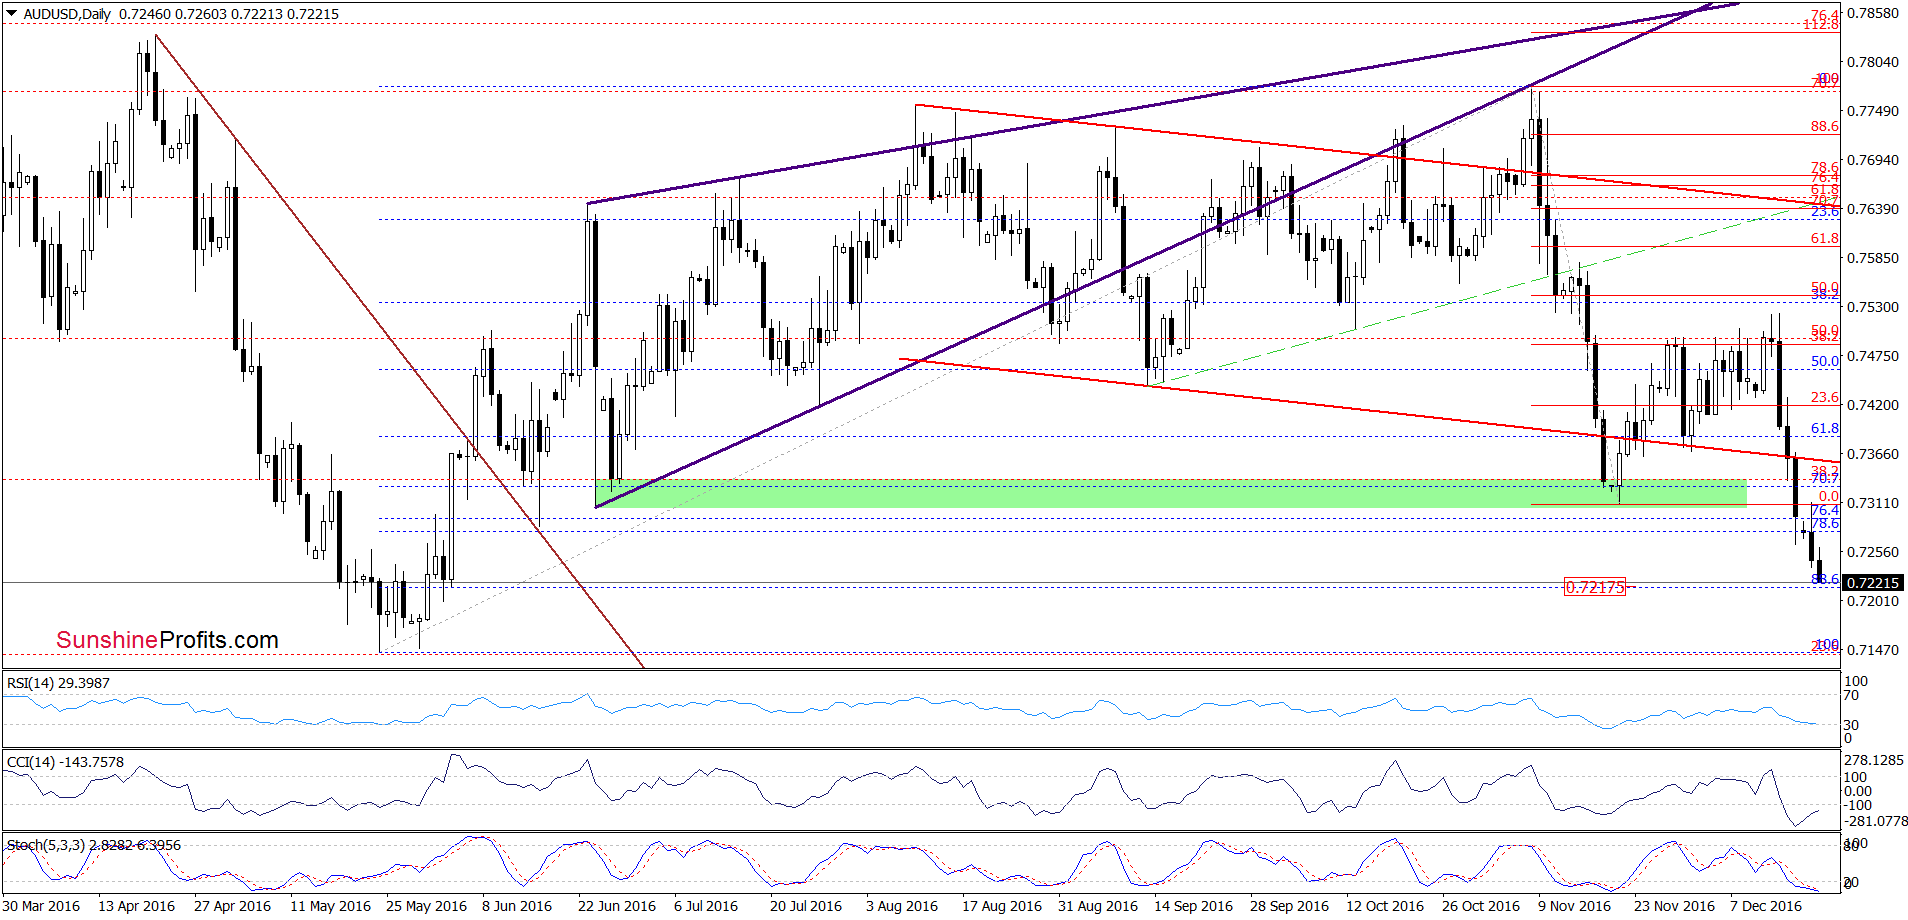
On the daily chart, we see that AUD/USD moved lower once again, which means that our previous commentary on this currency pair is up-to-date also today:
(…) What’s next? Taking into account the fact that sell signals generated by the indicators remain in place, we may see a decline to around 0.7211, where the 61.8% Fibonacci retracement is (based on the Jan-Apr upward move and marked on the weekly chart) or even a test of the May lows (0.7143-0.7182) in the coming week.
Very short-term outlook: bearish
Short-term outlook: mixed
MT outlook: mixed
LT outlook: mixed
Trading position (short-term; our opinion): No positions are justified from the risk/reward perspective. We will keep you informed should anything change, or should we see a confirmation/invalidation of the above.
Thank you.
Nadia Simmons
Forex & Oil Trading Strategist
Przemyslaw Radomski, CFA
Founder, Editor-in-chief, Gold & Silver Fund Manager
Gold & Silver Trading Alerts
Forex Trading Alerts
Oil Investment Updates
Oil Trading Alerts

