

Earlier today, the yen moved higher against the greenback once again, which pushed USD/JPY to the lowest level since late-Oct 2014. What happened at the same time with other currency pairs? Let’s check the charts and find out.
In our opinion the following forex trading positions are justified - summary:
- EUR/USD: short (stop-loss order at 1.1512; initial downside target at 1.0572)
- GBP/USD: none
- USD/JPY: none
- USD/CAD: none
- USD/CHF: none
- AUD/USD: none
EUR/USD
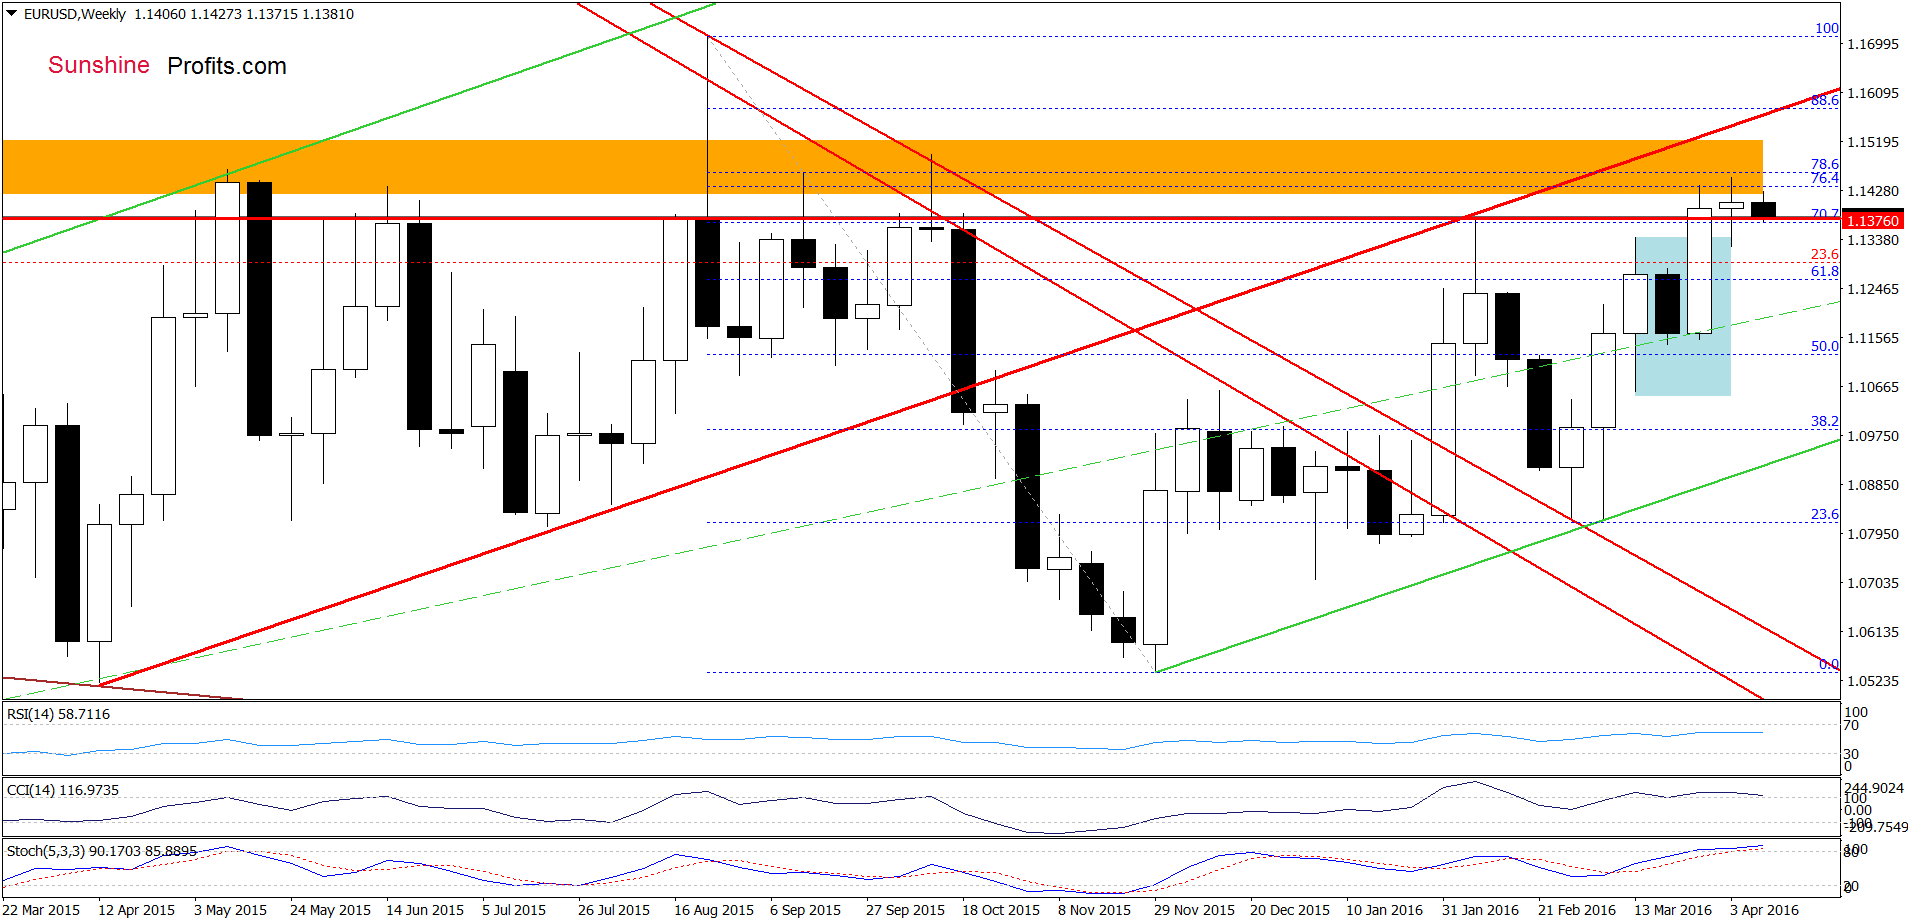
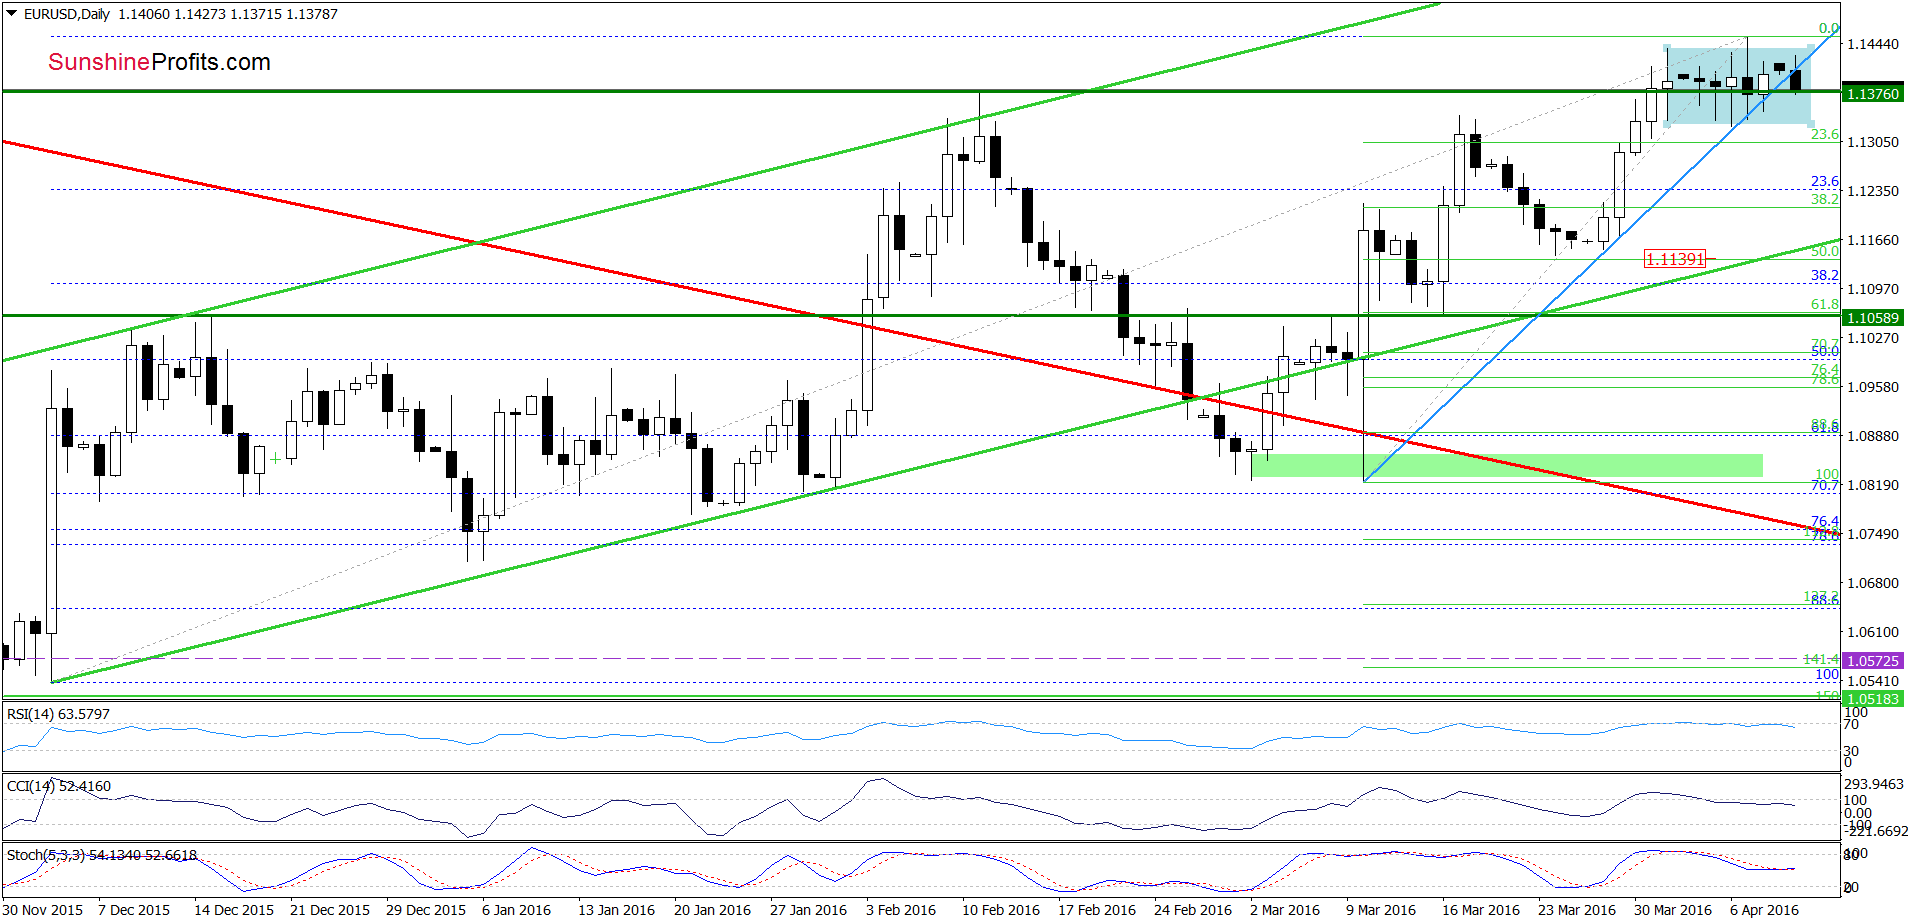
Looking at the above charts, we see that the overall situation hasn’t changed much as EUR/USD is still trading in the blue consolidation. Therefore, what we wrote on Friday is up-to-date also today:
(…) Although the exchange rate slipped under the Feb high once again earlier today, we saw similar price action several times in recent days. Therefore, in our opinion, this potentially negative signal (an invalidation of the breakout), would be more reliable if we see a daily closure below the green horizontal line. Nevertheless, further declines will be more likely if the exchange rate closes the day under the blue support line based on the previous lows and the lower border of the blue consolidation. In this case, the pair will likely accelerate declines and drop to around 1.1200, where the 38.2% Fibonacci retracement (based on the recent upward move) is.
Very short-term outlook: bearish
Short-term outlook: bearish
MT outlook: mixed with bearish bias
LT outlook: mixed
Trading position (short-term; our opinion): Short positions (with a stop-loss order at 1.1512 and the initial downside target at 1.0572) are justified from the risk/reward perspective. We will keep you informed should anything change, or should we see a confirmation/invalidation of the above.
GBP/USD
Quoting our Thursday’s alert:
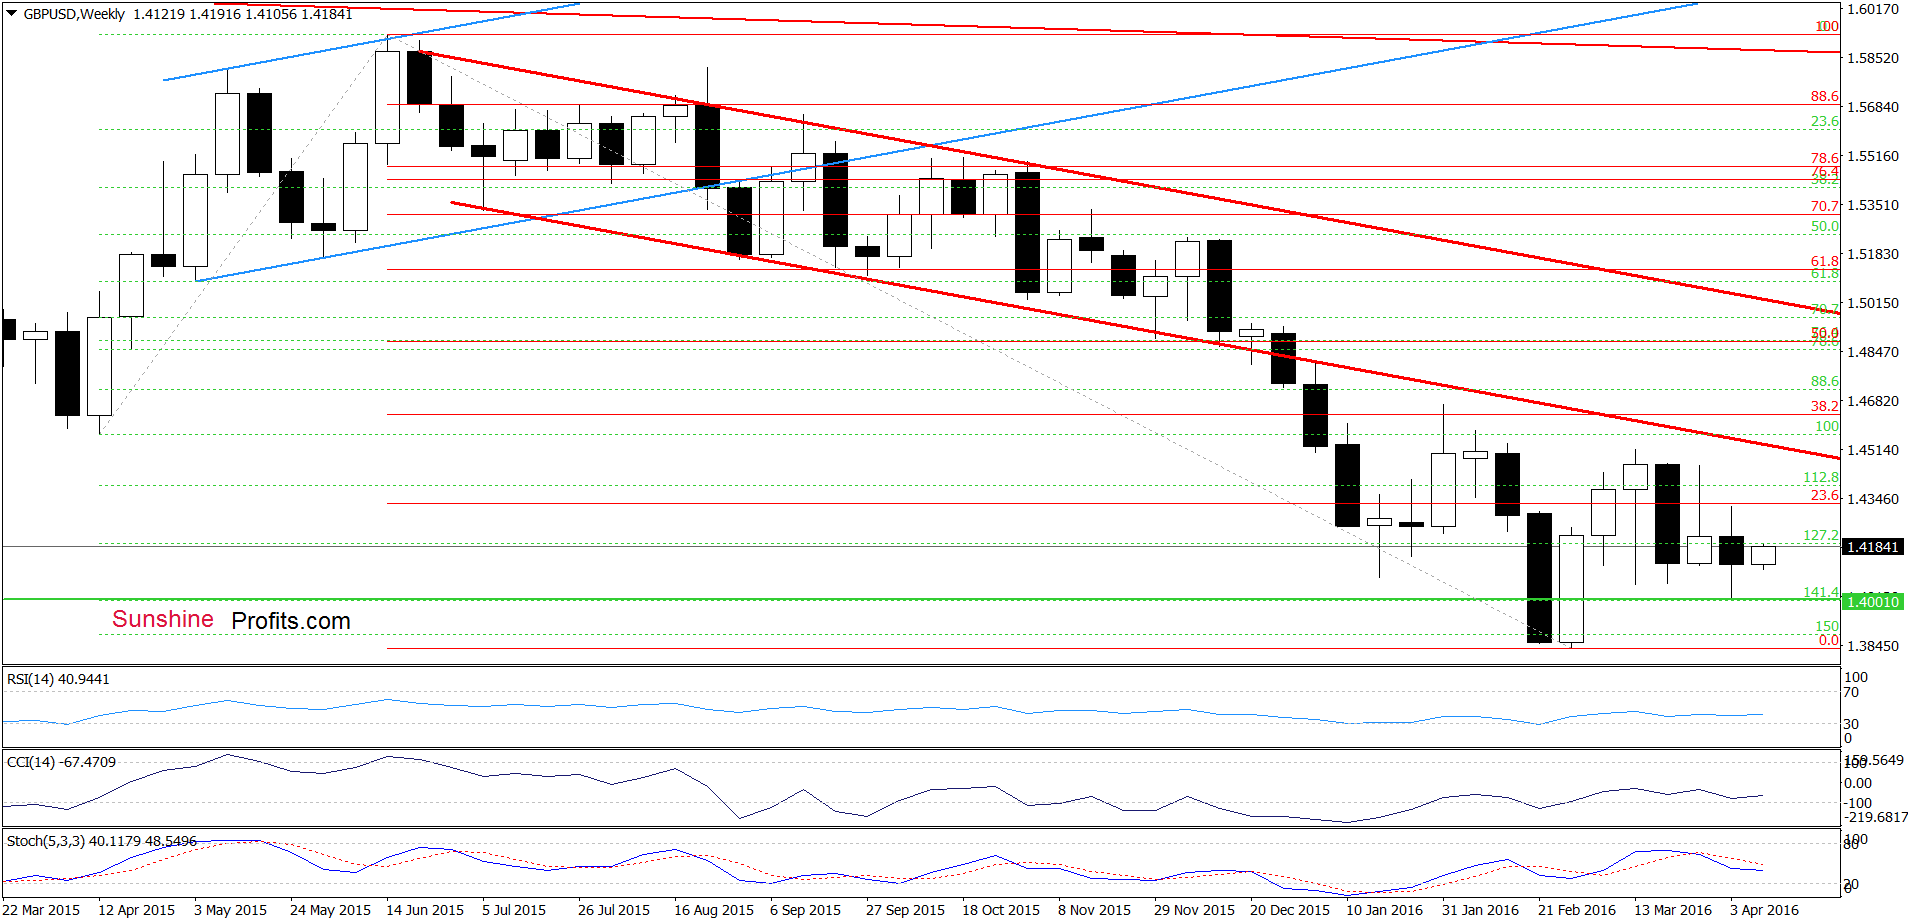
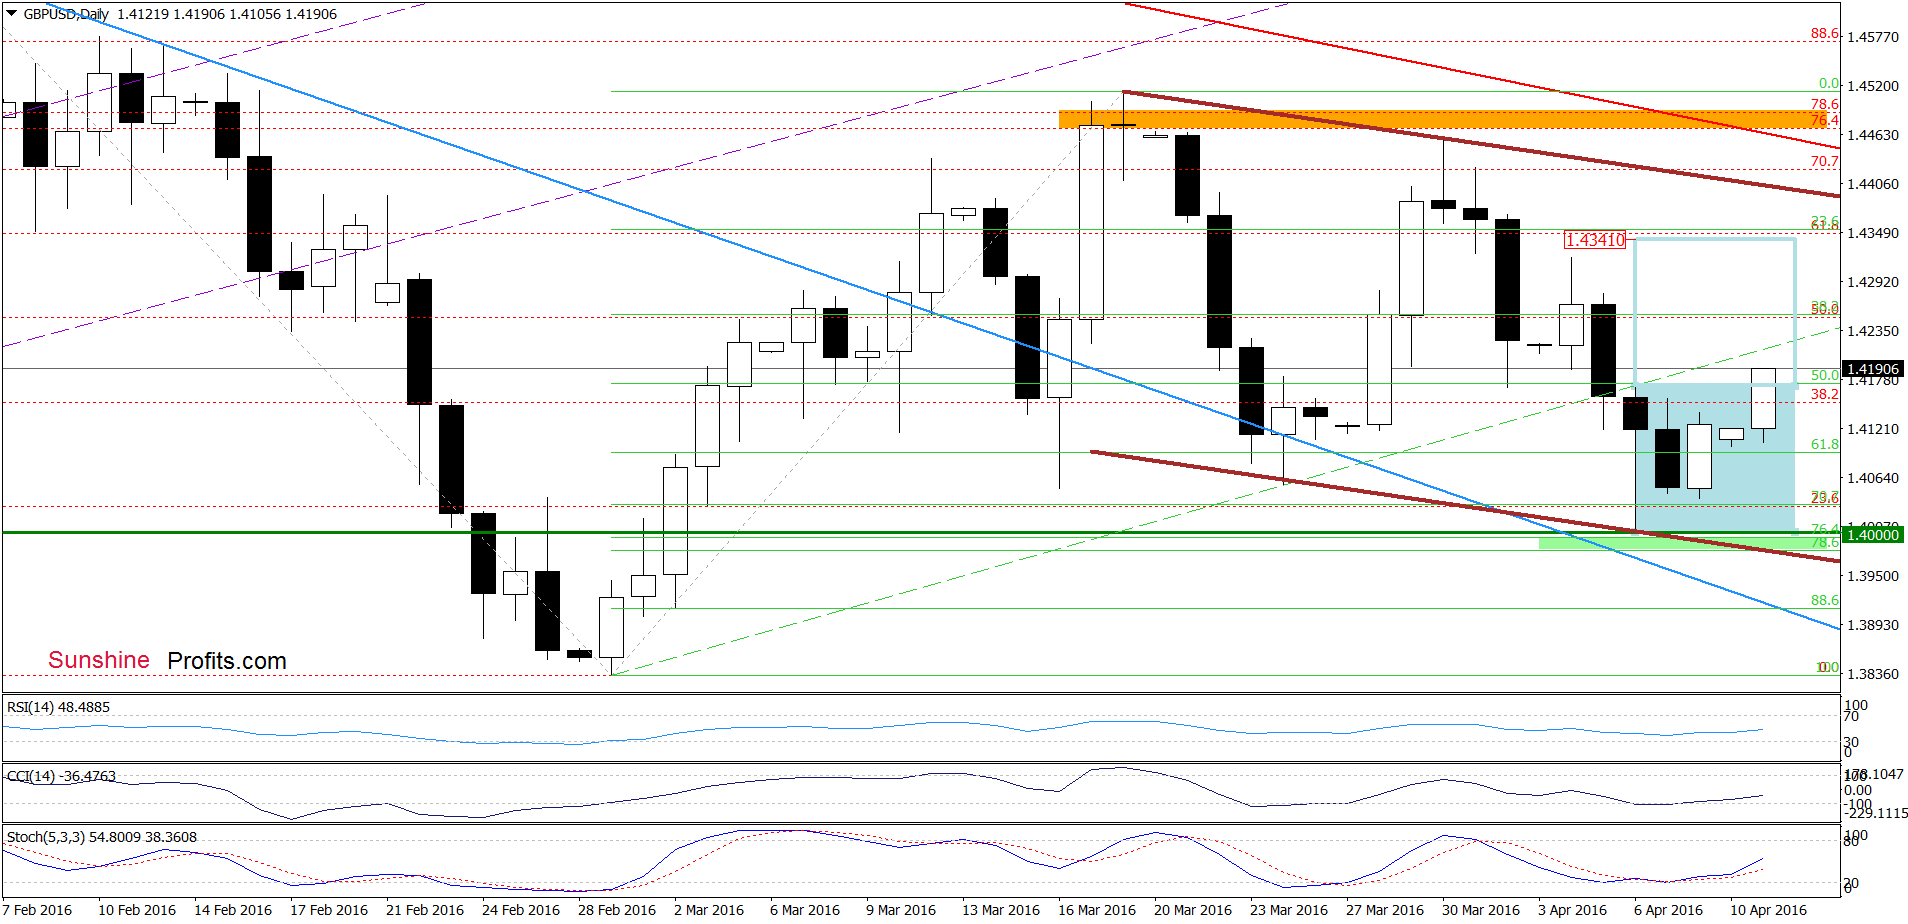
(…) GBP/USD tested the strength of the barrier of 1.4000, which resulted in a rebound yesterday. (…) the CCI and Stochastic Oscillator are oversold and very close to generating buy signals, which in combination with this solid support area will likely encourage currency bulls to act and we’ll see a reversal in near future.
From today’s point of view, we see that currency bulls pushed GBP/USD higher as we had expected. As you see on the daily chart, the exchange rate extended gains and climbed above the upper border of the blue consolidation, which is a bullish signal that suggests further improvement (especially when we factor in buy signals generated by the CCI and Stochastic Oscillator). How high could the pair go in the coming days? Taking into account the breakout above the upper line of the formation, it seems that GBP/USD could increase to around 1.4341, where the size of the move will correspond to the height of the consolidation. Nevertheless, this improvement will be more likely if the exchange rate invalidates earlier breakdown under the green dashed line, which serves as the nearest resistance.
Very short-term outlook: mixed with bullish bias
Short-term outlook: mixed with bullish bias
MT outlook: mixed
LT outlook: mixed
Trading position (short-term; our opinion): No positions are justified from the risk/reward perspective at the moment. We will keep you informed should anything change, or should we see a confirmation/invalidation of the above.
USD/JPY
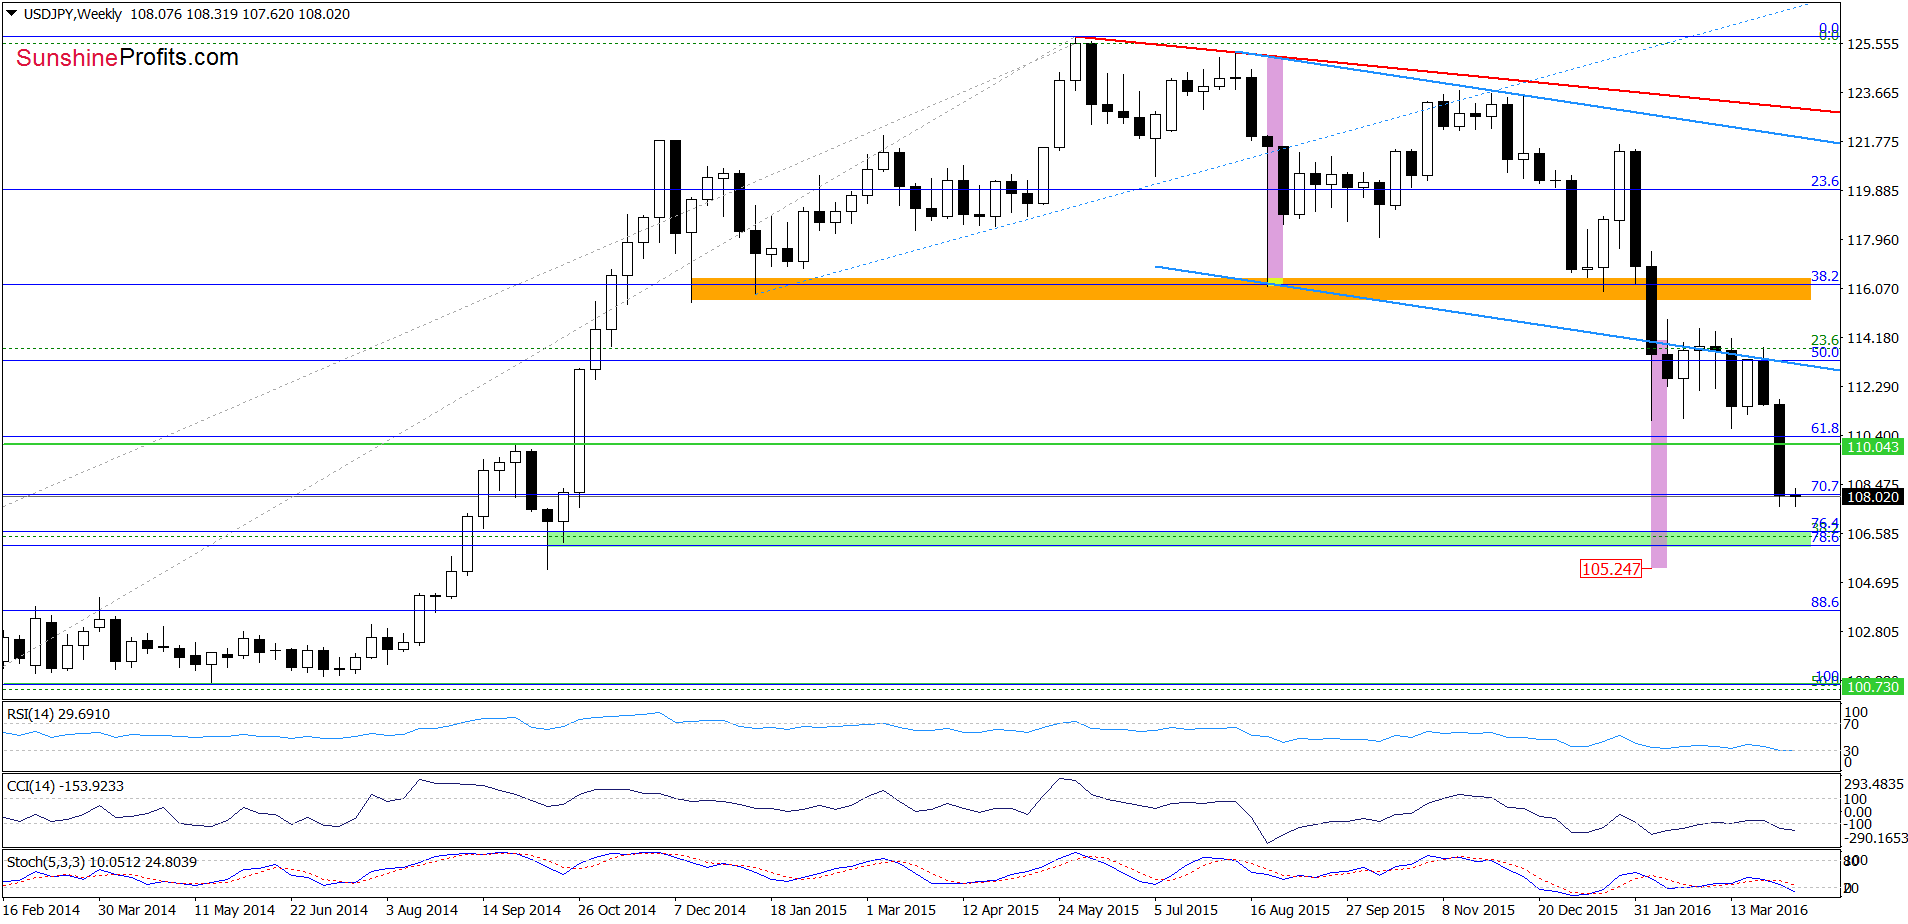
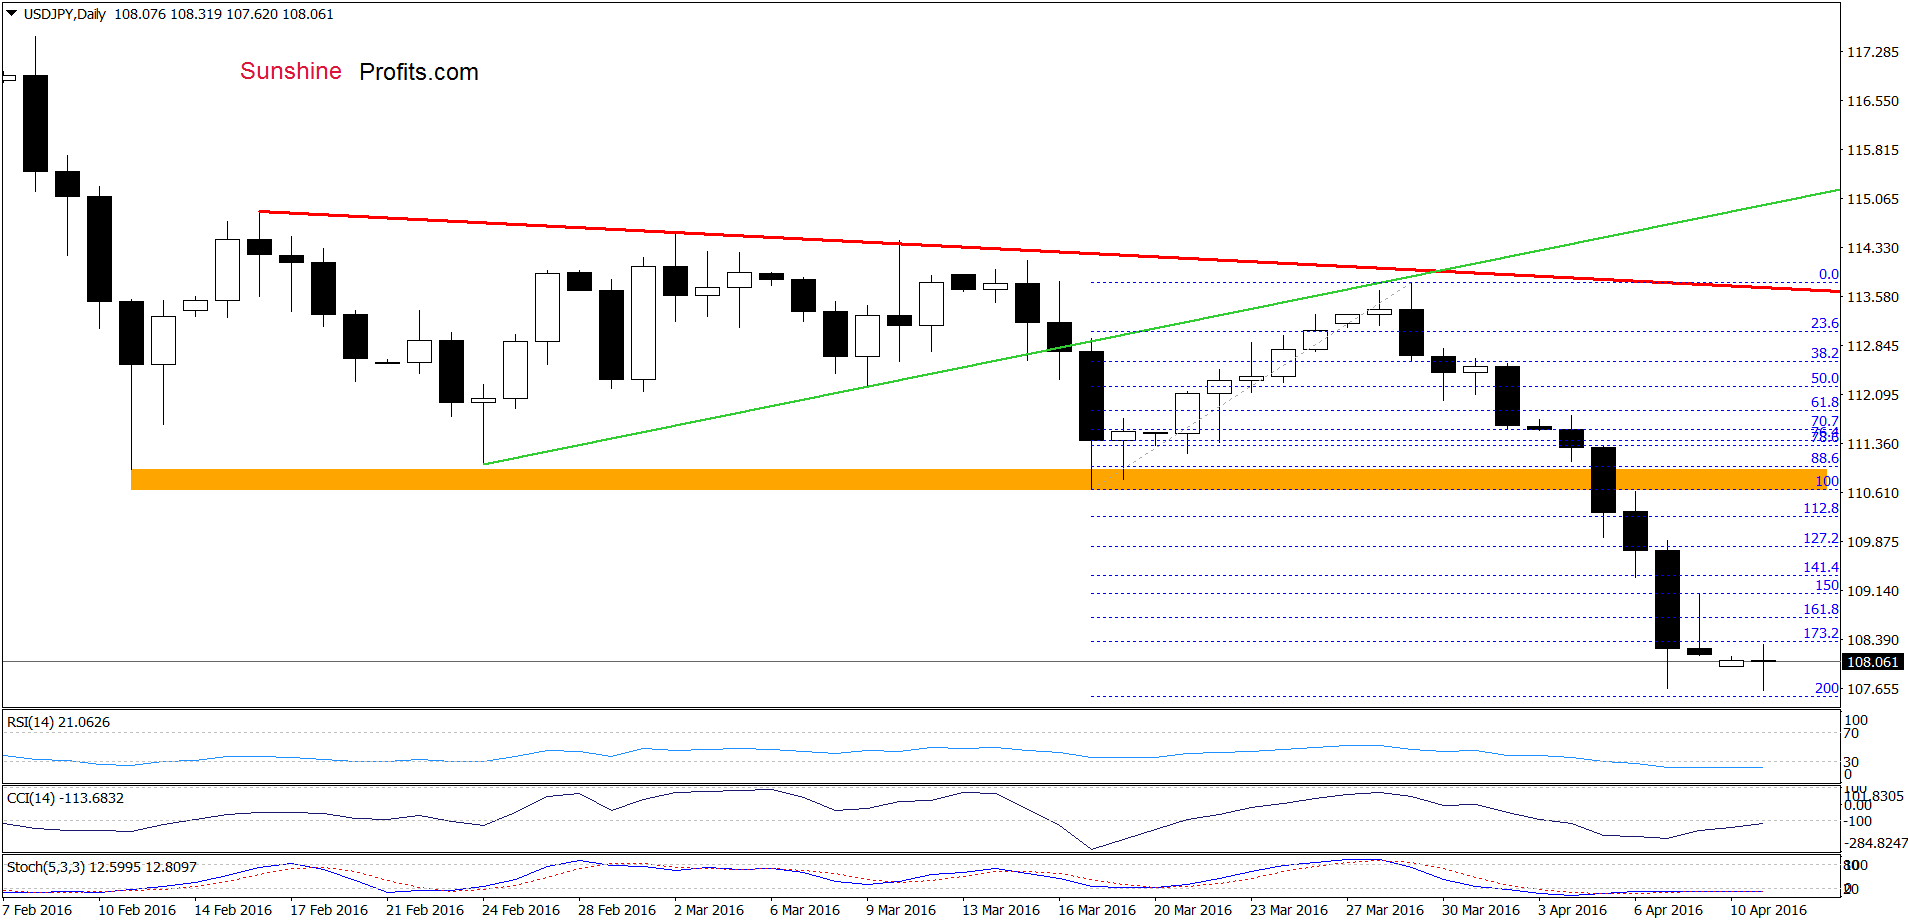
On the daily chart we see that USD/JPY approached the 200% Fibonacci extension, which in combination with the current position of the indicators (they are all oversold) suggests that we may see a rebound in the coming days. Nevertheless as long as there are no buy signals, another attempt to move lower is likely – especially when we take into account the medium-term picture (sell signals are still in play). Therefore, we should keep in mind what we wrote on Thursday:
(…) What’s next? The current position of the daily and weekly indicators suggests that the space for declines may be limited. However, when we take into account breakdown under the lower border of the blue declining trend channel (marked on the weekly chart), it seems that the exchange rate could drop to the green support zone (created by the 76.4% and 78.6% Fibonacci retracements around 106.05-106.62) or even to 105.25, where the size of the downward move will correspond to the height of the trend channel.
Very short-term outlook: mixed with bearish bias
Short-term outlook: mixed
MT outlook: mixed
LT outlook: mixed
Trading position (short-term; our opinion): No positions are justified from the risk/reward perspective at the moment. We will keep you informed should anything change, or should we see a confirmation/invalidation of the above.
USD/CAD
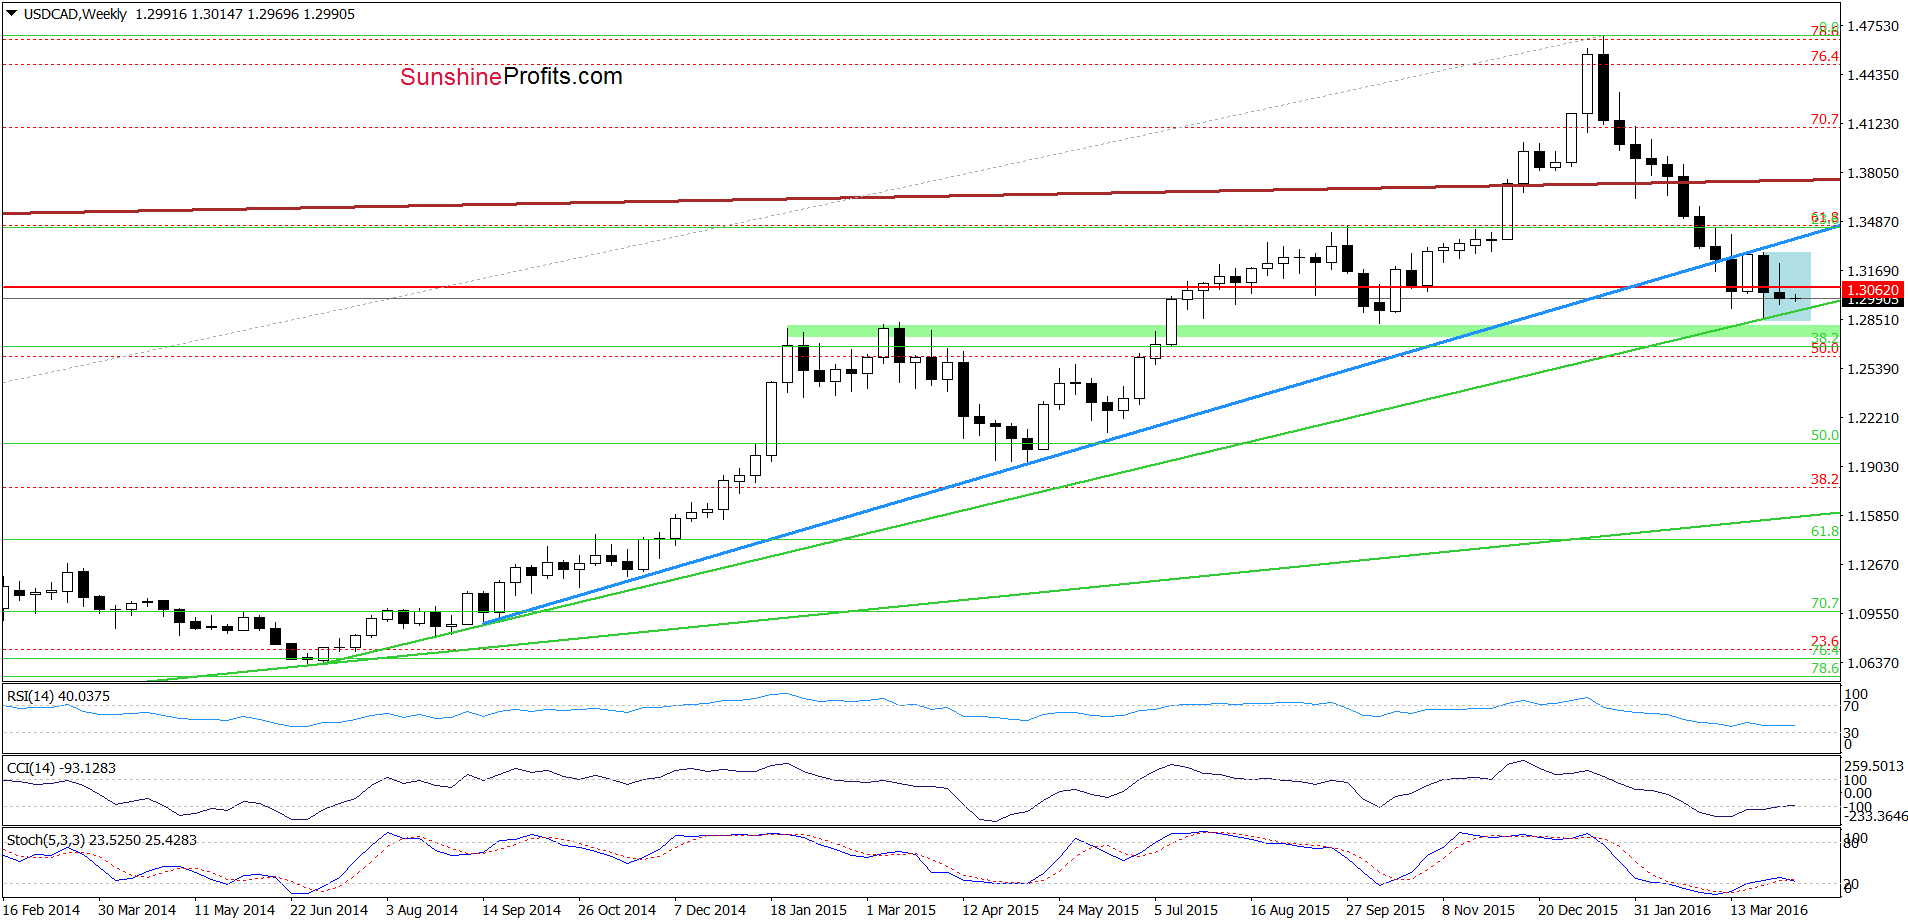
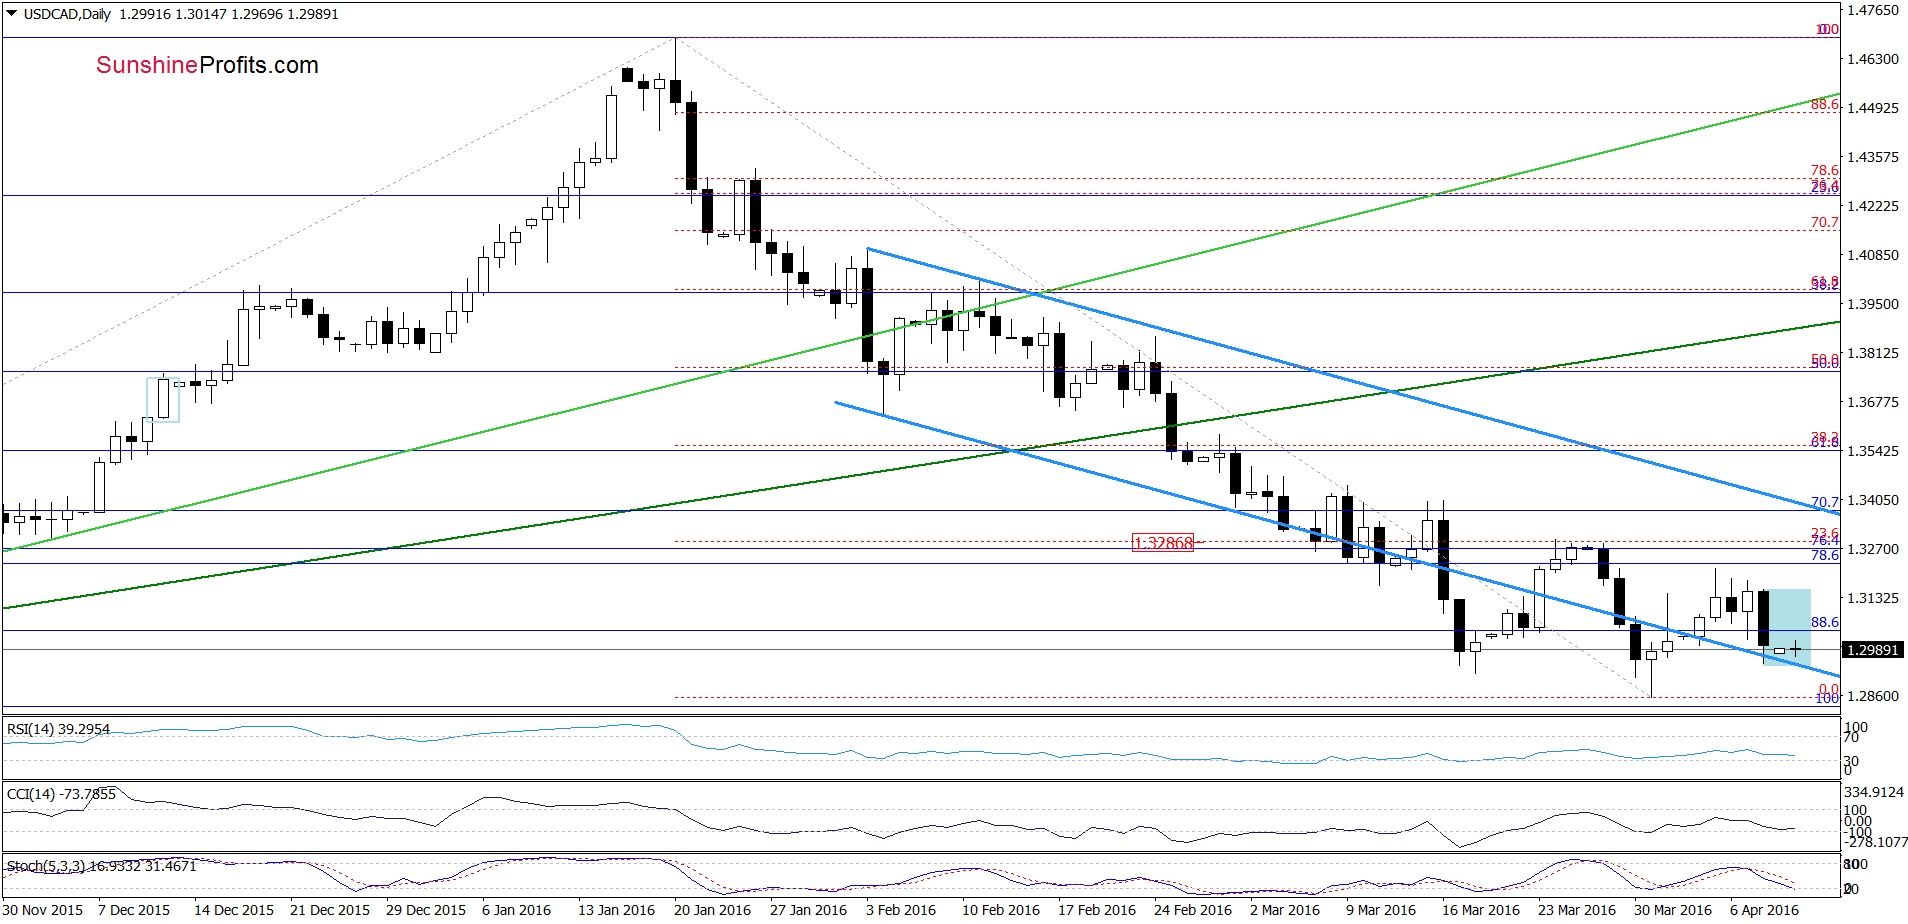
Looking at the above charts, we see that USD/CAD is consolidating (marked with blue) slightly above the lower border of the blue declining trend channel (marked on the daily chart), the long-term green support line and the green support zone (seen on the weekly chart), which suggests that a breakout above the upper line of the formation (or a breakdown below the lower border) will indicate the direction of another bigger upward/downward move. Nevertheless, we should keep in mind that daily indicators are almost overbought, while the weekly CCI and Stochastic Oscillator generated buy signals, which suggests that the space for declines may be limited. If this is the case, reversal in the coming week should not surprise us.
Very short-term outlook: mixed
Short-term outlook: mixed
MT outlook: mixed
LT outlook: mixed
Trading position (short-term; our opinion): No positions are justified from the risk/reward perspective at the moment. We will keep you informed should anything change, or should we see a confirmation/invalidation of the above.
USD/CHF
On Apr 1, we wrote the following:
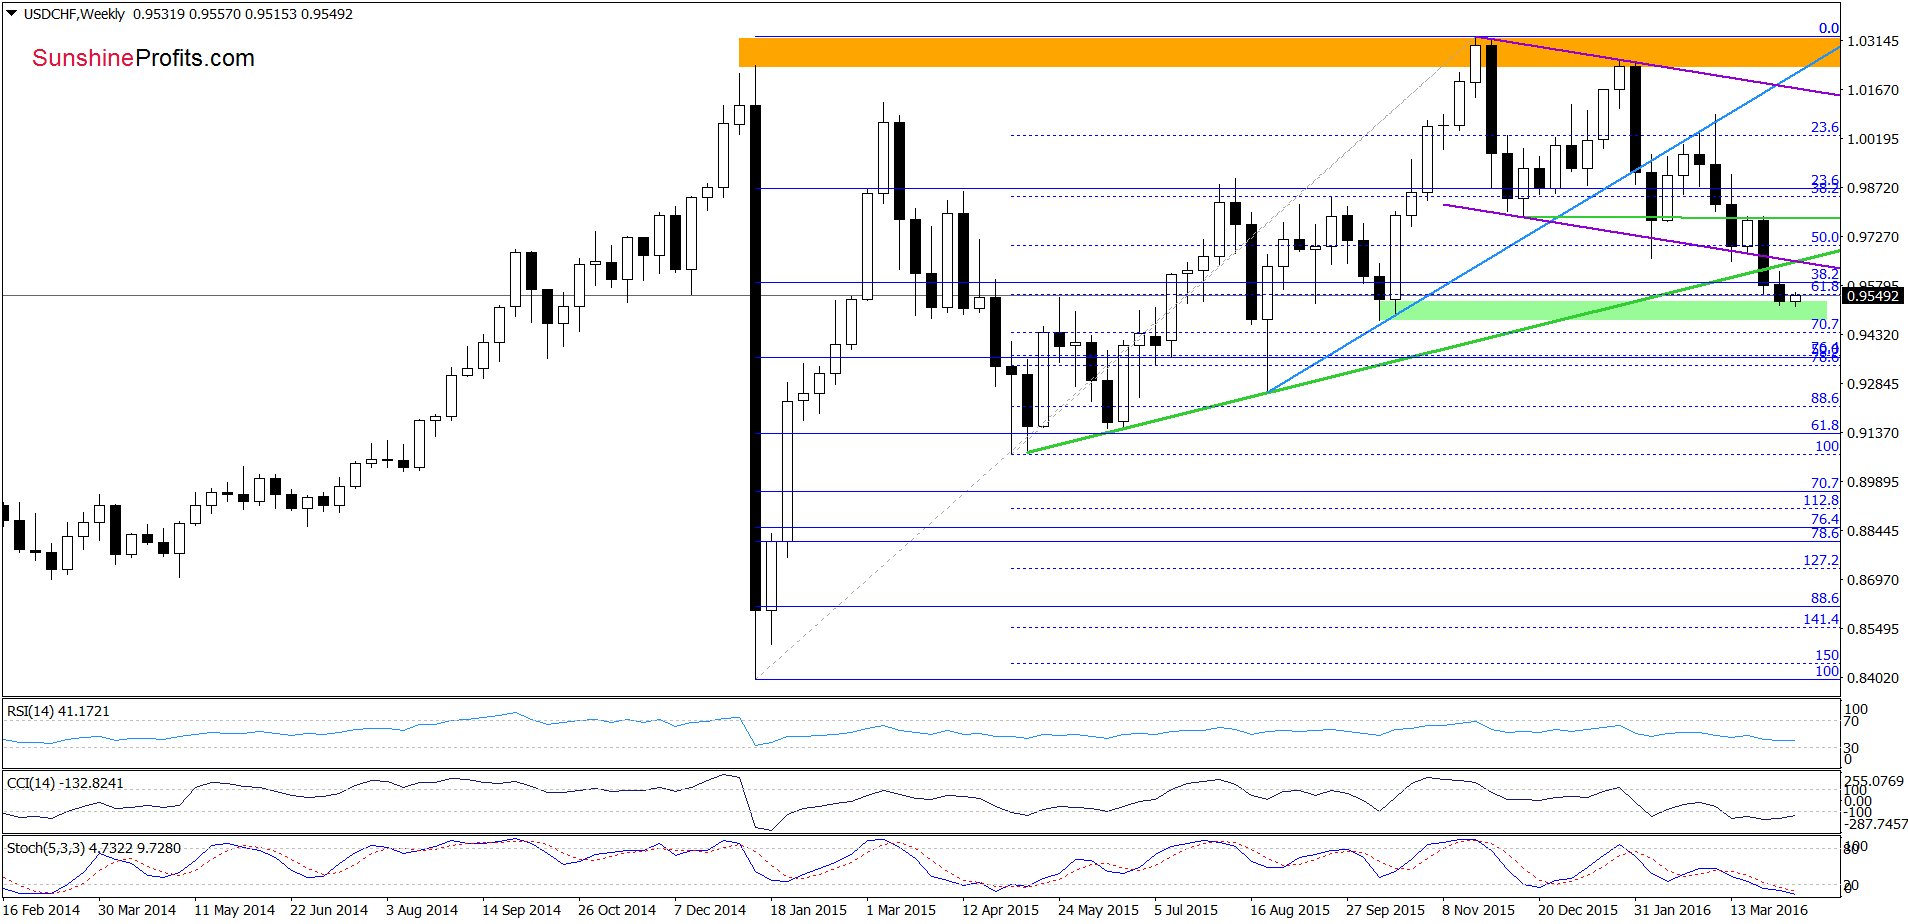
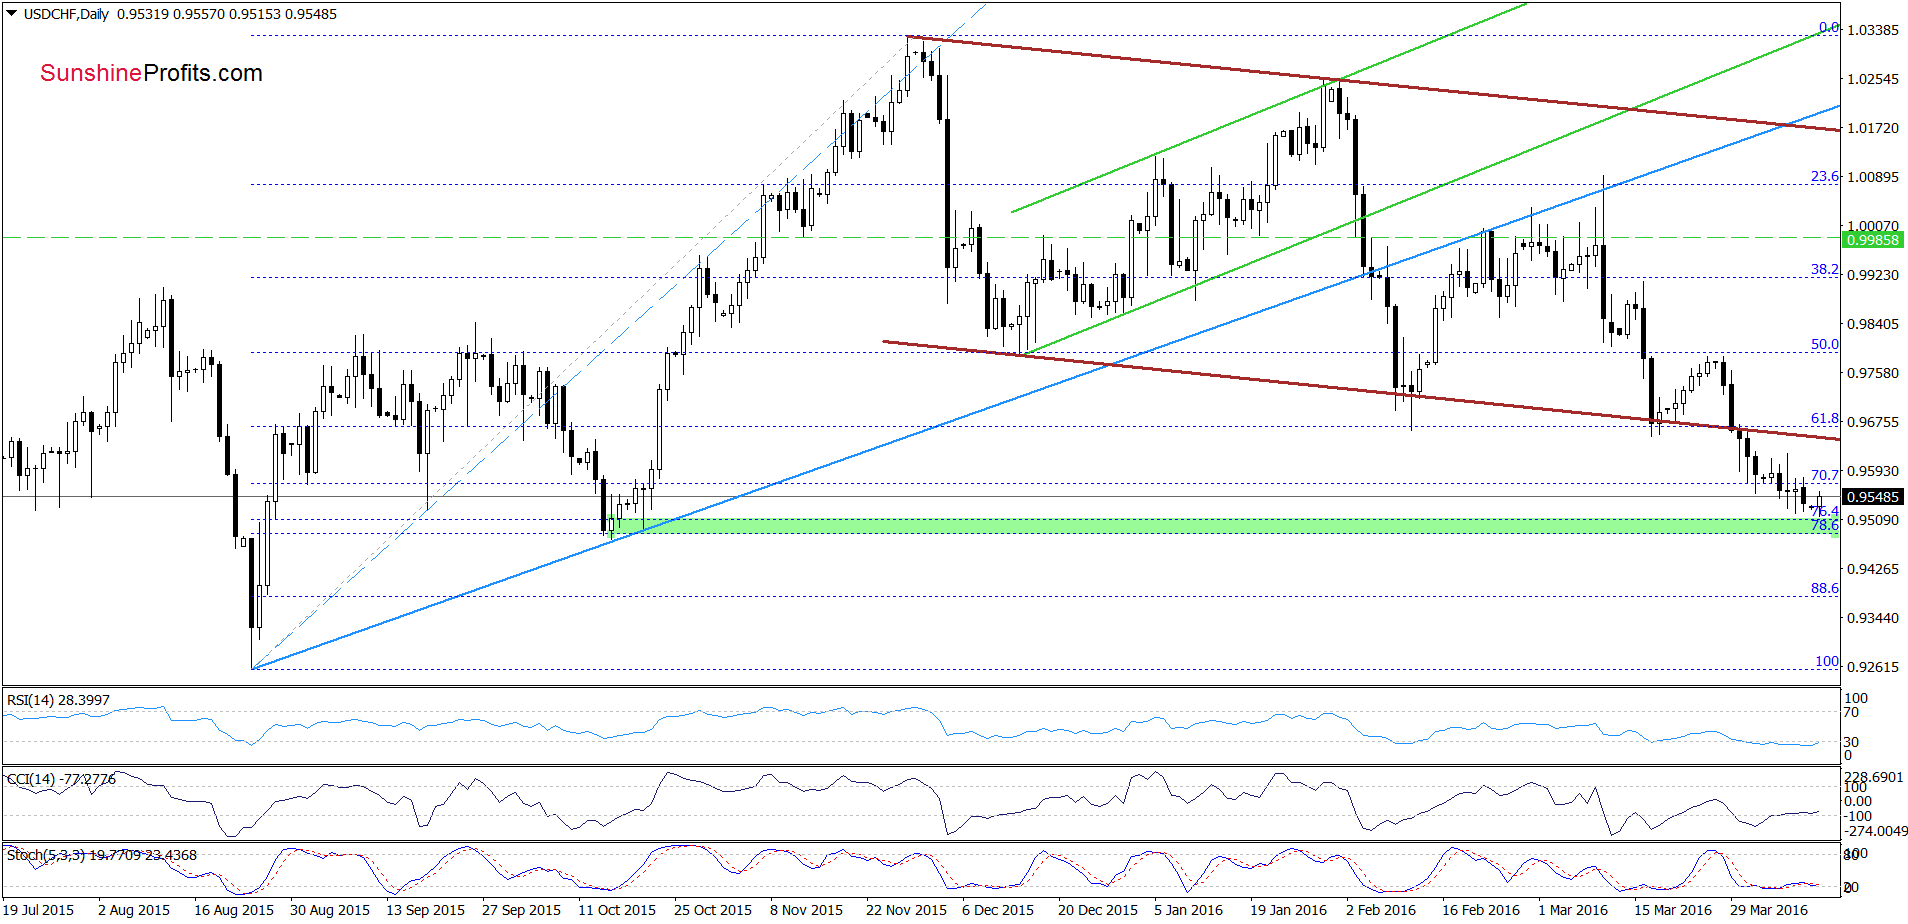
(…) sell signals generated by the indicators remain in place, suggesting further drops. If this is the case, and the exchange rate moves lower once again, the next downside target would be the green support zone marked on the daily chart (created by the 76.4% and 78.6% Fibonacci retracement levels based on entire Aug-Nov upward move).
Looking at the above charts, we see that the situation developed in line with the above scenario and USD/CHF approached our downside target earlier today. Taking this fact into account, and combining it with the current position of the daily indicators (they are oversold and very close to generating buy signals), we think that reversal is just around the corner. Nevertheless, we should keep in mind that the pair is still trading under the lower border of the brown declining trend channel and the green support/resistance line (marked on the weekly chart), which means that as long as there won’t be invalidation of the breakdown under these lines further improvement is questionable.
Very short-term outlook: mixed with bullish bias
Short-term outlook: mixed with bullish bias
MT outlook: mixed
LT outlook: mixed
Trading position (short-term; our opinion): No positions are justified from the risk/reward perspective. We will keep you informed should anything change, or should we see a confirmation/invalidation of the above.
AUD/USD
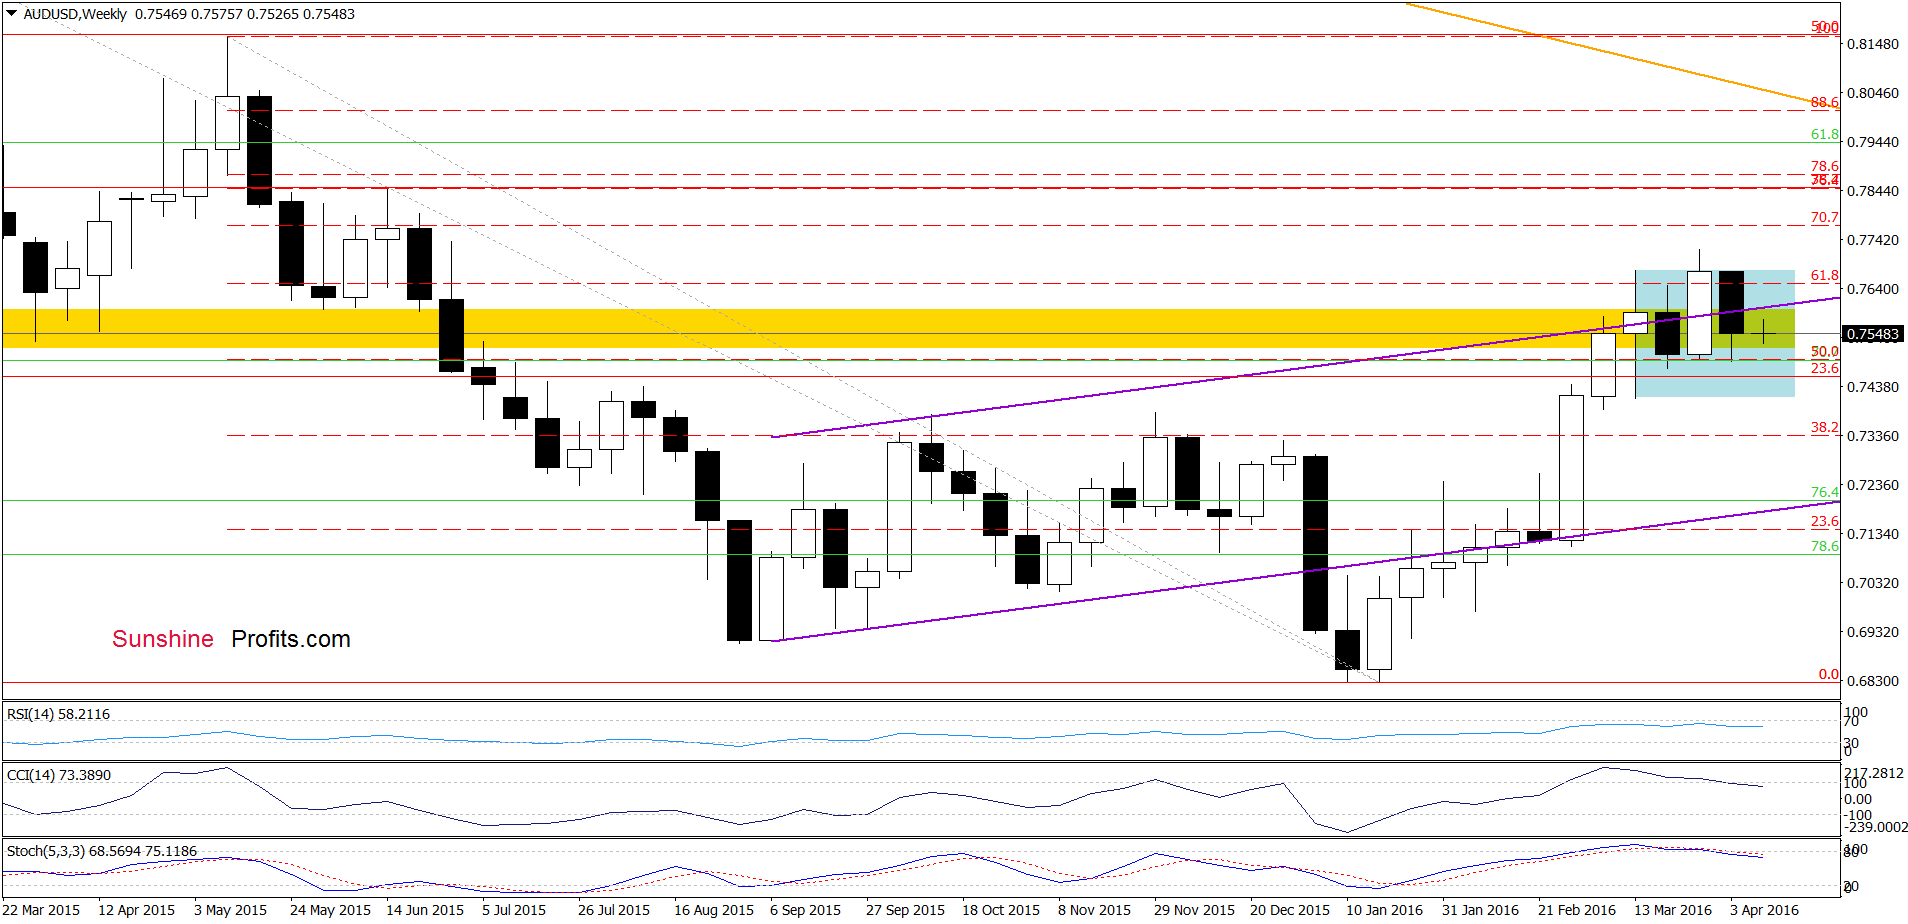
From the medium-term perspective we see that the overall situation hasn’t changed much as AUD/USD remains under the upper border of the purple rising trend channel. Therefore what we wrote on Wednesday is up-to date also today:
(…) the pair slipped under the upper border of the purple rising trend channel, which is a negative signal (an invalidation of the breakdown) that suggests further deterioration. However, in our opinion, it would be more bearish if we see a weekly closure below this line.
Having said the above, let’s check how this drop affected the very short-term picture.
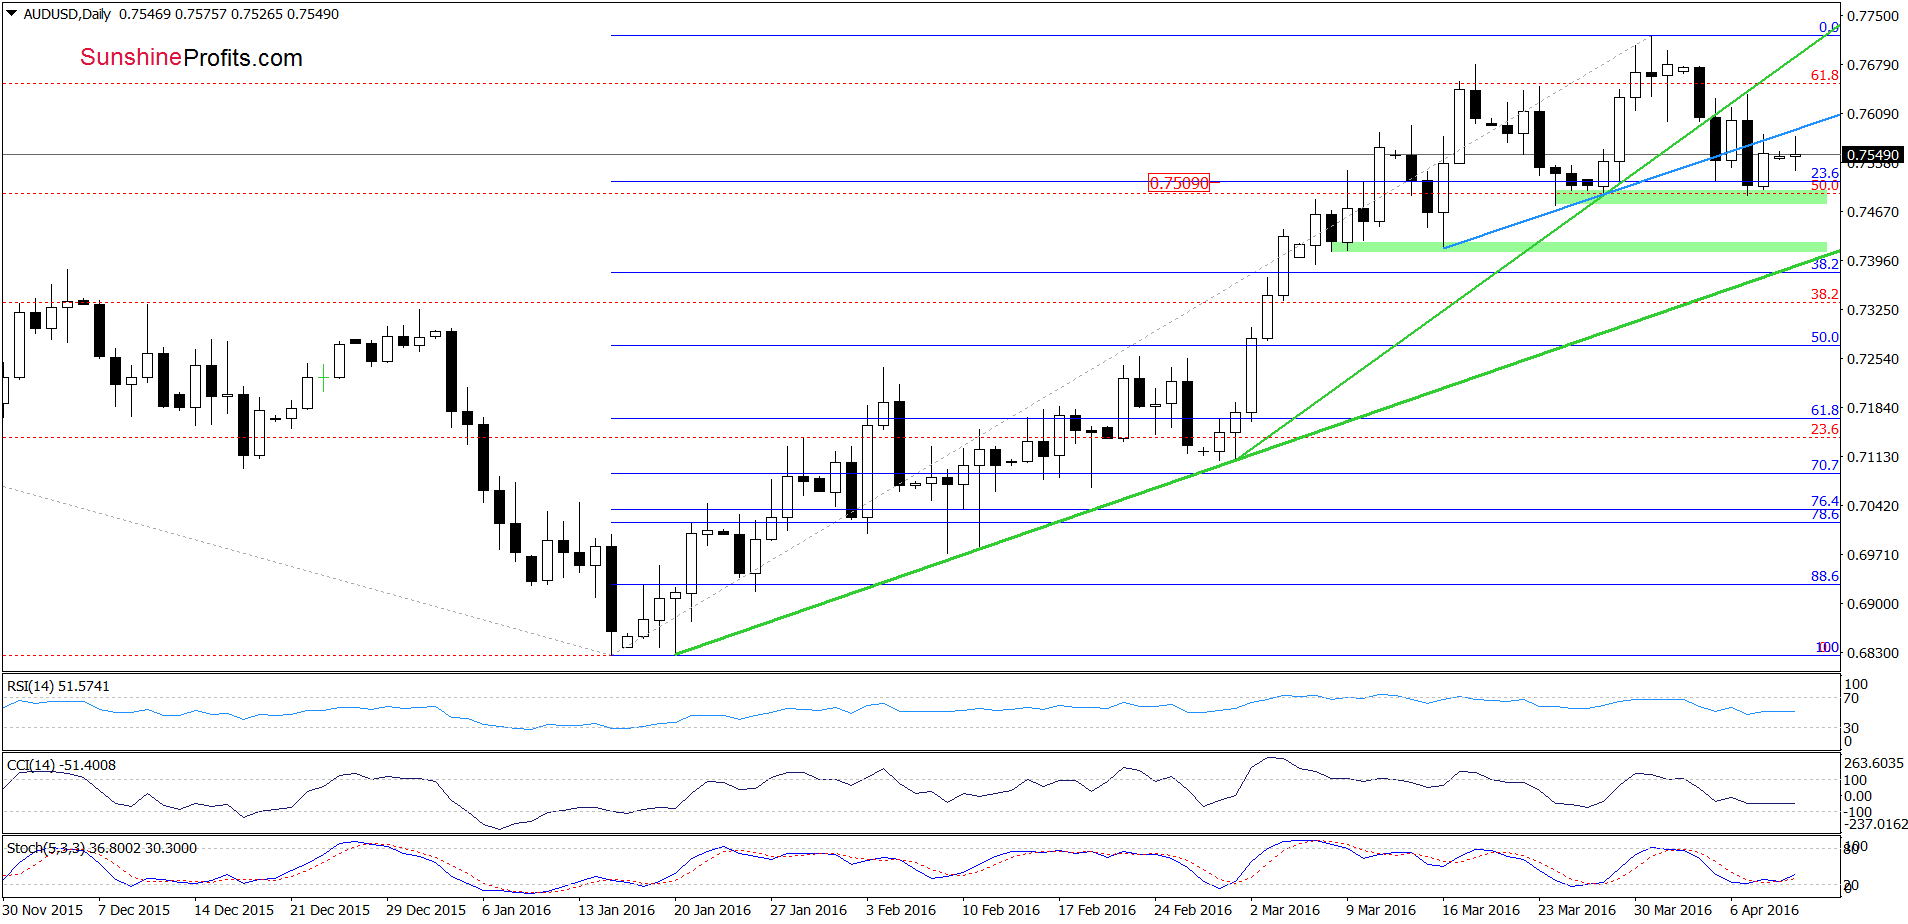
On the daily chart, we see that AUD/USD bounced off the 23.6% Fibonacci retracement and the green support zone (based on the bottom of the previous pullback) on Friday, which resulted in an increase to the blue resistance line. Nevertheless, we think that as long as there won’t be invalidation of the breakdown further improvement is questionable.
Very short-term outlook: mixed
Short-term outlook: mixed
MT outlook: mixed
LT outlook: mixed
Trading position (short-term; our opinion): No positions are justified from the risk/reward perspective. We will keep you informed should anything change, or should we see a confirmation/invalidation of the above.
Thank you.
Nadia Simmons
Forex & Oil Trading Strategist
Przemyslaw Radomski, CFA
Founder, Editor-in-chief
Gold & Silver Trading Alerts
Forex Trading Alerts
Oil Investment Updates
Oil Trading Alerts

