

The Australian dollar moved higher against the greenback after Chinese data showed that the Caixin services PMI for March rose to 52.2, beating analysts’ expatiation for an increase to 51.4. Thanks to these numbers, AUD/USD bounced off yesterday’s low and reached the first resistance line. Will we see further improvement in the coming days?
In our opinion the following forex trading positions are justified - summary:
- EUR/USD: short (stop-loss order at 1.1512; initial downside target at 1.0572)
- GBP/USD: none
- USD/JPY: none
- USD/CAD: none
- USD/CHF: none
- AUD/USD: none
EUR/USD
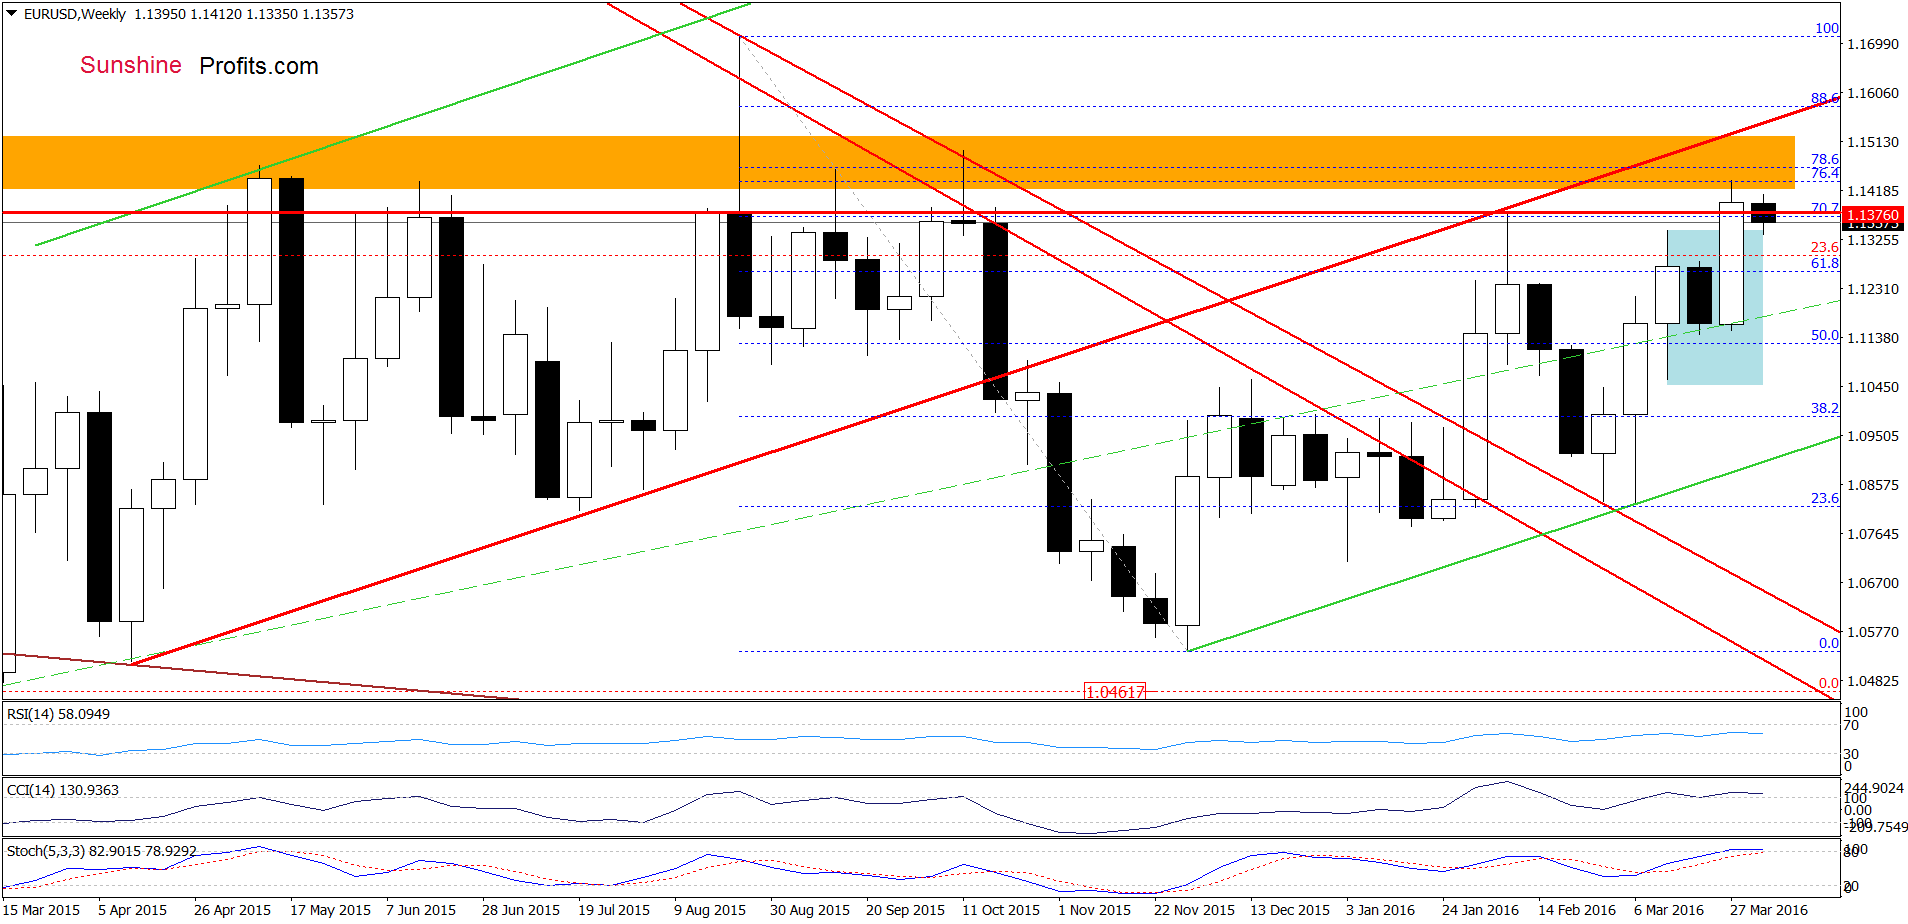
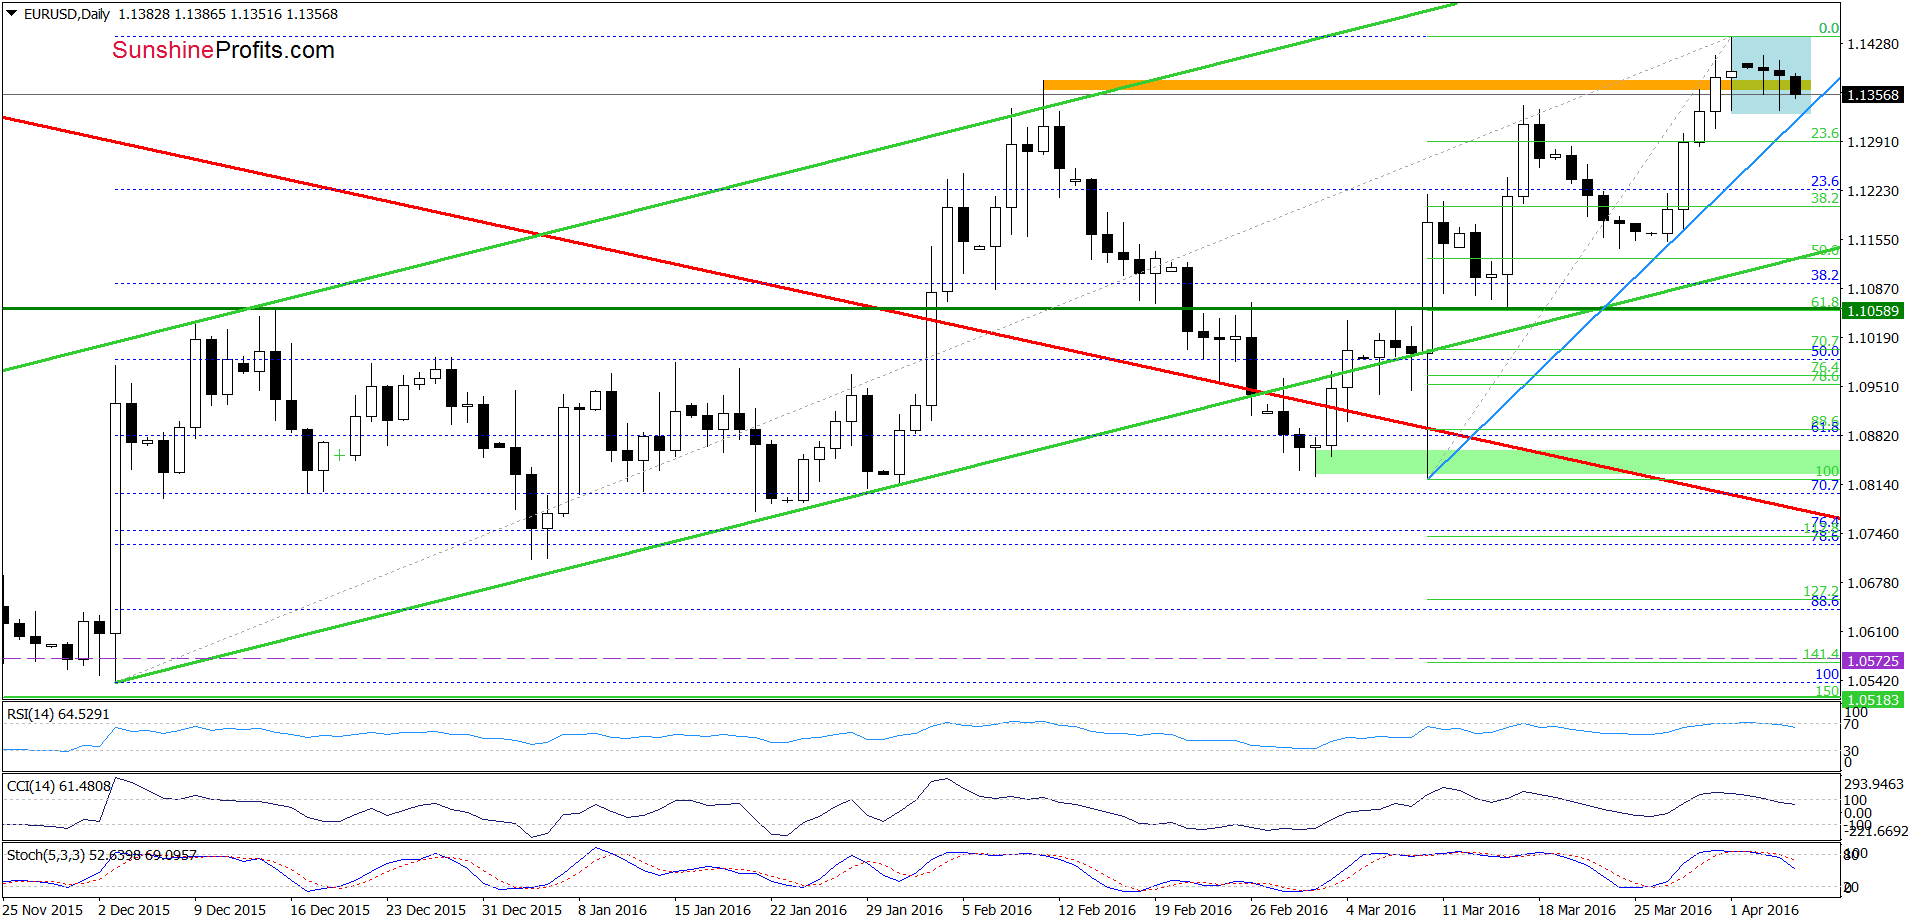
Looking at the above charts, we see that although EUR/USD moved little higher yesterday once again, currency bulls didn’t manage to push the pair higher, which resulted in another drop under the previously-broken Feb high earlier today. Although this is a negative signal (an invalidation of the breakout), we think that it would be more reliable if we see a daily closure below the orange area. Finishing today’s commentary on this currency pair, it is worth noting that all indicators generated sell signals ,which suggests that further deterioration is just around the corner. Nevertheless, such price action will be more likely if the exchange rate drops under the blue support line based on the previous lows and the lower border of the blue consolidation. In this case, the pair will likely accelerate declines and drop to around 1.1200, where the 38.2% Fibonacci retracement (based on the recent upward move) is.
Very short-term outlook: bearish
Short-term outlook: bearish
MT outlook: mixed with bearish bias
LT outlook: mixed
Trading position (short-term; our opinion): Short positions (with a stop-loss order at 1.1512 and the initial downside target at 1.0572) are justified from the risk/reward perspective. We will keep you informed should anything change, or should we see a confirmation/invalidation of the above.
USD/CHF
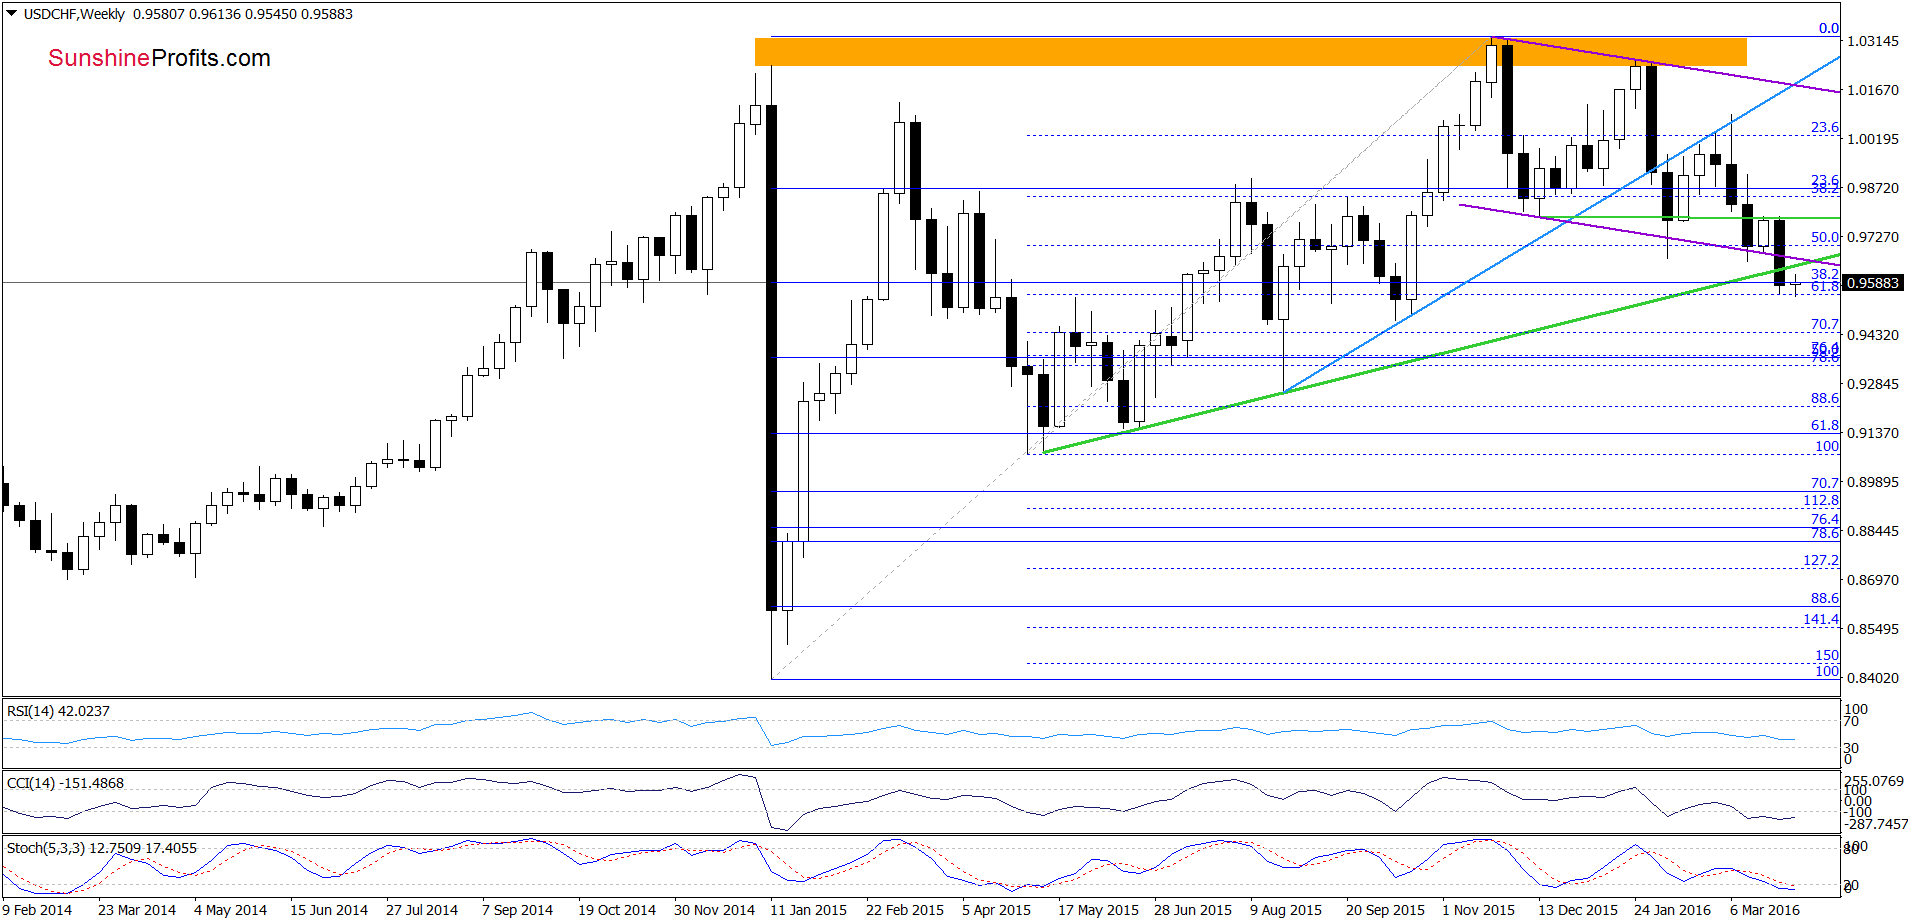
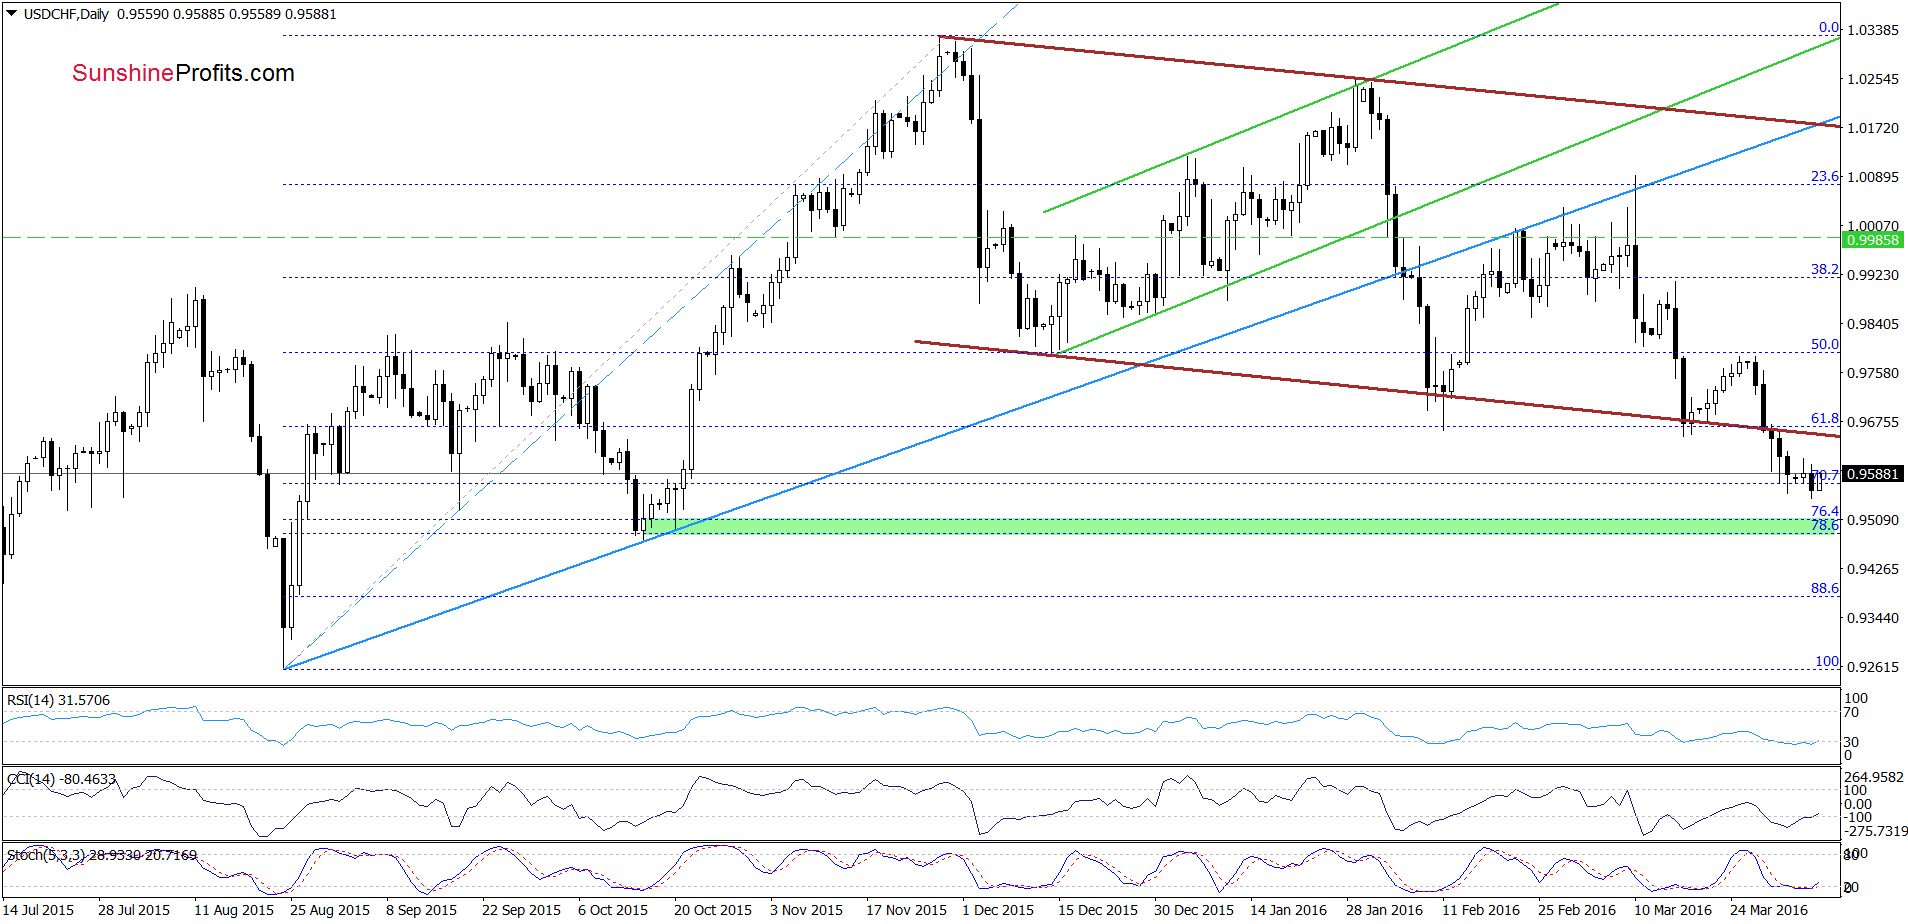
Looking at the above charts, we see that although USD/CHF rebounded slightly earlier today, the pair is still trading under the lower border of the brown declining trend channel and the green support/resistance line (marked on the weekly chart), which means that as long as there won’t be invalidation of the breakdown under these lines all upswing could be just a verification of earlier breakdown. Nevertheless, buy signals generated by the indicators suggests that currency bulls will try to push the pair higher in the coming days. If this is the case, and we’ll see further improvement, the initial upside target would be around 0.9657, where the lower border of the brown trend channel is.
Very short-term outlook: mixed with bullish bias
Short-term outlook: mixed with bullish bias
MT outlook: mixed
LT outlook: mixed
Trading position (short-term; our opinion): No positions are justified from the risk/reward perspective. We will keep you informed should anything change, or should we see a confirmation/invalidation of the above.
AUD/USD
Quoting our Monday’s alert:
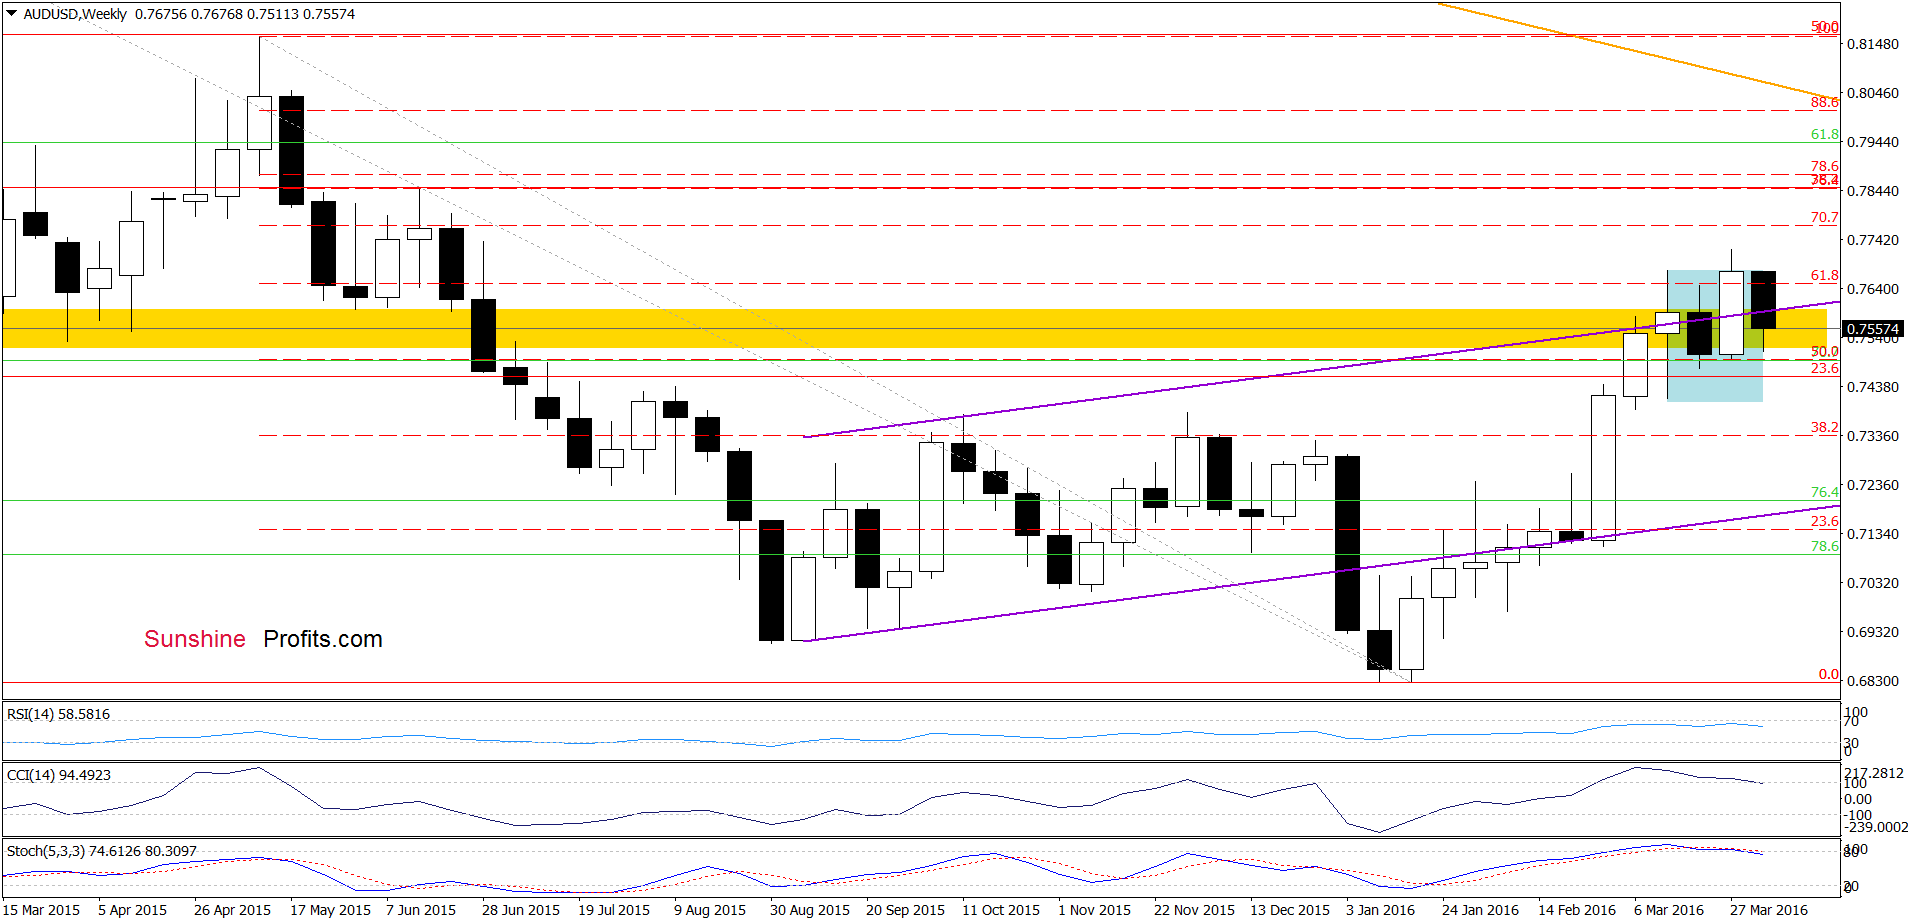
(…) the exchange rate invalidated earlier small breakout above the upper line of the formation, which pushed AUD/USD to the previously-broken upper line of the purple rising trend channel. On one hand, the pair could rebound from here; however, there are negative divergences between the CCI, Stochastic Oscillator and the exchange rate, which is a negative signal. Additionally, all indicators are very close to generating sell signal, which suggests that reversal may be just around the corner.
As you see on the weekly chart, the situation developed in line with the above scenario and AUD/USD moved lower. With this downswing, the pair slipped under the upper border of the purple rising trend channel, which is a negative signal (an invalidation of the breakdown) that suggests further deterioration. However, in our opinion, it would be more bearish if we see a weekly closure below this line.
Having said the above, let’s check how this drop affected the very short-term picture.
On Monday, we wrote:
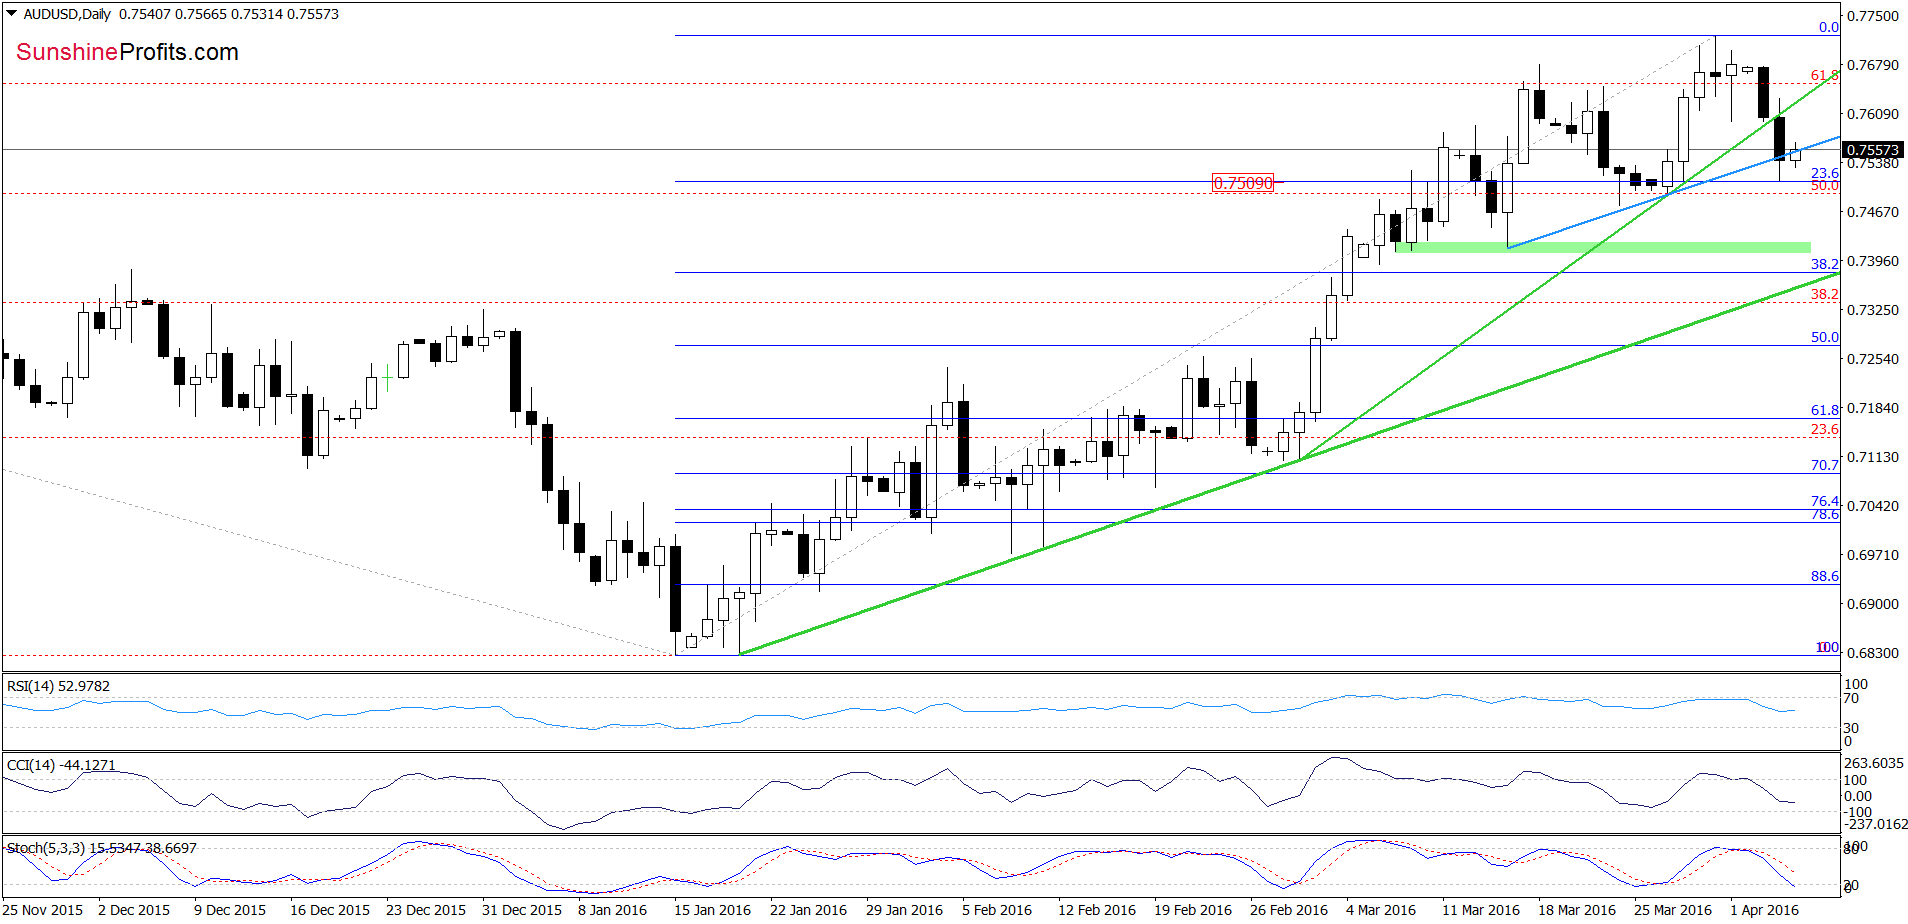
(…) today’s downswing approached the pair to the green support line based on the previous lows, which could trigger a test of recent high. Nevertheless, the current position of the daily indicators suggests that currency bears will show their claws in the coming weeks. If this is the case and the exchange rate declines under the green line, the initial downside target would be around 0.7509, where the 23.6% Fibonacci retracement and late-March lows are.
From today’s point of view, we see that AUD/USD moved lower as we had expected and reached our initial downside target. As you see, the Fibonacci retracement encouraged currency bulls to act, which resulted in a small rebound earlier today. Despite this move, the exchange rate remains under the previously-broken blue and green lines, which serve now as resistance. Additionally, sell signals remain in place, which in combination with the medium-term picture suggests another attempt to move lower and a re-test of the 23.6% Fibonacci retracement in the coming days.
Very short-term outlook: mixed with bearish bias
Short-term outlook: mixed
MT outlook: mixed
LT outlook: mixed
Trading position (short-term; our opinion): No positions are justified from the risk/reward perspective. We will keep you informed should anything change, or should we see a confirmation/invalidation of the above.
Thank you.
Nadia Simmons
Forex & Oil Trading Strategist
Przemyslaw Radomski, CFA
Founder, Editor-in-chief
Gold & Silver Trading Alerts
Forex Trading Alerts
Oil Investment Updates
Oil Trading Alerts

