

Earlier today, the USD Index moved little higher after yesterday’s comments from Federal Reserve Board Chair Janet Yellen supported the greenback (Yellen said that the central bank is on track to gradually raise interest rates if the economy continued to evolve as expected). As a result, EUR/USD slipped under support line, but what happened at the same time with USD/CHF and AUD/USD?
In our opinion the following forex trading positions are justified - summary:
- EUR/USD: short (stop-loss order at 1.1512; initial downside target at 1.0572)
- GBP/USD: none
- USD/JPY: none
- USD/CAD: none
- USD/CHF: none
- AUD/USD: none
EUR/USD
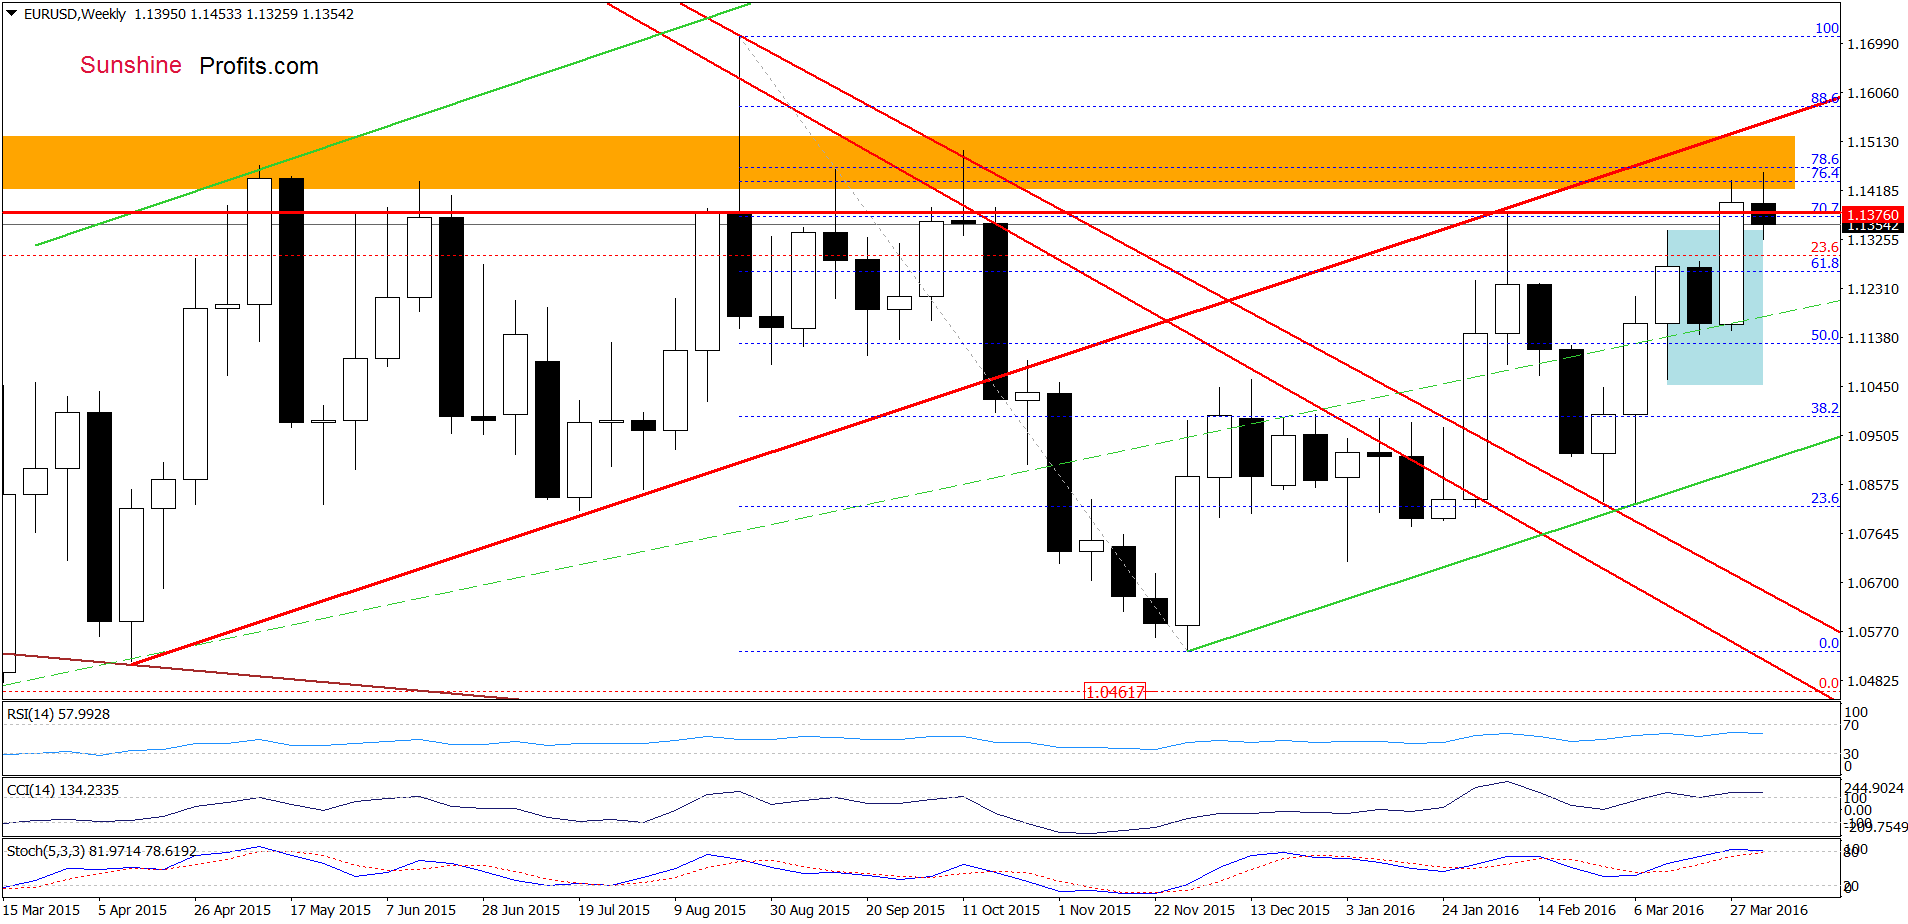
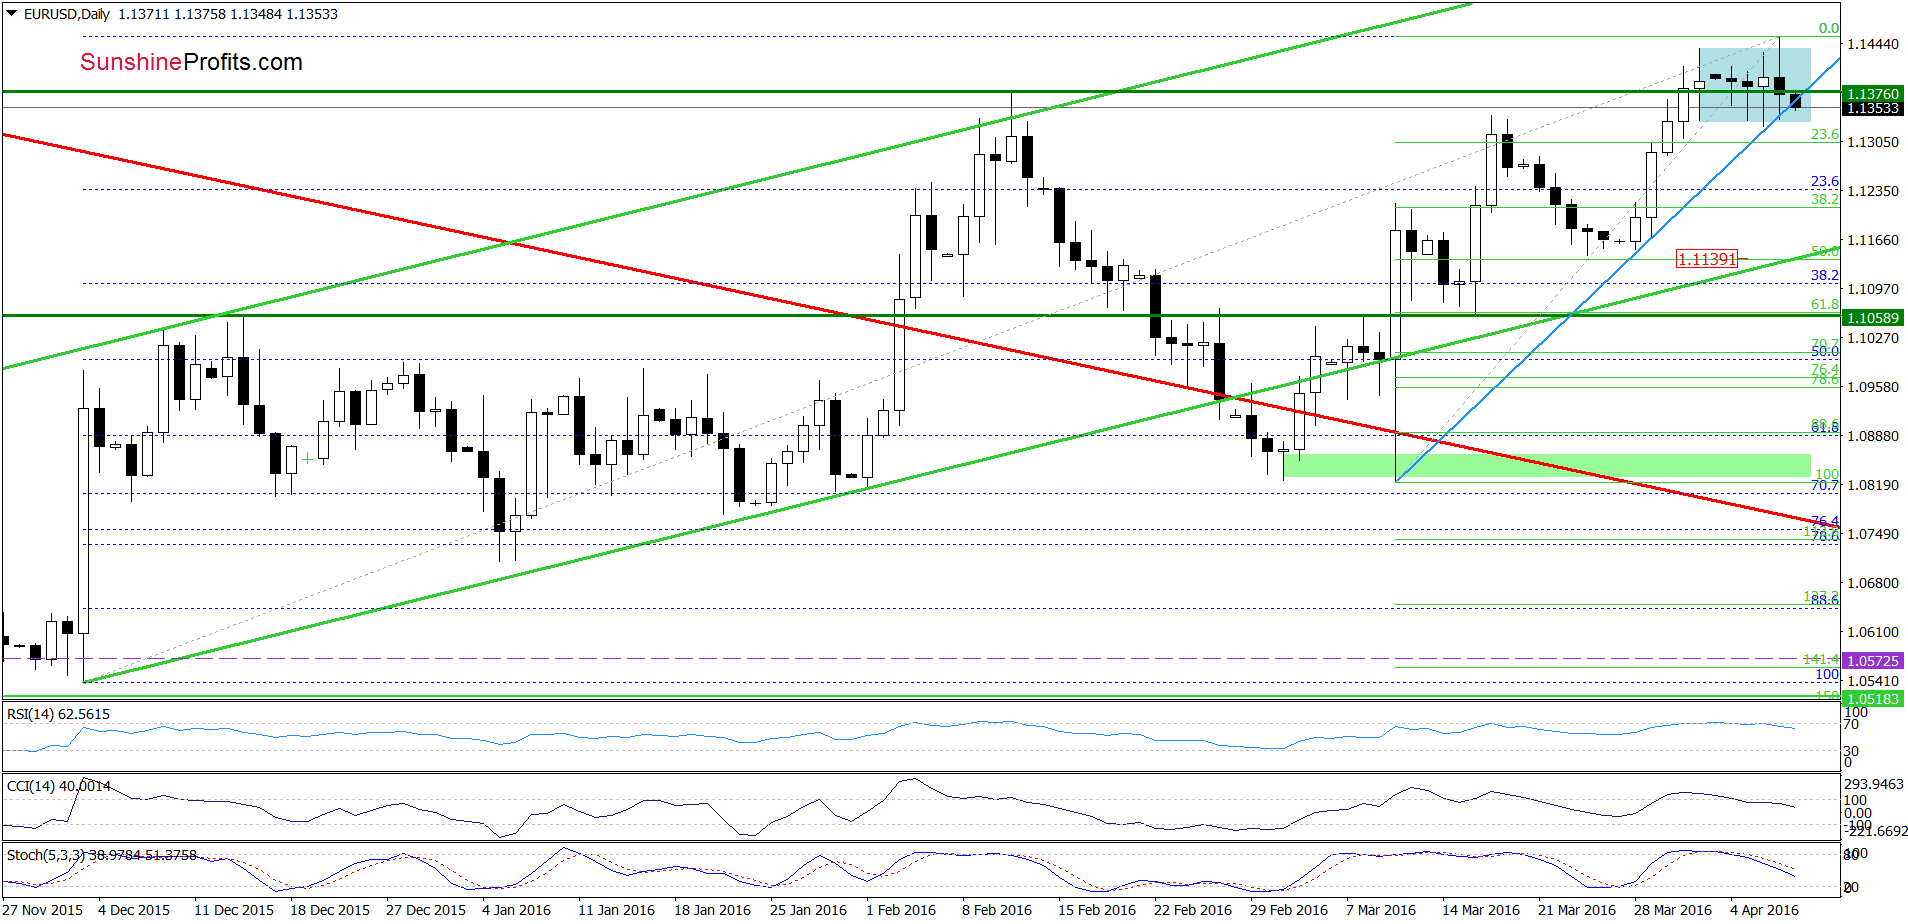
Looking at the above charts, we see that the overall situation hasn’t changed much as EUR/USD is still trading in the blue consolidation. Although the exchange rate slipped under the Feb high once again earlier today, we saw similar price action several times in recent days. Therefore, in our opinion, this potentially negative signal (an invalidation of the breakout), would be more reliable if we see a daily closure below the green horizontal line. Nevertheless, further declines will be more likely if the exchange rate closes the day under the blue support line based on the previous lows and the lower border of the blue consolidation. In this case, the pair will likely accelerate declines and drop to around 1.1200, where the 38.2% Fibonacci retracement (based on the recent upward move) is.
Very short-term outlook: bearish
Short-term outlook: bearish
MT outlook: mixed with bearish bias
LT outlook: mixed
Trading position (short-term; our opinion): Short positions (with a stop-loss order at 1.1512 and the initial downside target at 1.0572) are justified from the risk/reward perspective. We will keep you informed should anything change, or should we see a confirmation/invalidation of the above.
USD/CHF
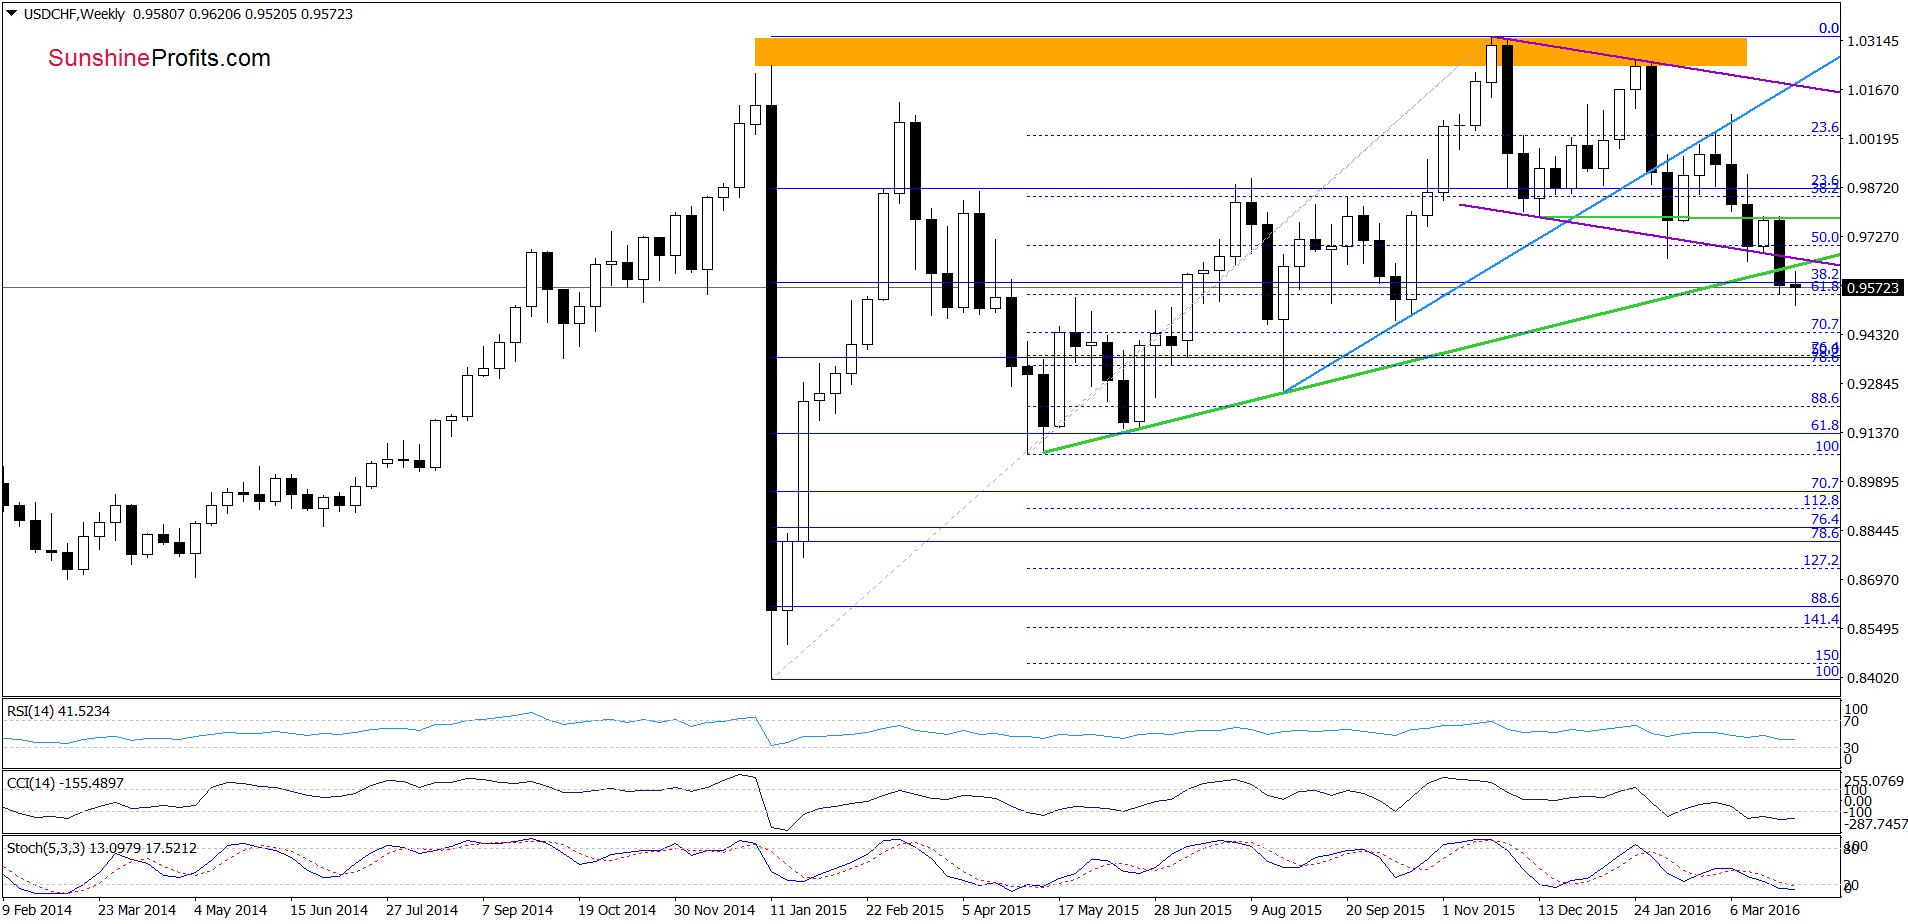
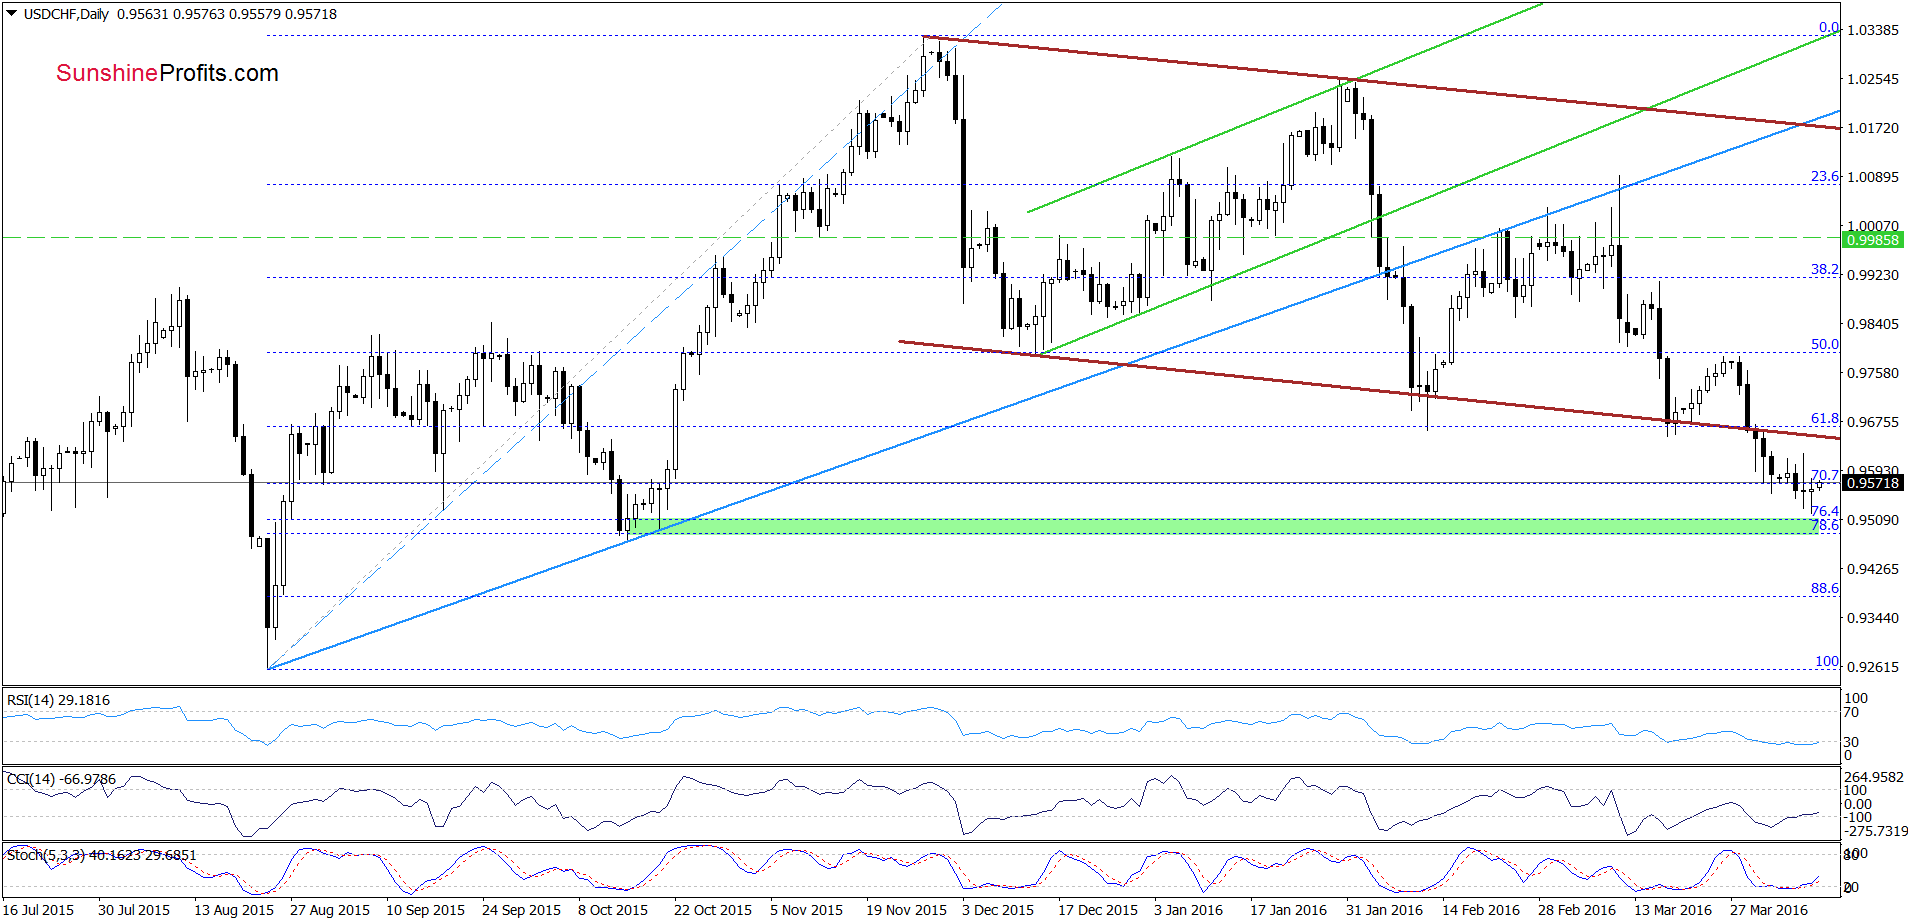
Looking at the above charts, we see that although USD/CHF rebounded slightly yesterday, the pair is still trading under the lower border of the brown declining trend channel and the green support/resistance line (marked on the weekly chart), which means that as long as there won’t be invalidation of the breakdown under these lines all upswing could be just a verification of earlier breakdown. Nevertheless, buy signals generated by the indicators suggests that currency bulls will try to push the pair higher in the coming days. If this is the case, and we’ll see further improvement, the initial upside target would be around 0.9647, where the lower border of the brown trend channel currently is.
Very short-term outlook: mixed with bullish bias
Short-term outlook: mixed with bullish bias
MT outlook: mixed
LT outlook: mixed
Trading position (short-term; our opinion): No positions are justified from the risk/reward perspective. We will keep you informed should anything change, or should we see a confirmation/invalidation of the above.
AUD/USD
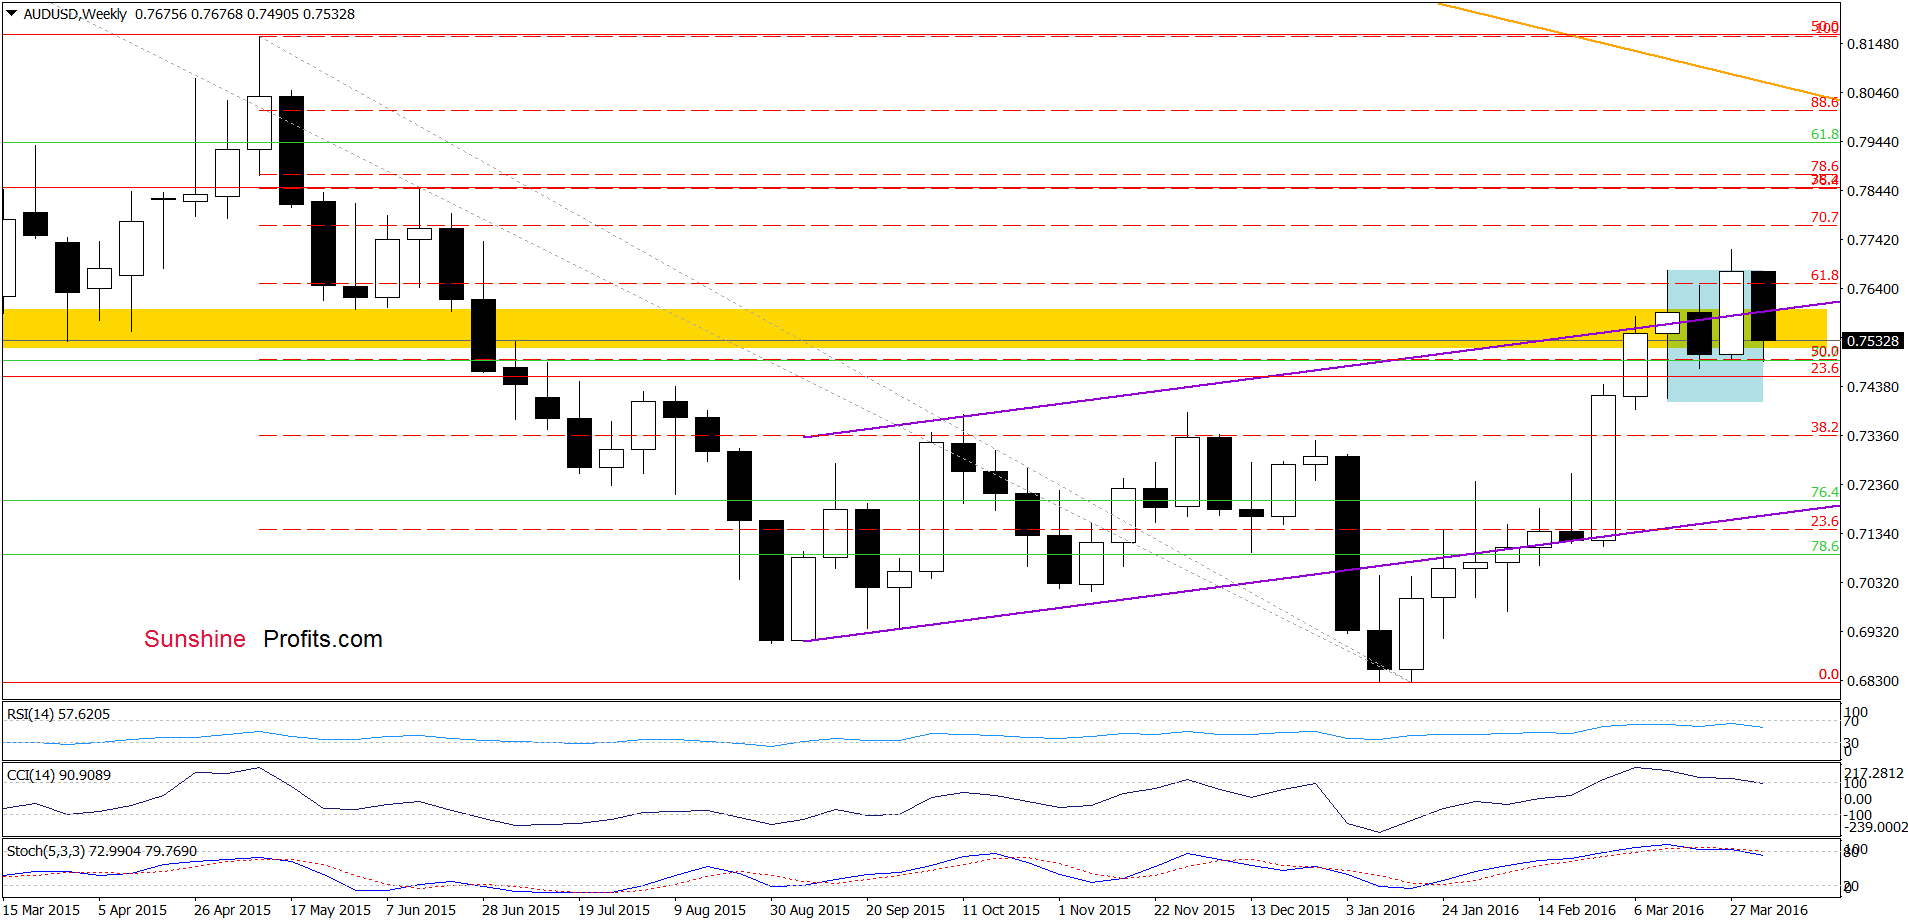
From the medium-term perspective we see that the overall situation hasn’t changed much as AUD/USD remains under the upper border of the purple rising trend channel. Therefore what we wrote on Wednesday is up-to date also today:
(…) the pair slipped under the upper border of the purple rising trend channel, which is a negative signal (an invalidation of the breakdown) that suggests further deterioration. However, in our opinion, it would be more bearish if we see a weekly closure below this line.
Having said the above, let’s check how this drop affected the very short-term picture.
Quoting our previous alert:
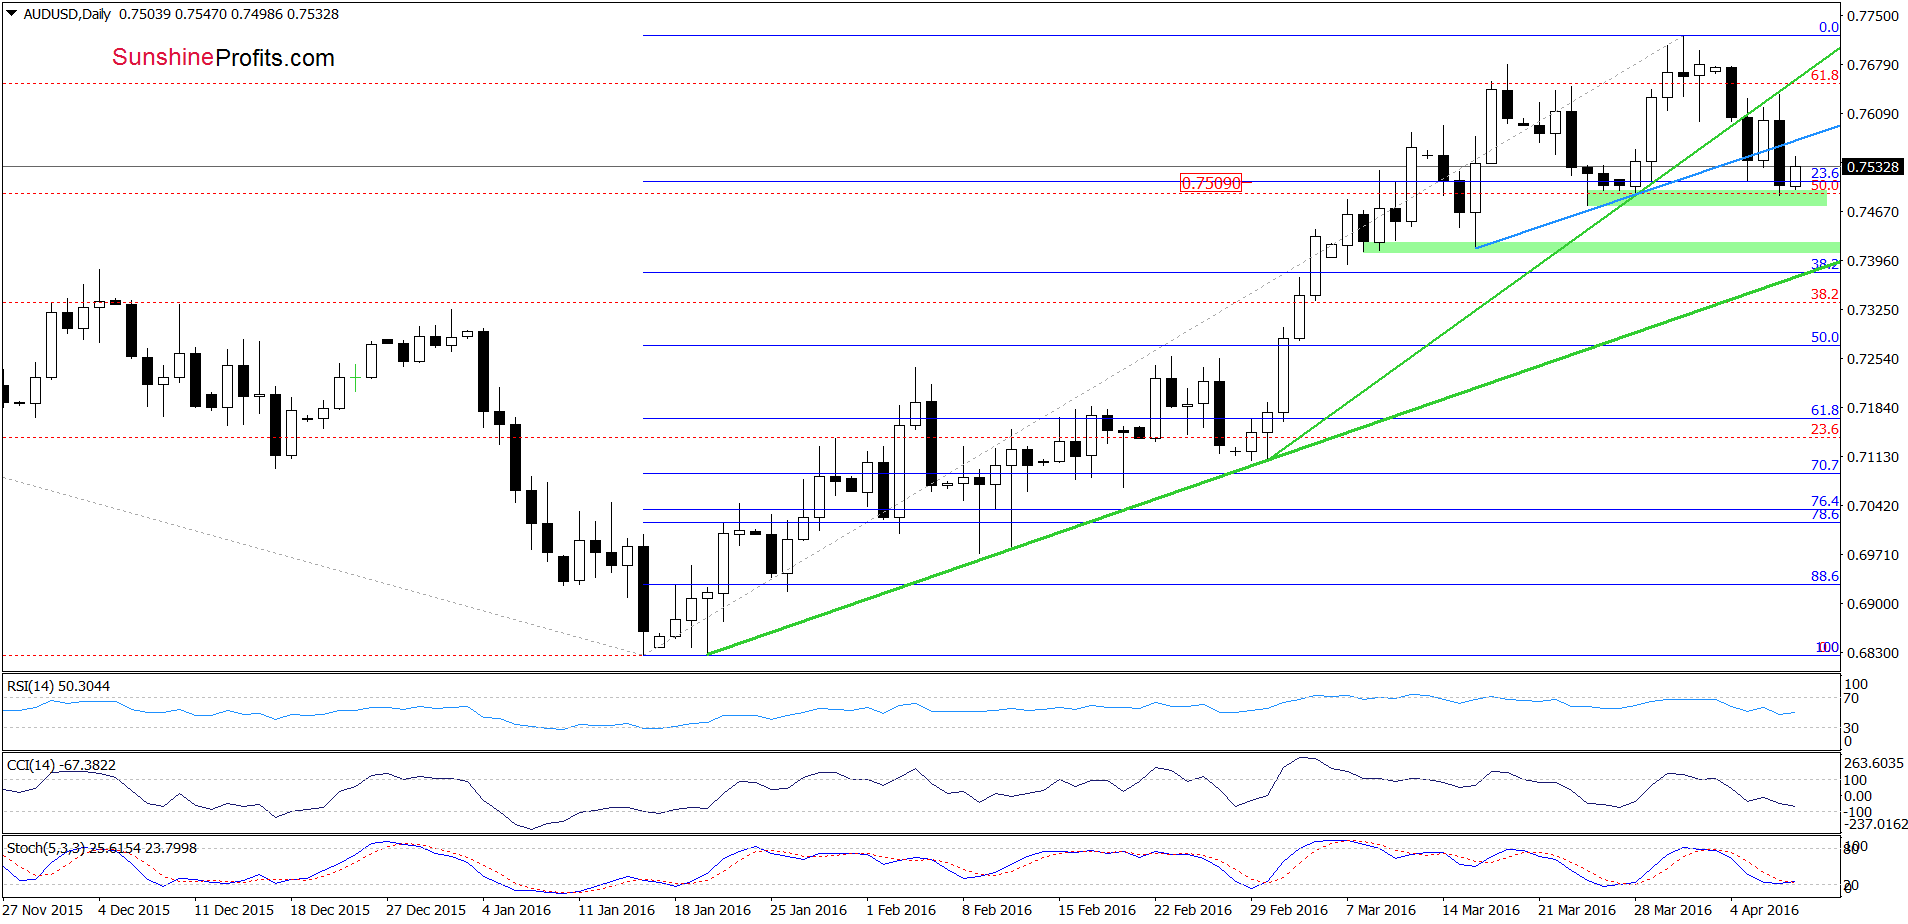
(…) the Fibonacci retracement encouraged currency bulls to act, which resulted in a small rebound earlier today. Despite this move, the exchange rate remains under the previously-broken blue and green lines, which serve now as resistance. Additionally, sell signals remain in place, which in combination with the medium-term picture suggests another attempt to move lower and a re-test of the 23.6% Fibonacci retracement in the coming days.
On the daily chart, we see that the situation developed in line with the above scenario and AUD/USD slipped to the 23.6% Fibonacci retracement yesterday. As you see in this area is also green support zone based on the bottom of the previous pullback, which in combination with the retracement encouraged currency bulls to act earlier today. In this way, the pair increased to the blue resistance line, however, as long as there won’t be invalidation of the breakdown further improvement is questionable.
Very short-term outlook: mixed
Short-term outlook: mixed
MT outlook: mixed
LT outlook: mixed
Trading position (short-term; our opinion): No positions are justified from the risk/reward perspective. We will keep you informed should anything change, or should we see a confirmation/invalidation of the above.
Thank you.
Nadia Simmons
Forex & Oil Trading Strategist
Przemyslaw Radomski, CFA
Founder, Editor-in-chief
Gold & Silver Trading Alerts
Forex Trading Alerts
Oil Investment Updates
Oil Trading Alerts

