

Earlier today the USD Index moved little higher and came back around 96.50, stabilizing after Thursday’s sharp decline as investors turned their attention to Wednesday’s outcome of the Federal Reserve’s latest policy meeting. Nevertheless, before know the decision on interest rates, let’s focus on the current situation in our six currency pairs.
In our opinion the following forex trading positions are justified - summary:
- EUR/USD: short (stop-loss order at 1.1512; initial downside target at 1.0572)
- GBP/USD: none
- USD/JPY: none
- USD/CAD: none
- USD/CHF: none
- AUD/USD: none
EUR/USD
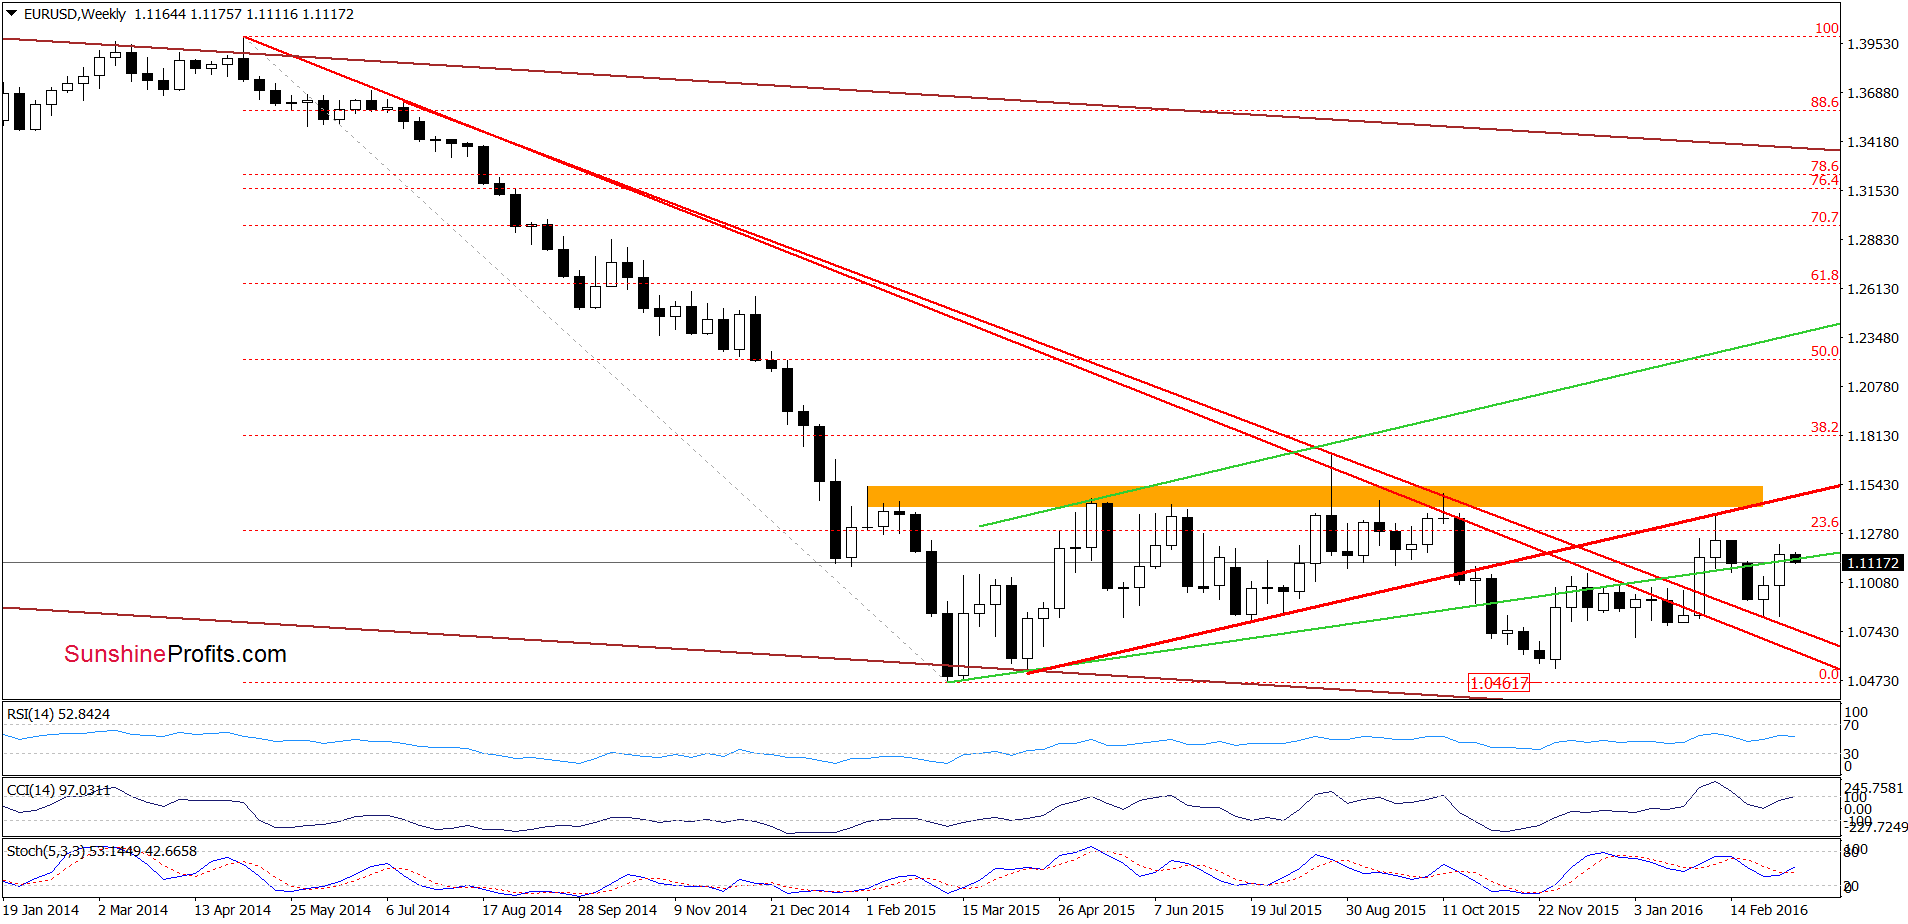
The first thing that catches the eye on the weekly chart is a drop under the previously-broken green support/resistance line. As you see similar price action in mid-Feb triggered further deterioration and a test of the red declining line, which suggests that we may see similar drop in the coming days.
Are there any short-term factors that could encourage currency bulls to act? Let’s check.
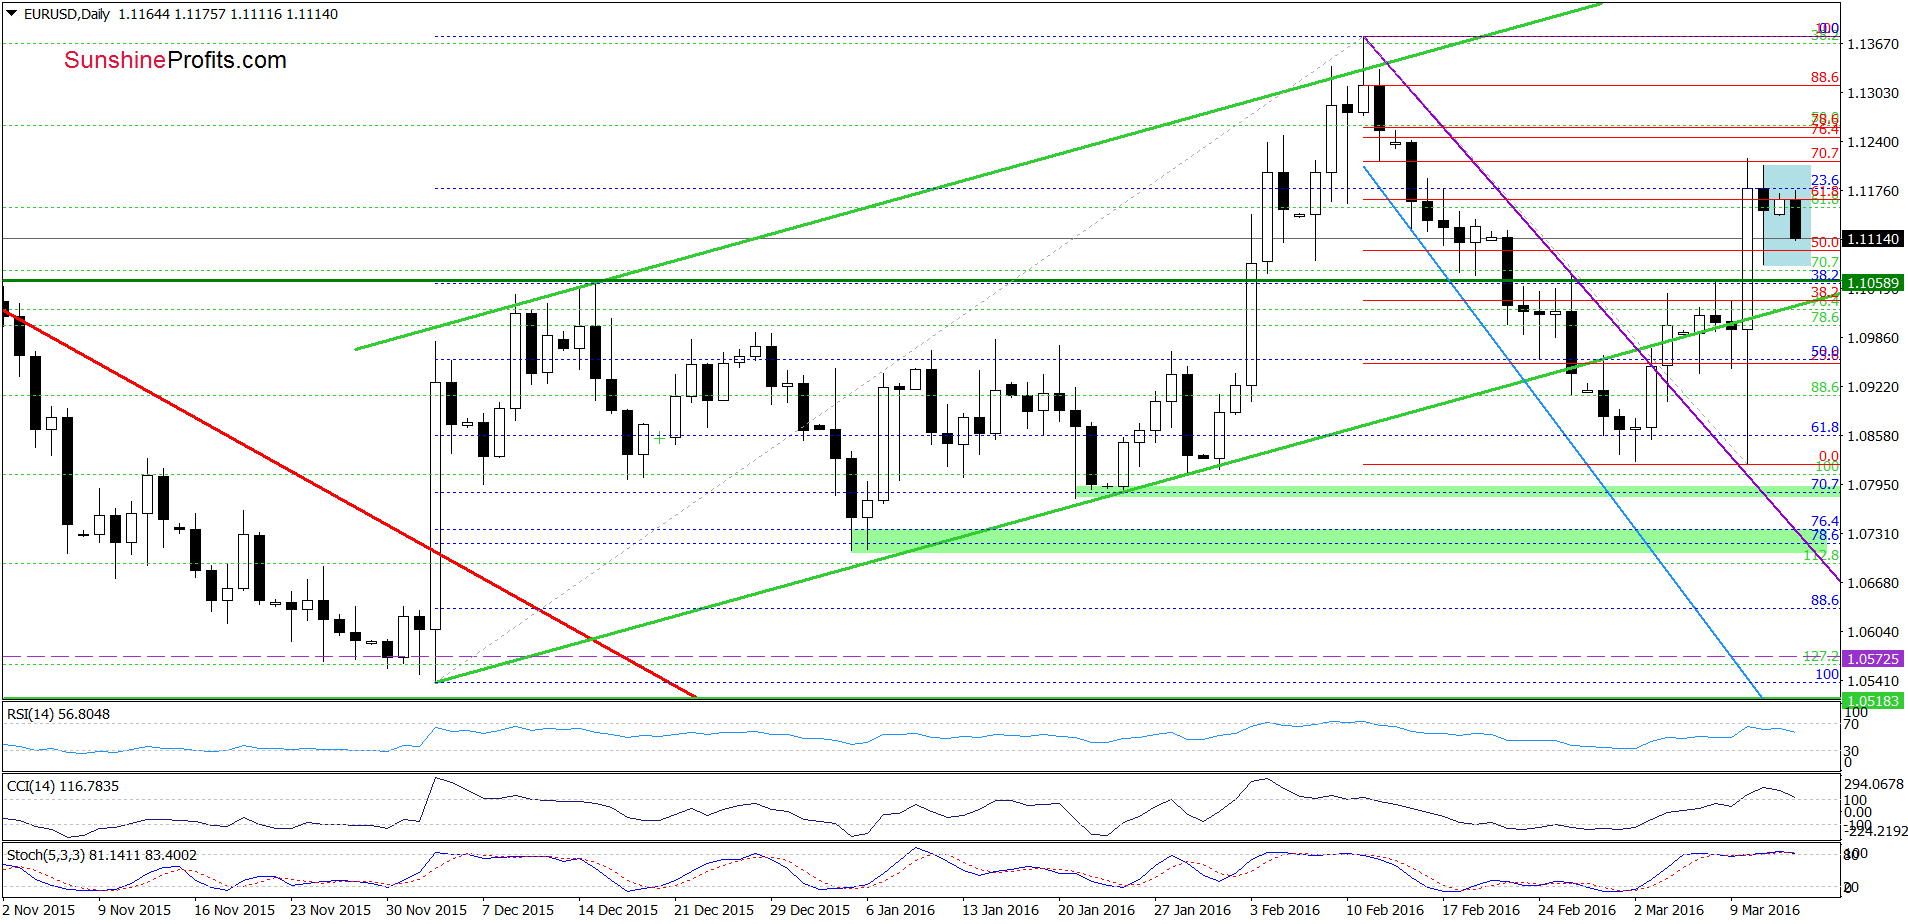
From this perspective, we see that although EUR/USD erased some of Friday’s decline, the pair reversed and dropped once again earlier today. Despite this move, the exchange rate remains in the blue consolidation, which suggests that a breakdown under the lower line of the formation (or a breakout above the upper line) will indicate the direction of another move. Nevertheless, taking ino account the medium-term picture and the current position of daily indicators (the CCI and Stochastic Oscillator are very close to generating sell signals), we think that another downswing is just a matter of time. Therefore, in our opinion, we’ll see a test of the green horizontal support line (based on the mid-Dec high) and the lower border of the green rising trend channel in the coming days.
Very short-term outlook: bearish
Short-term outlook: bearish
MT outlook: mixed with bearish bias
LT outlook: mixed
Trading position (short-term; our opinion): Short positions (with a stop-loss order at 1.1512 and the initial downside target at 1.0572) are justified from the risk/reward perspective. We will keep you informed should anything change, or should we see a confirmation/invalidation of the above.
GBP/USD
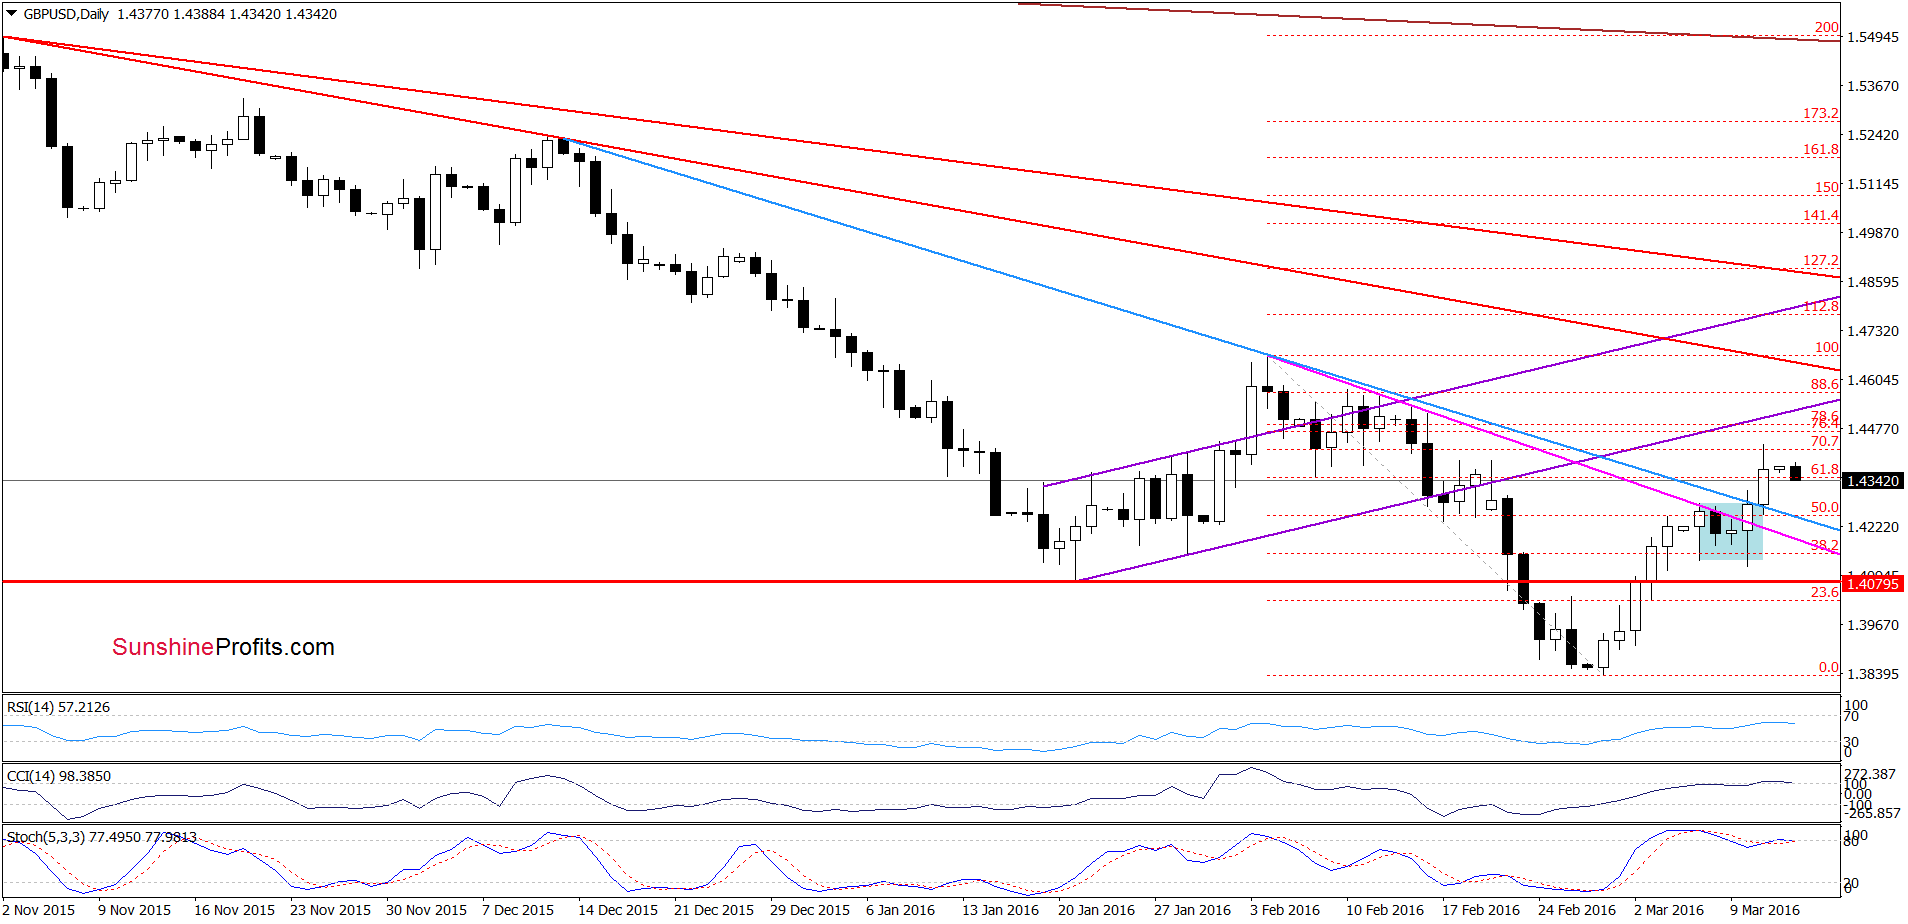
Looking at the daily chart, we see that GBP/USD broke above the upper borer of the blue consolidation and the 50% Fibonacci retracement, which resulted in an increase to the 70.7% retracement and approached the pair to the previously-broken lower border of the purple rising trends channel. Additionally, when we take a closer look at the chart, we clearly see that the CCI and Stochastic Oscillator are overbought which suggests that reversal and lower values of the exchange rate should not surprise us in the coming days. On top of that, if GBP/USD declines under 1.4327, we’ll see an invalidation of the breakout above the 23.6% Fibonacci retracement (based on the entire mid-Jun-Feb downward move and marked on the chart below), which would be an additional negative signal, that could encourage currency bears to act.
Very short-term outlook: mixed with bearish bias
Short-term outlook: mixed with bearish bias
MT outlook: mixed
LT outlook: mixed
Trading position (short-term; our opinion): No positions are justified from the risk/reward perspective at the moment. We will keep you informed should anything change, or should we see a confirmation/invalidation of the above.
USD/JPY
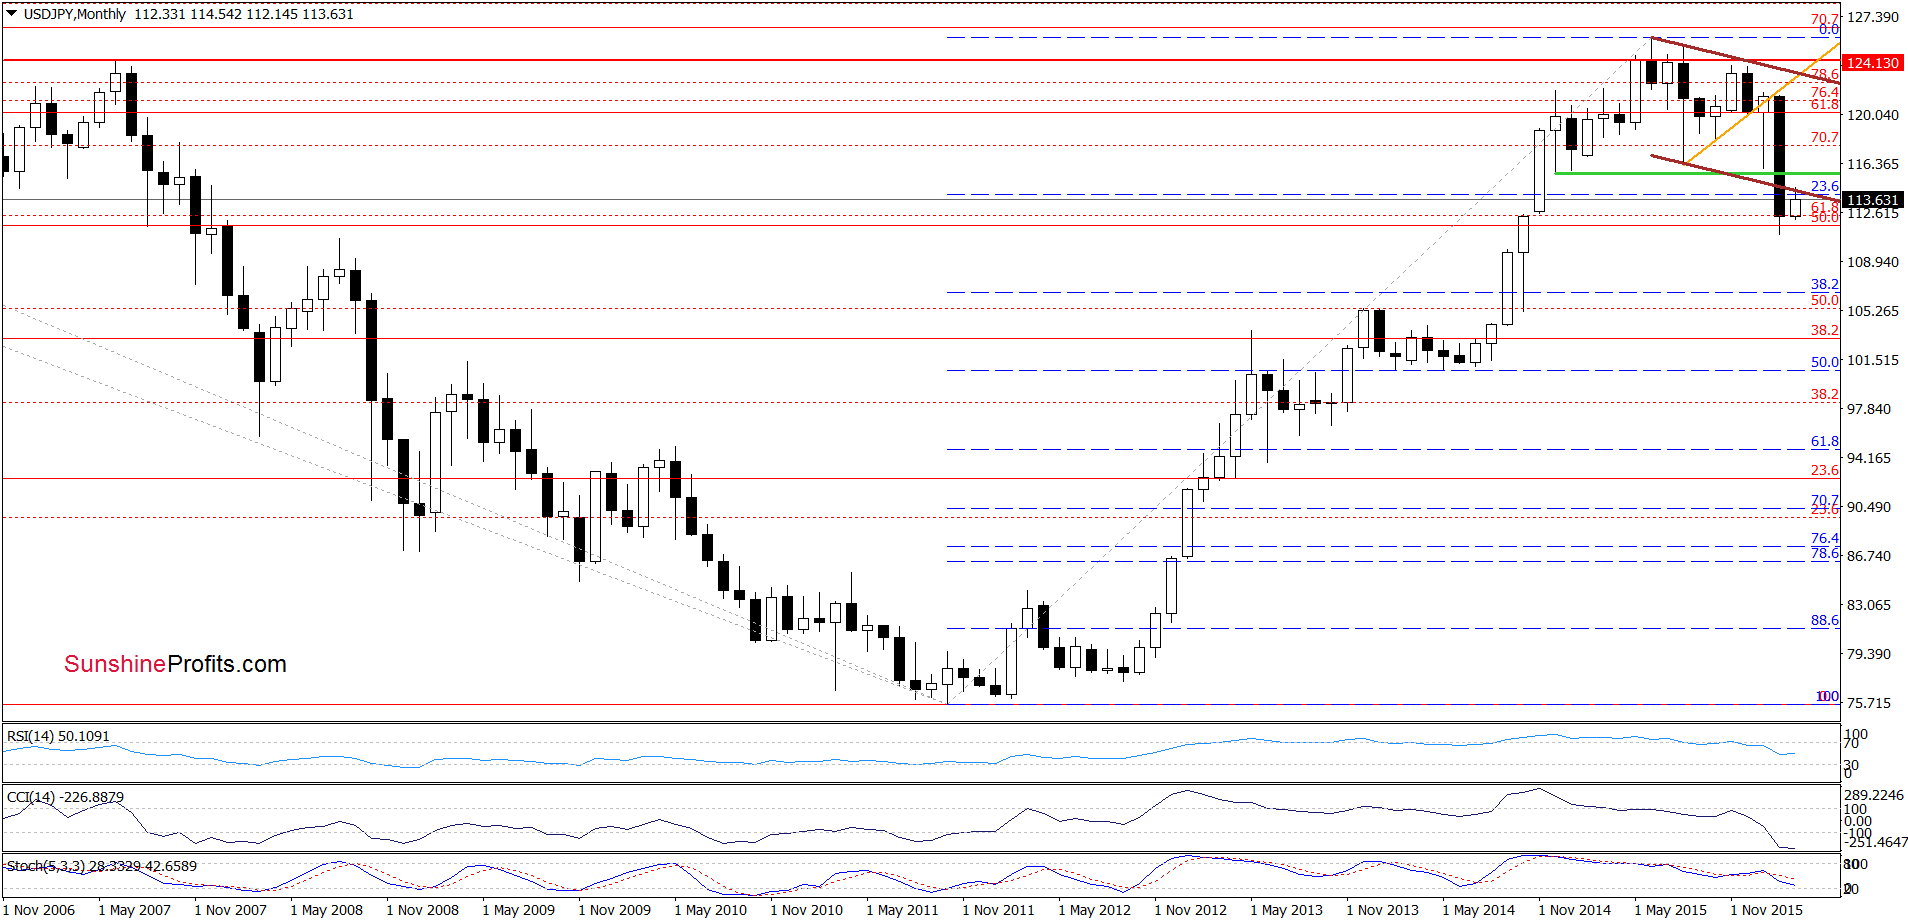
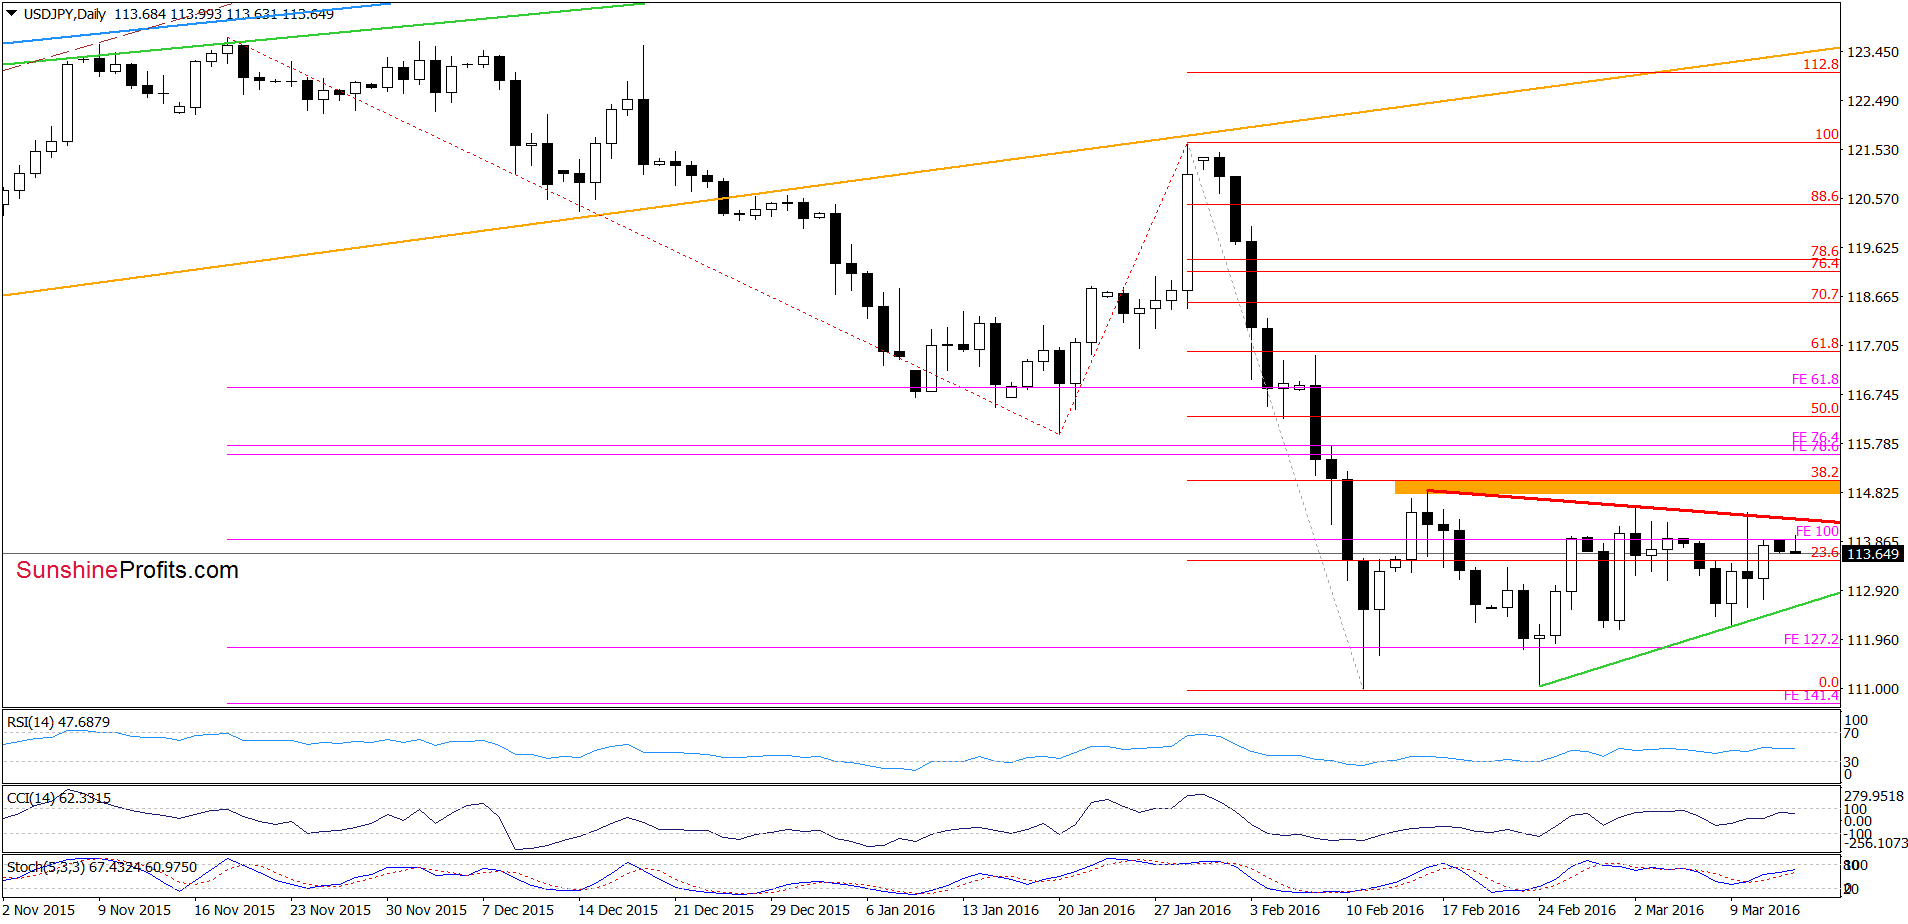
Looking at the above charts, we see that the overall situation hasn’t changed much since our last commentary as USD/JPY remains under the key resistance levels. Therefore, what we wrote on Wednesday remains up-to-date:
(…) although USD/JPY moved higher in recent days, the pair remains under the orange resistance zone created by the mid-Feb highs and the 38.2% Fibonacci retracement, which serves as the nearest resistance. (…) in our opinion, as long as there won’t be a breakout above the orange zone another bigger upward move is not likely to be seen. Additionally, when we focus on the long-term chart (…), we’ll see that the exchange rate remains under the previously-broken lower border of the brown declining trend channel, which means that as long as this resistance will be in play all gains would be nothing more than a verification of earlier breakdown.
Very short-term outlook: mixed
Short-term outlook: mixed
MT outlook: mixed
LT outlook: mixed
Trading position (short-term; our opinion): No positions are justified from the risk/reward perspective at the moment. We will keep you informed should anything change, or should we see a confirmation/invalidation of the above.
USD/CAD
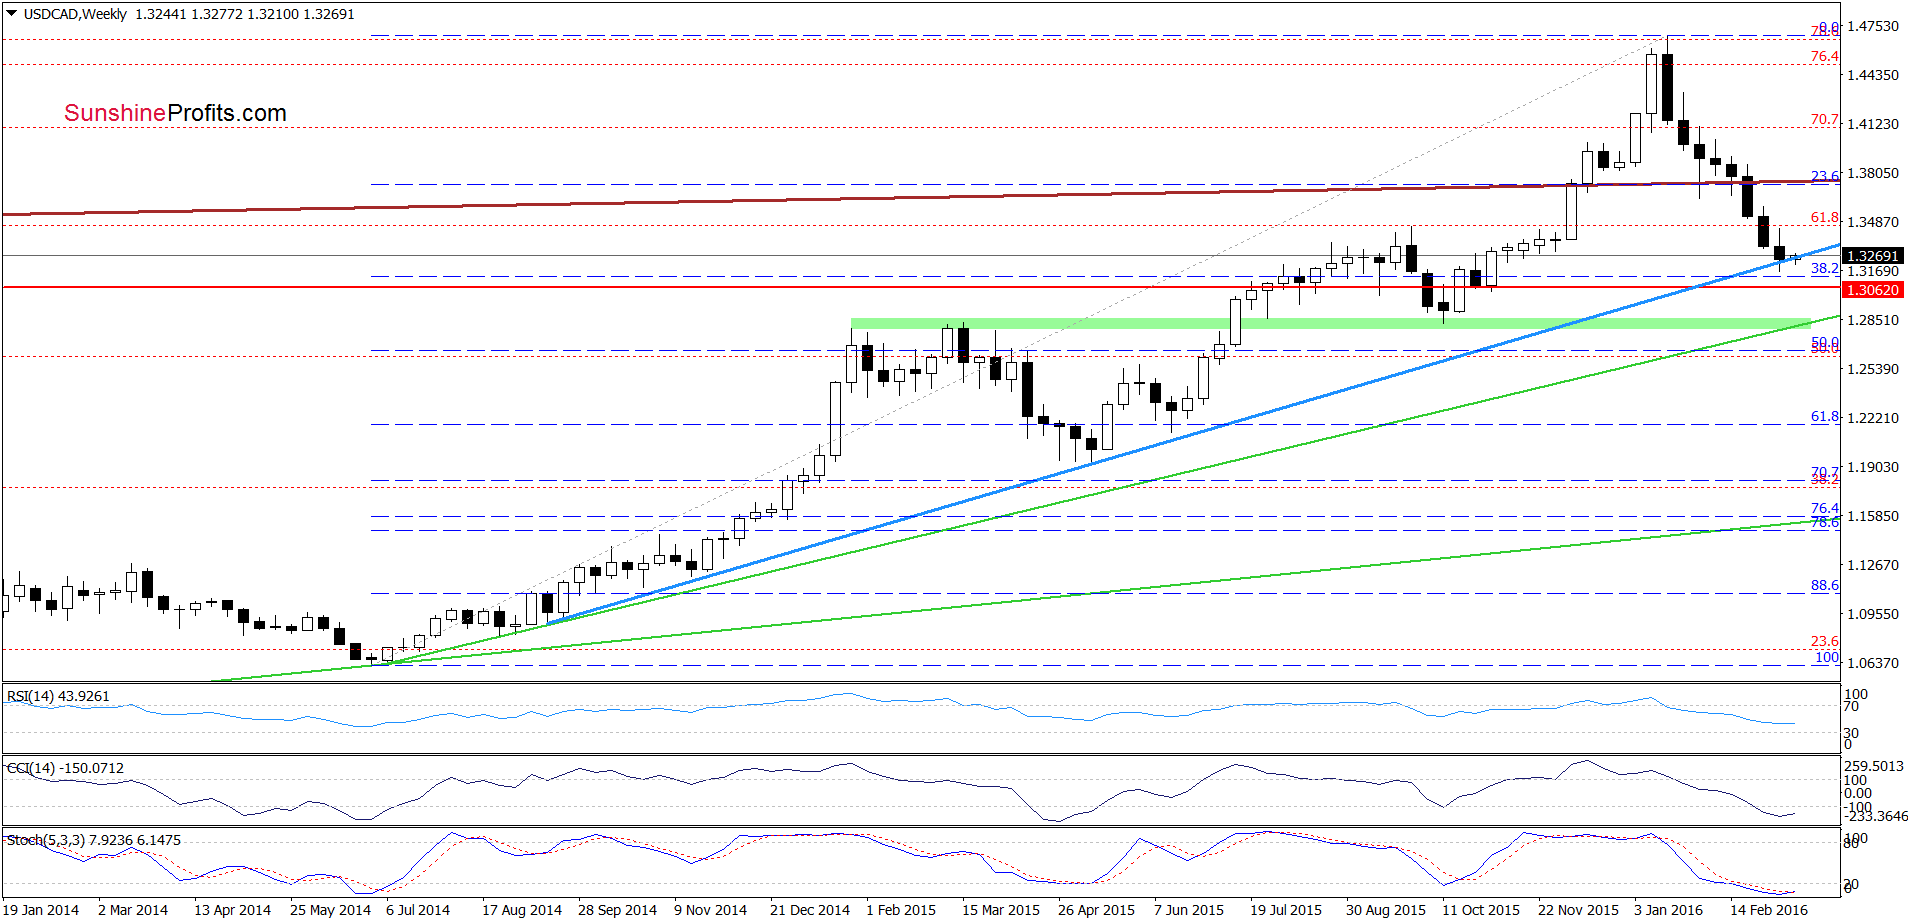
From the medium-term perspective, we see that the recent downward move took USD/CAD to the long-term blue support line, which triggered a small rebound. Will we see further improvement? Let’s examine the very short-term picture and look for more clues about future moves.
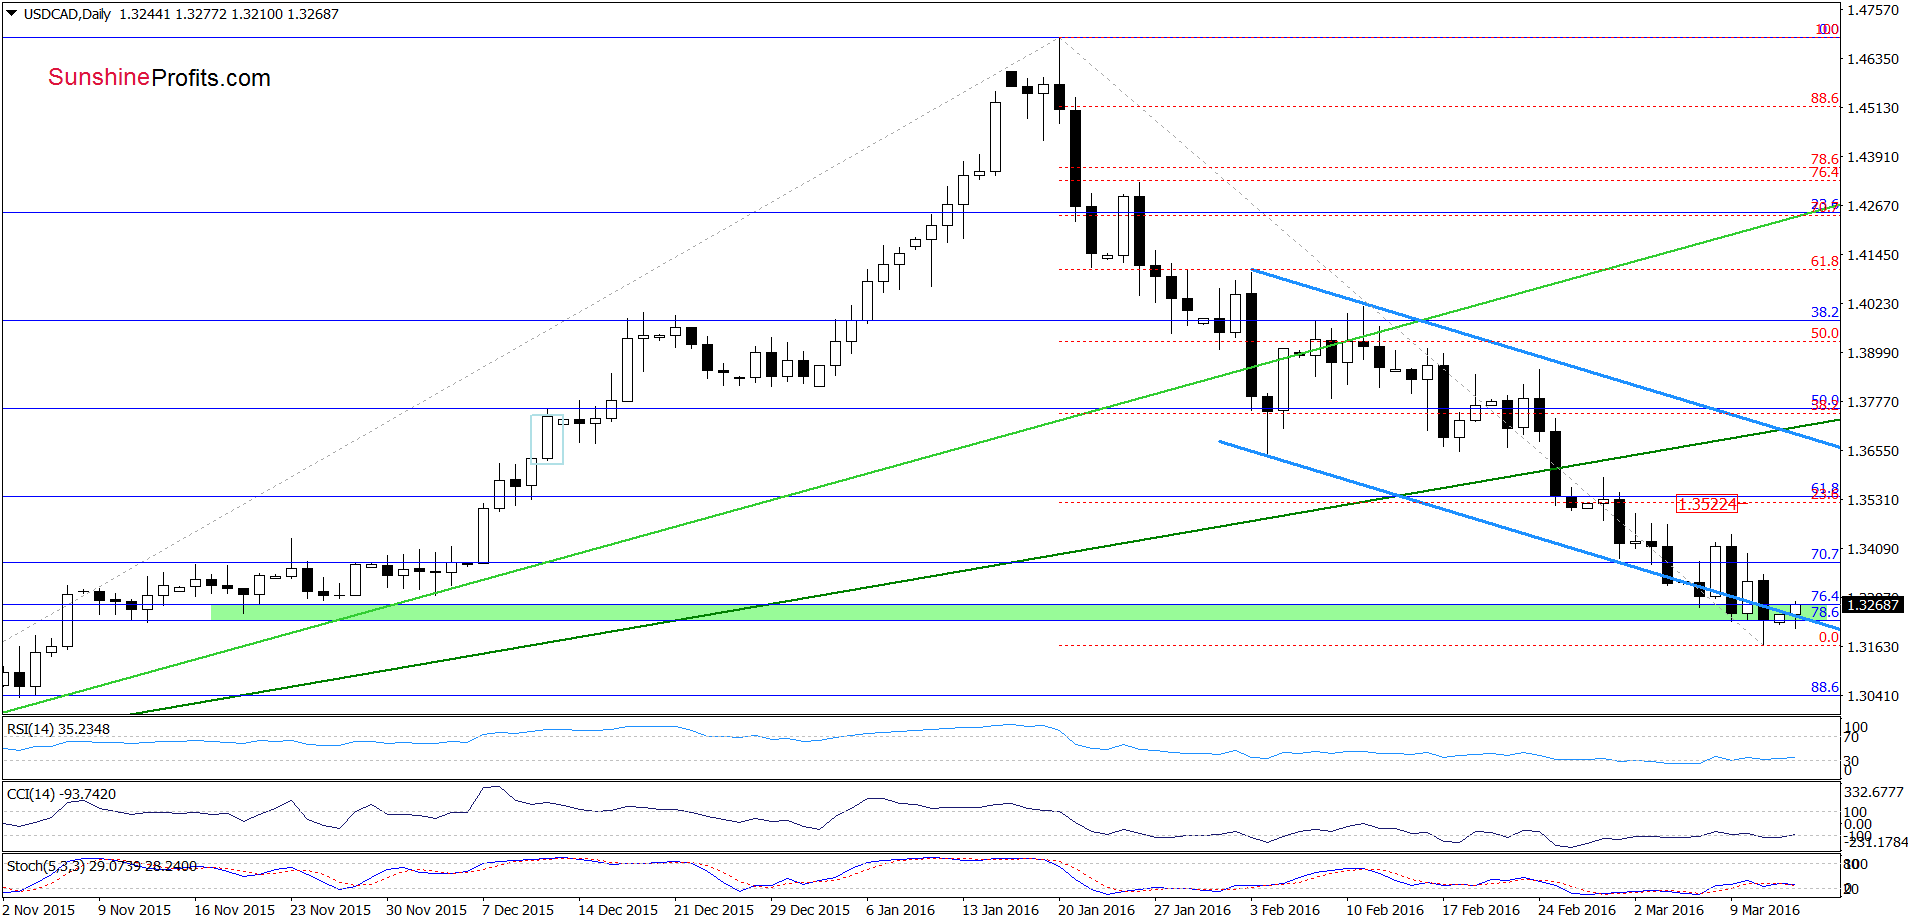
On the daily chart, we see that although USD/CAD extended losses and dropped under the lower border of the blue declining trend channel on Friday, the green support zone (created by the 76.4% and 78.6% Fibonacci retracement levels) encouraged currency bulls to act, which resulted in an invalidation of earlier breakdown earlier today. Taking this fact into account (which would be more positive if USD/CAD closes today’s session above the lower border of the blue declining trend channel) and combining it with the green support zone and the current position of the indicators (they are all oversold), we think that further improvement is just around the corner.
Very short-term outlook: mixed with bullish bias
Short-term outlook: mixed
MT outlook: mixed
LT outlook: mixed
Trading position (short-term; our opinion): No positions are justified from the risk/reward perspective at the moment. We will keep you informed should anything change, or should we see a confirmation/invalidation of the above.
USD/CHF
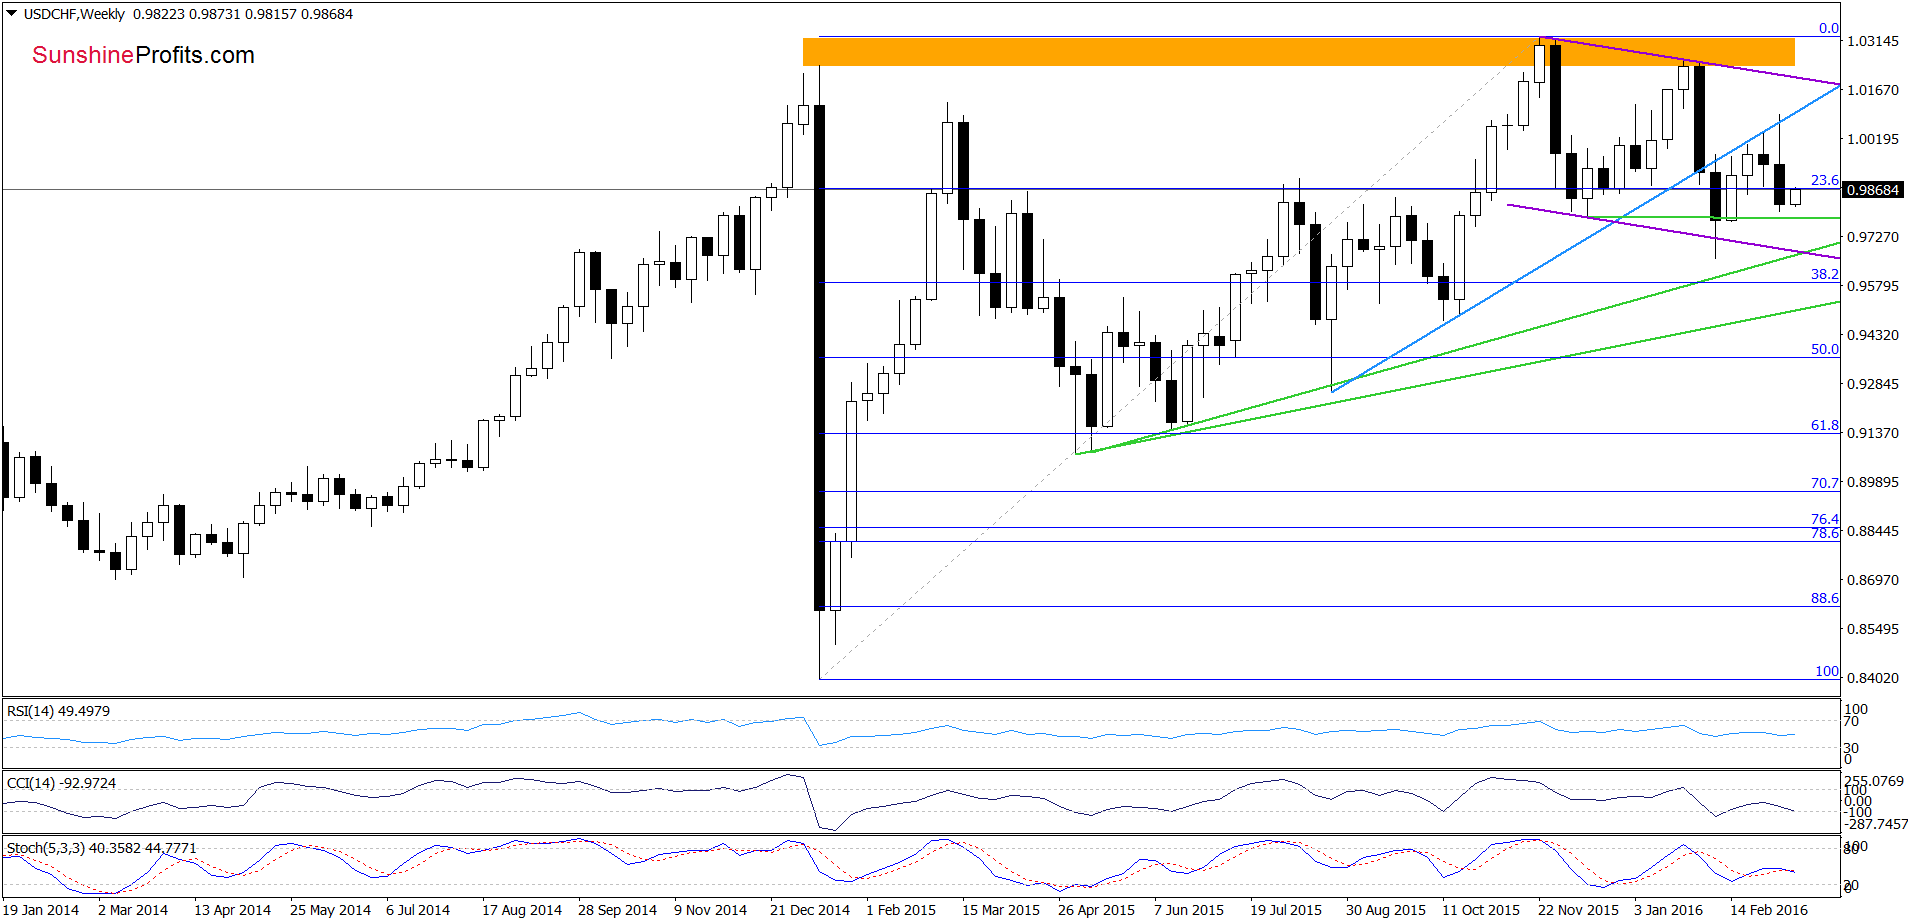
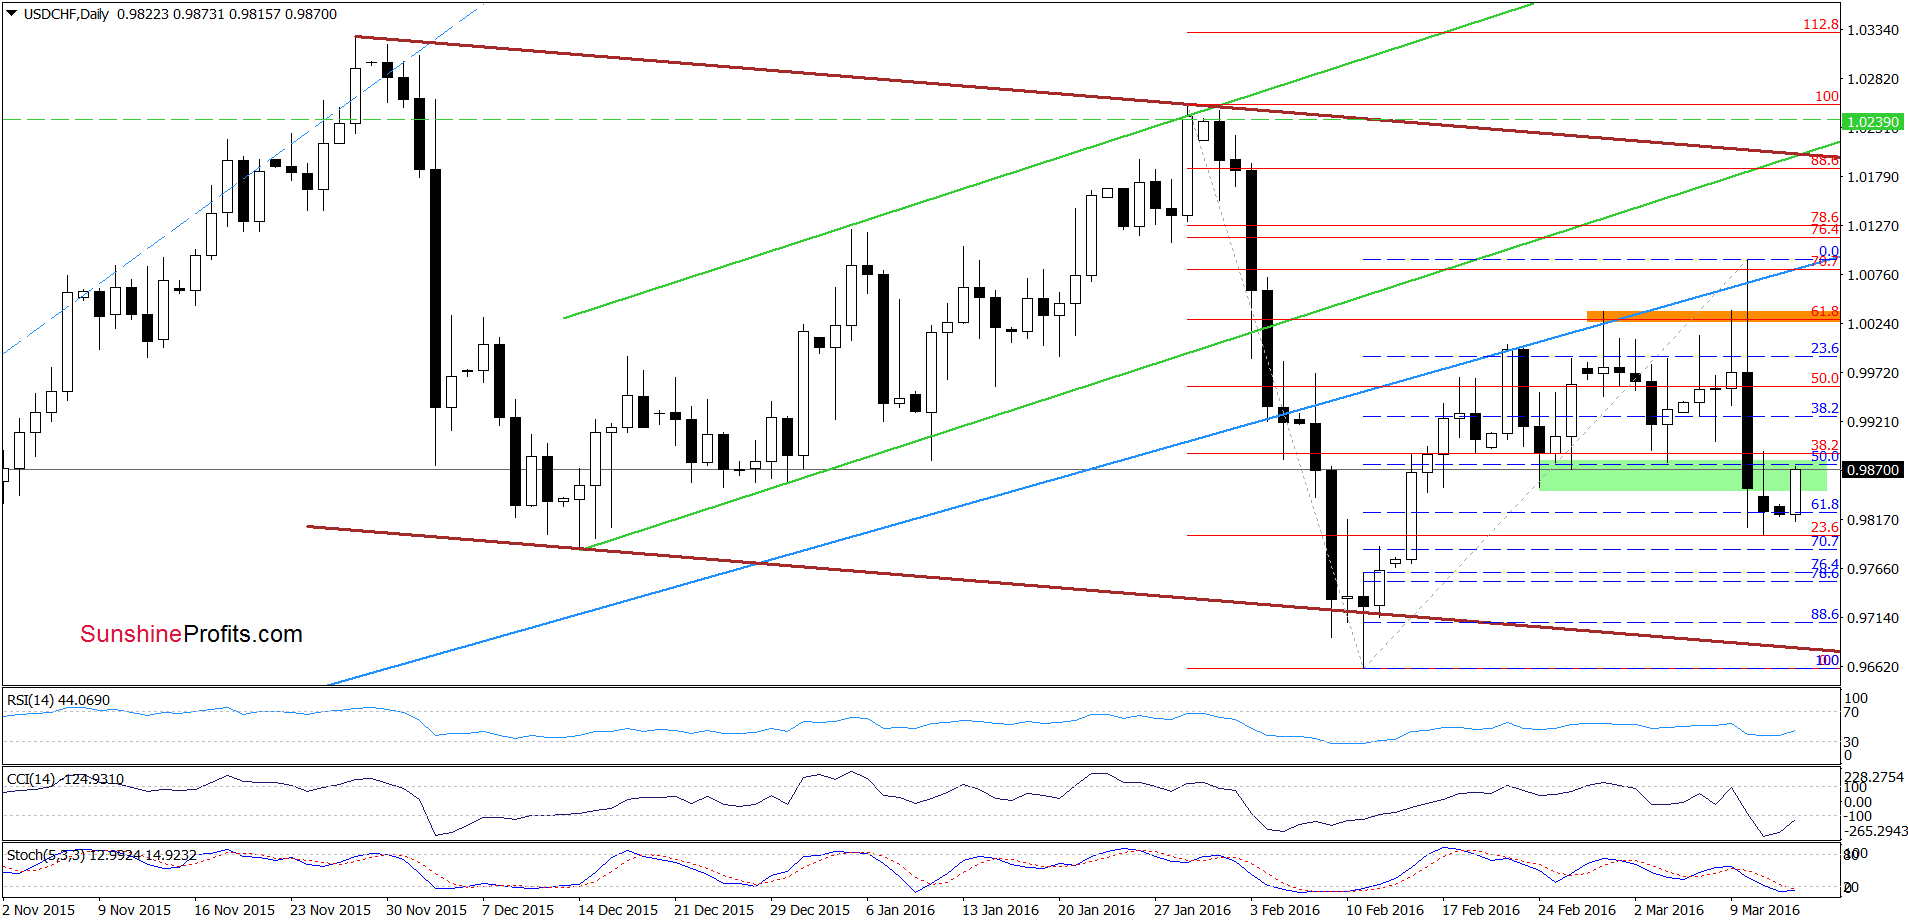
Looking at the above charts, we see that USD/CHF extended gains and climbed above the 61.8% Fibonacci retracement and the previous highs, but as you see this improvement was only very temporary and the pair gave up all gains very quickly. As a result, the exchange rate not only invalidated this small breakout, but also erased all Feb 24-Mar 10 increase. With this sharp decline USD/CHF slipped slightly below the 61.8% retracement (based on the Feb-Mar upward move). Nevertheless, currency bulls didn’t give up and pushed the pair higher earlier today which resulted in an invalidation of the breakdown under this support level. Although this is a positive signal, we should keep in mind that the pair remains under the upper border of the green zone (which serves now as the nearest resistance). In our opinion, further improvement would be more reliable if we see a climb (a daily closure) above this area and indicators generate buy signals.
Very short-term outlook: mixed
Short-term outlook: mixed
MT outlook: mixed
LT outlook: mixed
Trading position (short-term; our opinion): No positions are justified from the risk/reward perspective. We will keep you informed should anything change, or should we see a confirmation/invalidation of the above.
AUD/USD
Quoting our Friday’s alert:
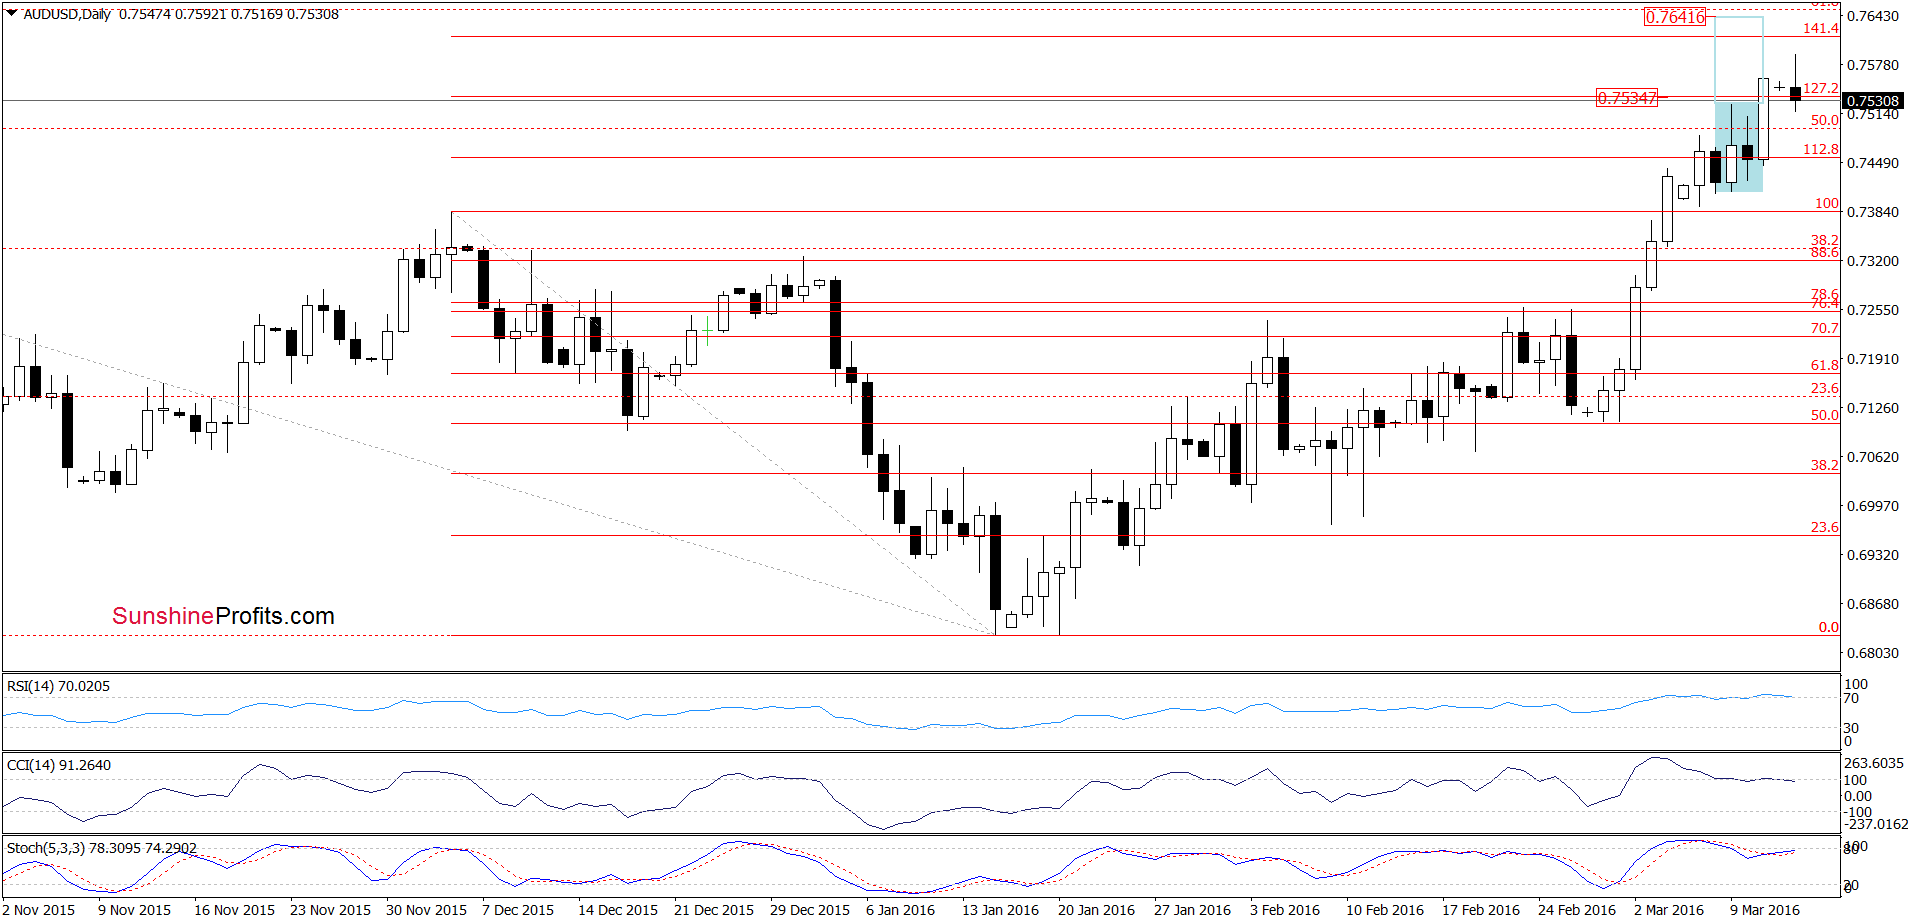
(…) AUD/USD broke above the upper border of the blue consolidation (and the 127.2% Fibonacci retracement), which suggests an increase to around 0.7641, where the size of the move will correspond to the height of the formation. Are there any factors that could hinder the realization of the above scenario?
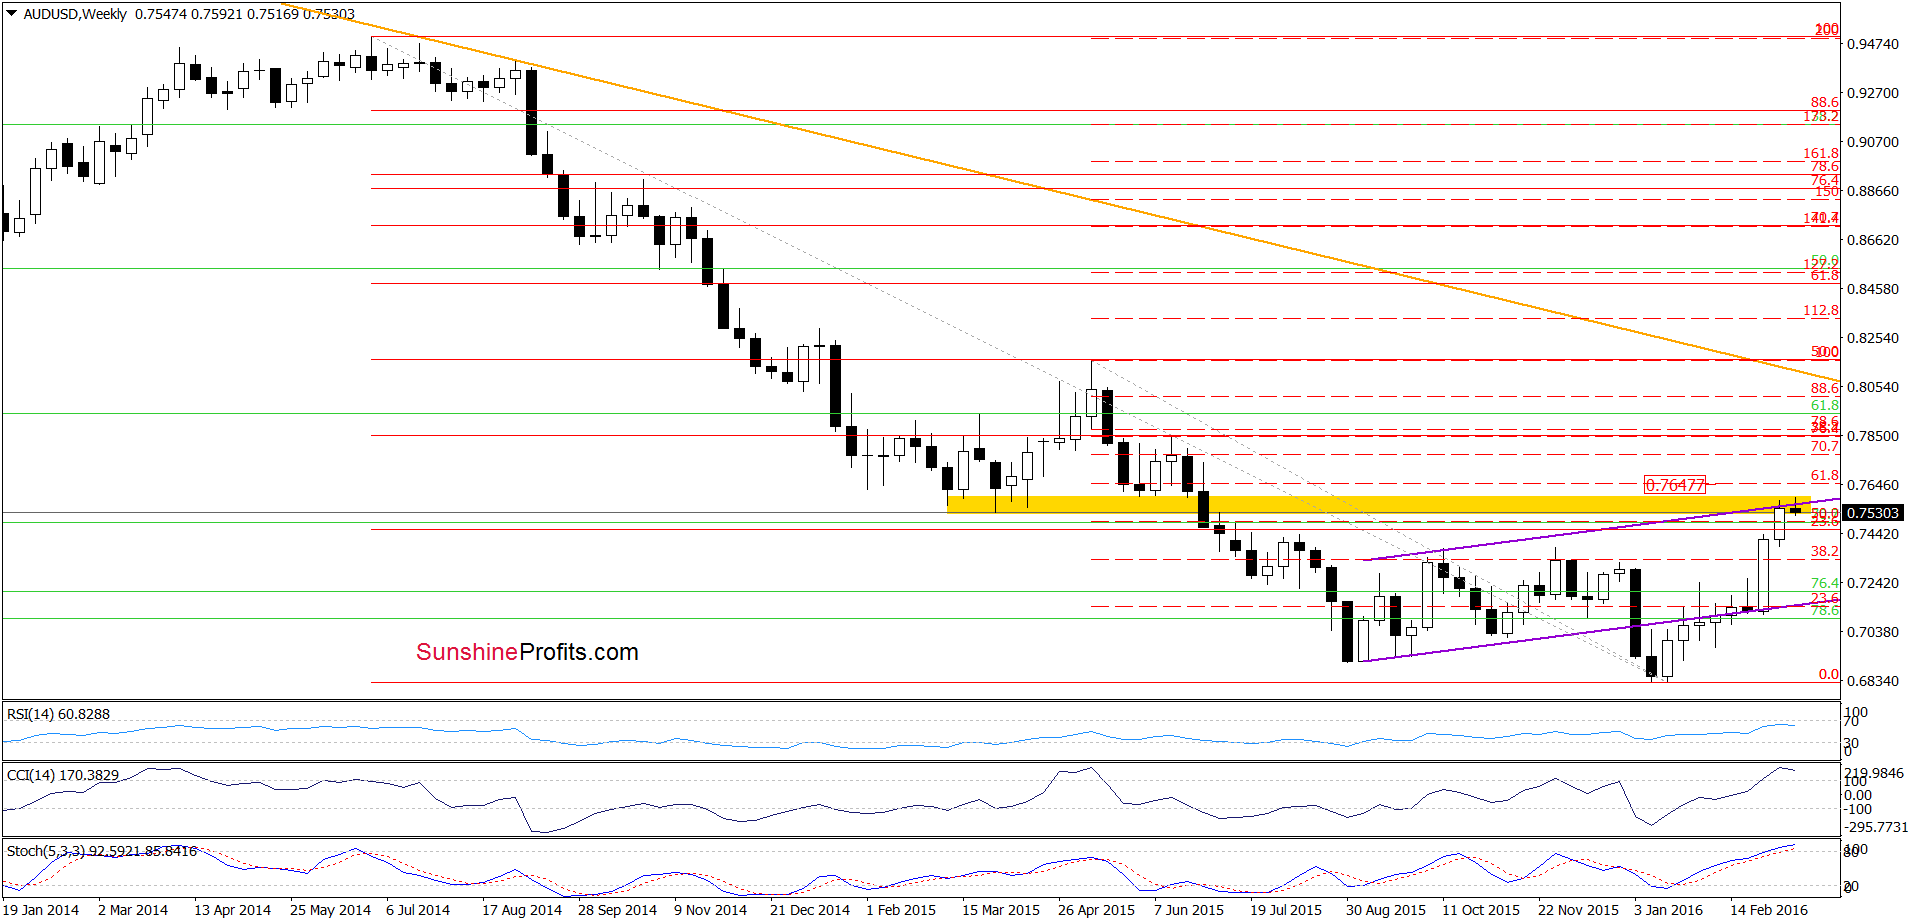
(…) AUD/USD extended gains, breaking above the 50% Fibonacci retracement (based on the entire May-Jan downward move) and reaching the yellow resistance zone (created by the upper border of the purple rising trend channel and Mar 2015 lows). If this area doesn’t stop currency bulls, we’ll see a realization of the above-mentioned scenario or even a test of the 61.8% Fibonacci retracement in the coming week. Nevertheless, the current position of daily and weekly indicators suggests that the space for gains may be limited and reversal is just around the corner.
From today’s point of view, we see that AUD/USD gave up some gains earlier today, which resulted in a drop under the upper border of the purple rising trend channel. In this way, the pair invalidated earlier small breakout, which is a negative signal. Nevertheless, taking into account the fact that the week just getting started, we think that further deterioration would be more reliable if the exchange rate drops under the lower border of the blue consolidation marked on the daily chart (at 0.7408)
Very short-term outlook: mixed with bearish bias
Short-term outlook: mixed
MT outlook: mixed
LT outlook: mixed
Trading position (short-term; our opinion): No positions are justified from the risk/reward perspective. We will keep you informed should anything change, or should we see a confirmation/invalidation of the above.
Thank you.
Nadia Simmons
Forex & Oil Trading Strategist
Przemyslaw Radomski, CFA
Founder, Editor-in-chief
Gold & Silver Trading Alerts
Forex Trading Alerts
Oil Investment Updates
Oil Trading Alerts

