

Earlier today, the Australian dollar moved higher against its U.S. counterpart, breaking above the upper border of the consolidation and hitting a fresh March high. Will the resistance zone stop further rally in the coming days?
In our opinion the following forex trading positions are justified - summary:
- EUR/USD: short (stop-loss order at 1.1512; initial downside target at 1.0572)
- GBP/USD: none
- USD/JPY: none
- USD/CAD: none
- USD/CHF: none
- AUD/USD: none
EUR/USD
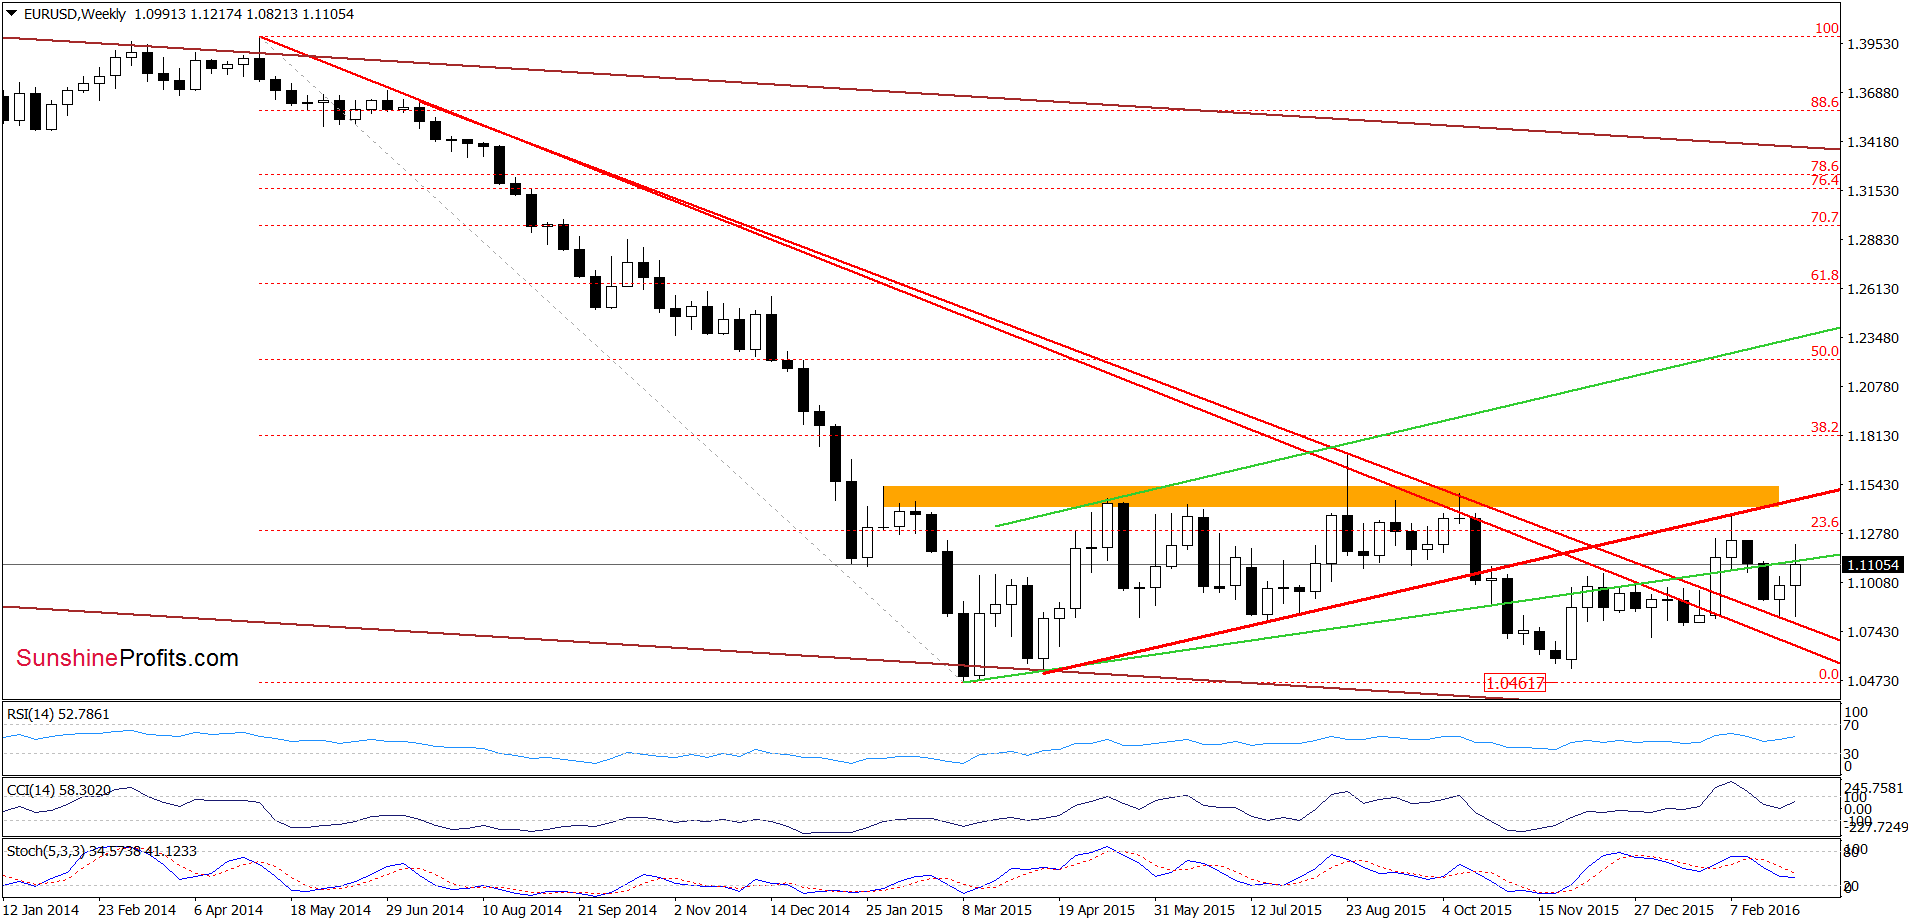
Looking at the weekly chart we see that alhough EUR/USD moved sharply higher and climbed above the green resistance line, this improvement was temporary. As a result, the exchange rate gave up some gains and dropped under this line, invalidating earlier breakout.
How did this move affect the very short-term picture? Let’s check.
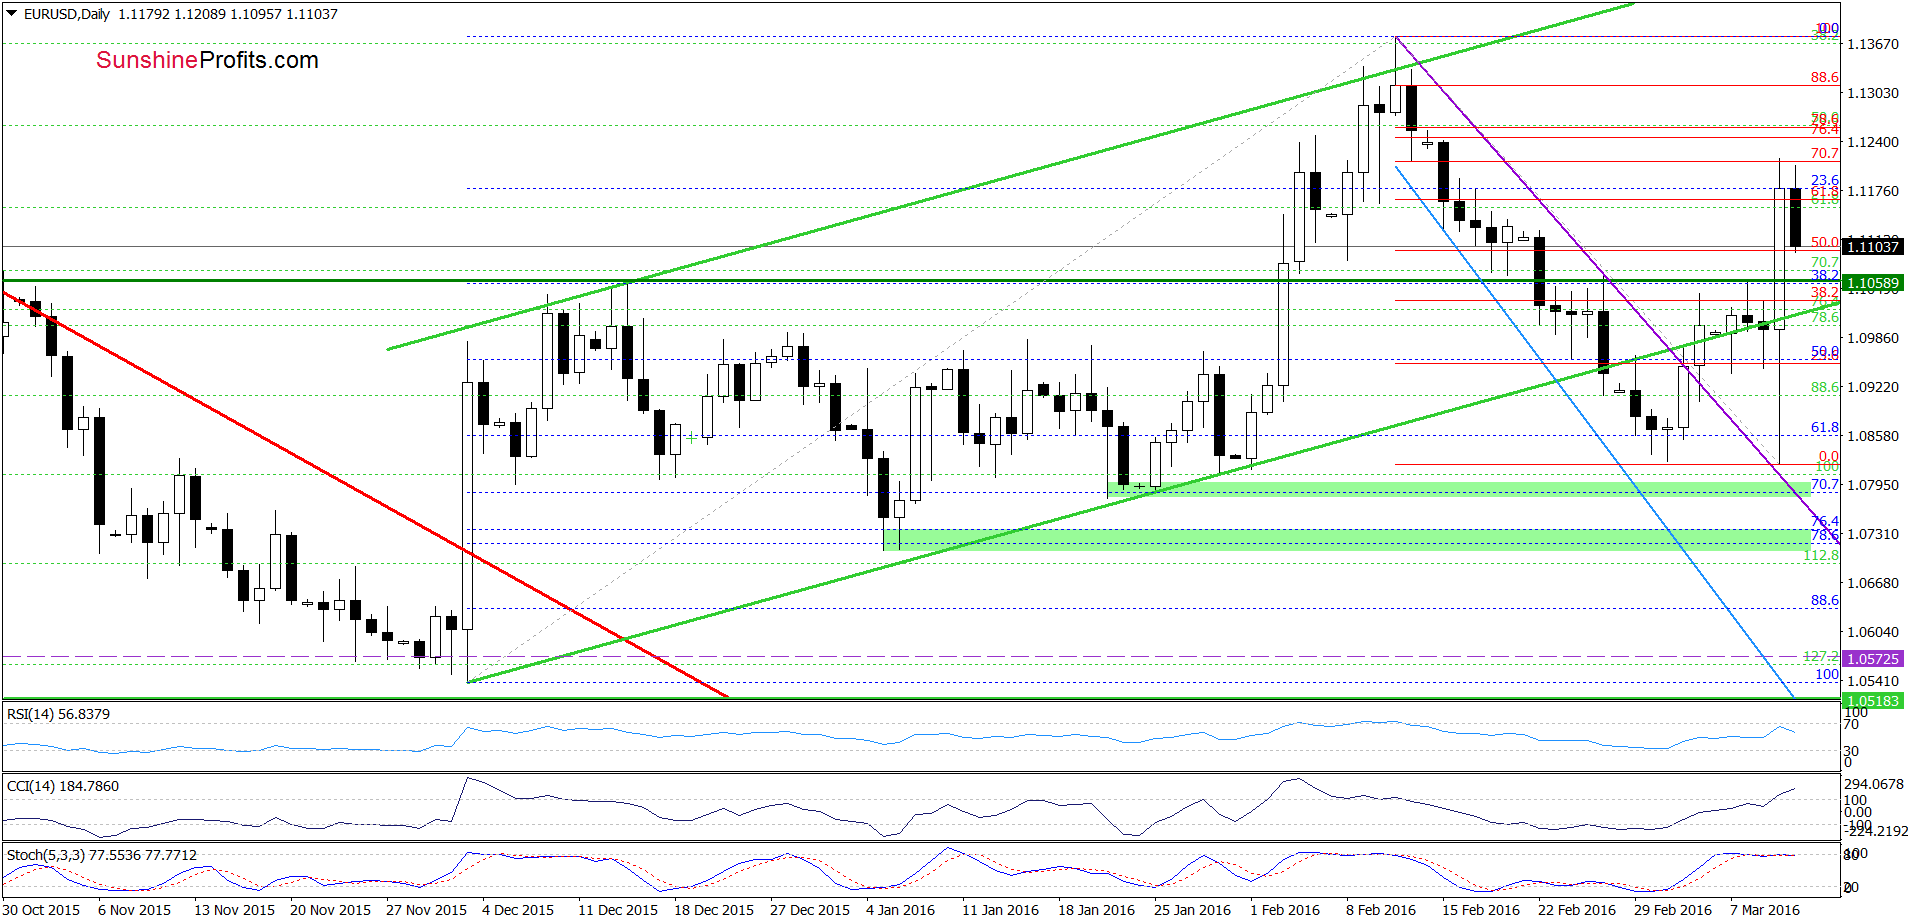
From this perspective, we see that EUR/USD moved sharply lower and slipped slightly below the March 2 low, testing the previously-broken purple declining support line. Despite this deterioration, the exchange rate rebounded sharply and climbed to the 70.7% Fibonacci retracement (based on the recent downward move). As you see, this resistance level triggered a pullback earlier today, which suggests that currency investors could overreact to yesterday’s Mario Draghi comments. Although he said that the rates will likely not be lowered further (which was viewed as bullish for the euro), we don’t really trust this scenario as the euro zone economy is worse than “booming“. Therefore, in our opinion, lower values of EUR/USD are still in play – especially when we factor in the current position of the daily indicators.
Very short-term outlook: bearish
Short-term outlook: bearish
MT outlook: mixed with bearish bias
LT outlook: mixed
Trading position (short-term; our opinion): Short positions (with a stop-loss order at 1.1512 and the initial downside target at 1.0572) are justified from the risk/reward perspective. We will keep you informed should anything change, or should we see a confirmation/invalidation of the above.
USD/JPY
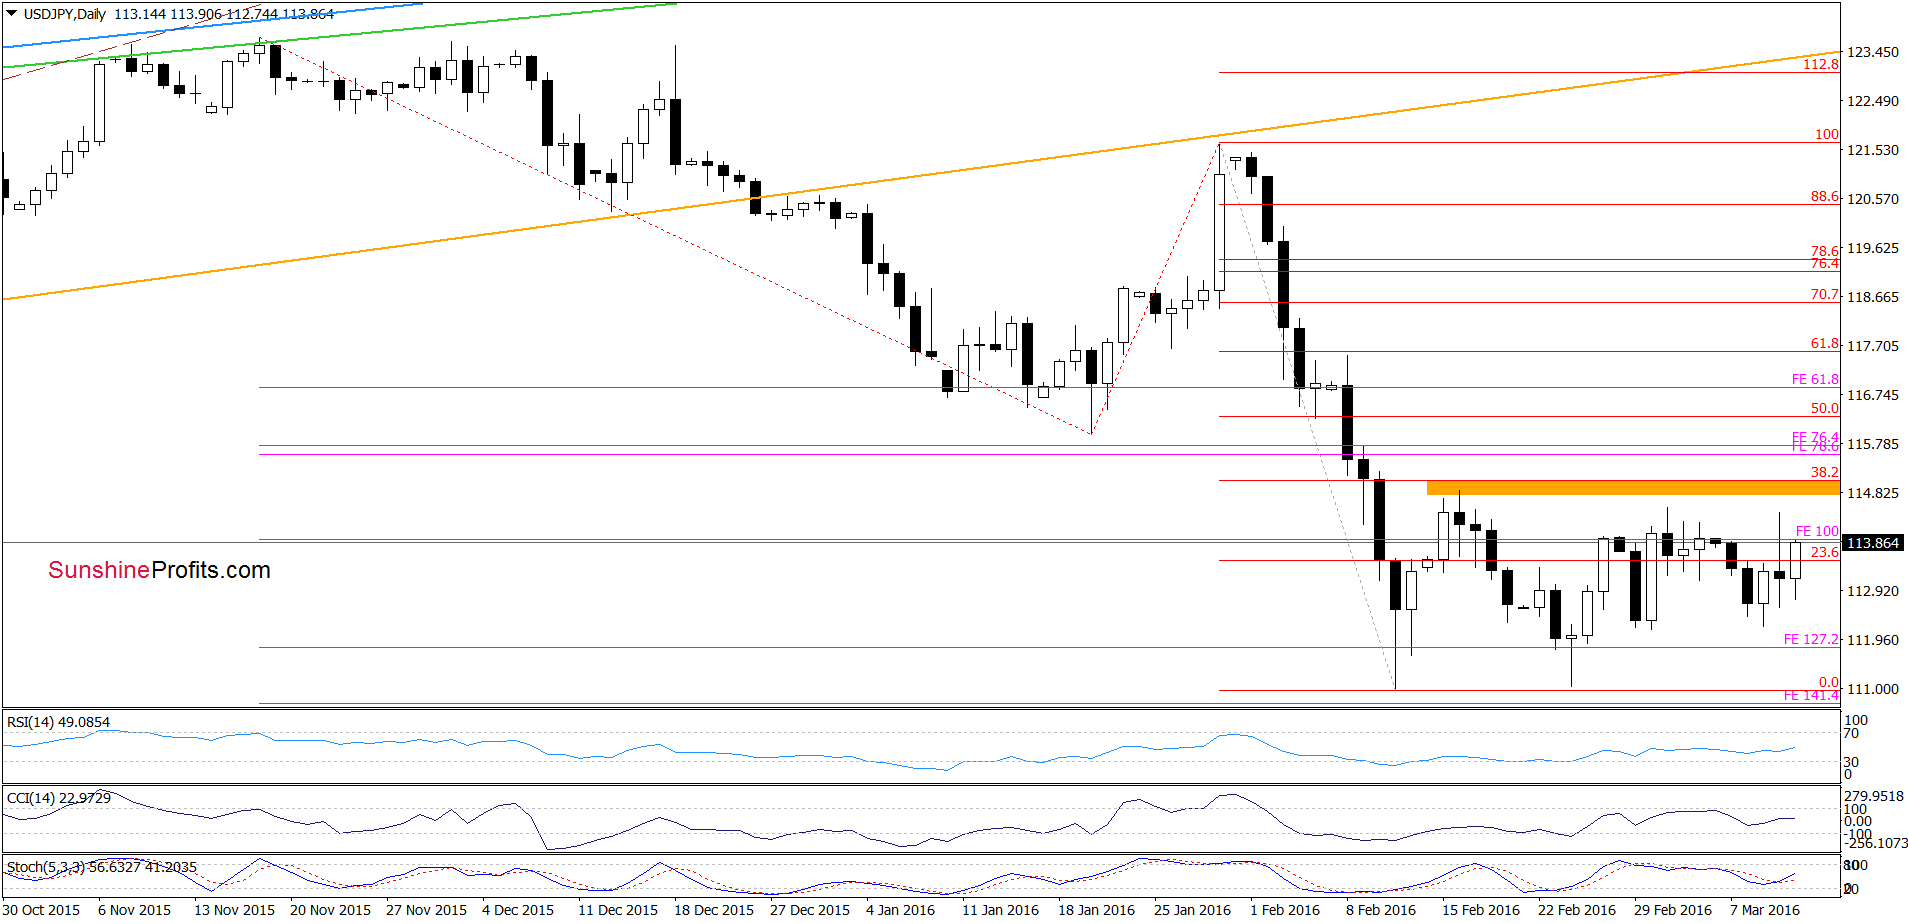
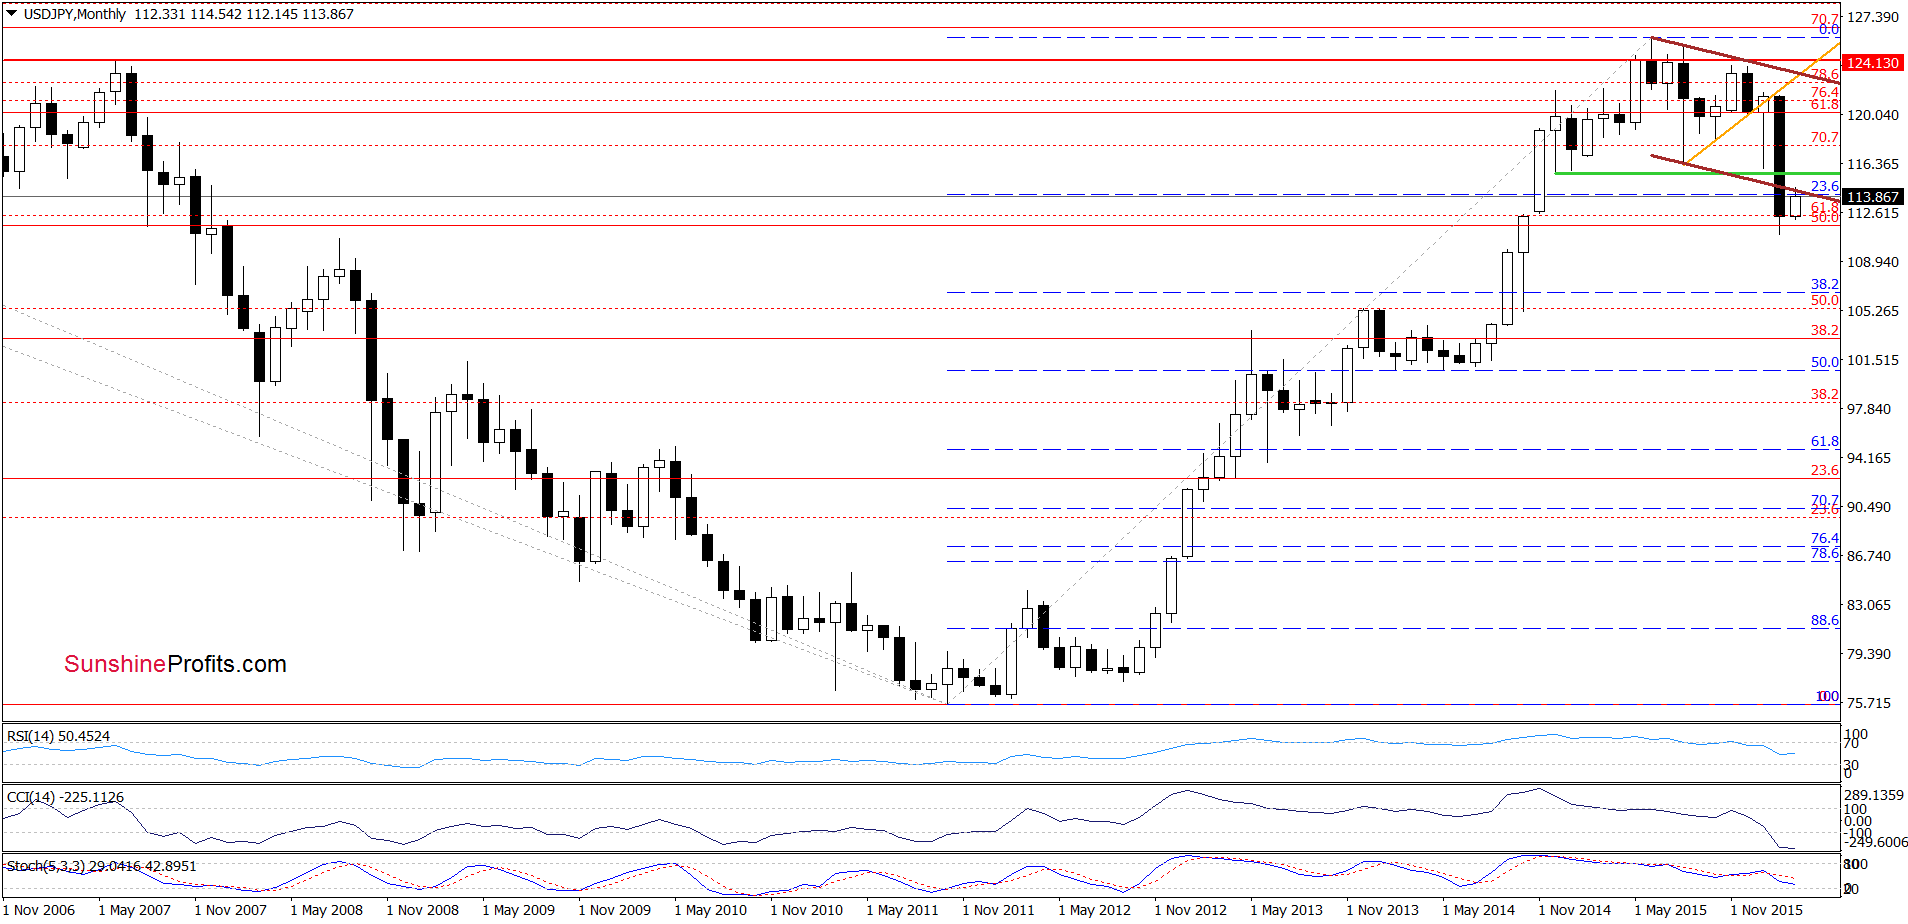
On the daily chart, we see that although USD/JPY moved higher in recent days, the pair remains under the orange resistance zone created by the mid-Feb highs and the 38.2% Fibonacci retracement, which serves as the nearest resistance. When we taka closer look at the chart we notice that the Stochastic Oscillator generated a buy signal earlier today, which suggests further improvement. Nevertheless, in our opinion, as long as there won’t be a breakout above the orange zone another bigger upward move is not likely to be seen. Additionally, when we focus on the long-term chart below, we’ll see that the exchange rate remains under the previously-broken lower border of the brown declining trend channel, which means that as long as this resistance will be in play all gains would be nothing more than a verification of earlier breakdown.
Very short-term outlook: mixed
Short-term outlook: mixed
MT outlook: mixed
LT outlook: mixed
Trading position (short-term; our opinion): No positions are justified from the risk/reward perspective at the moment. We will keep you informed should anything change, or should we see a confirmation/invalidation of the above.
AUD/USD
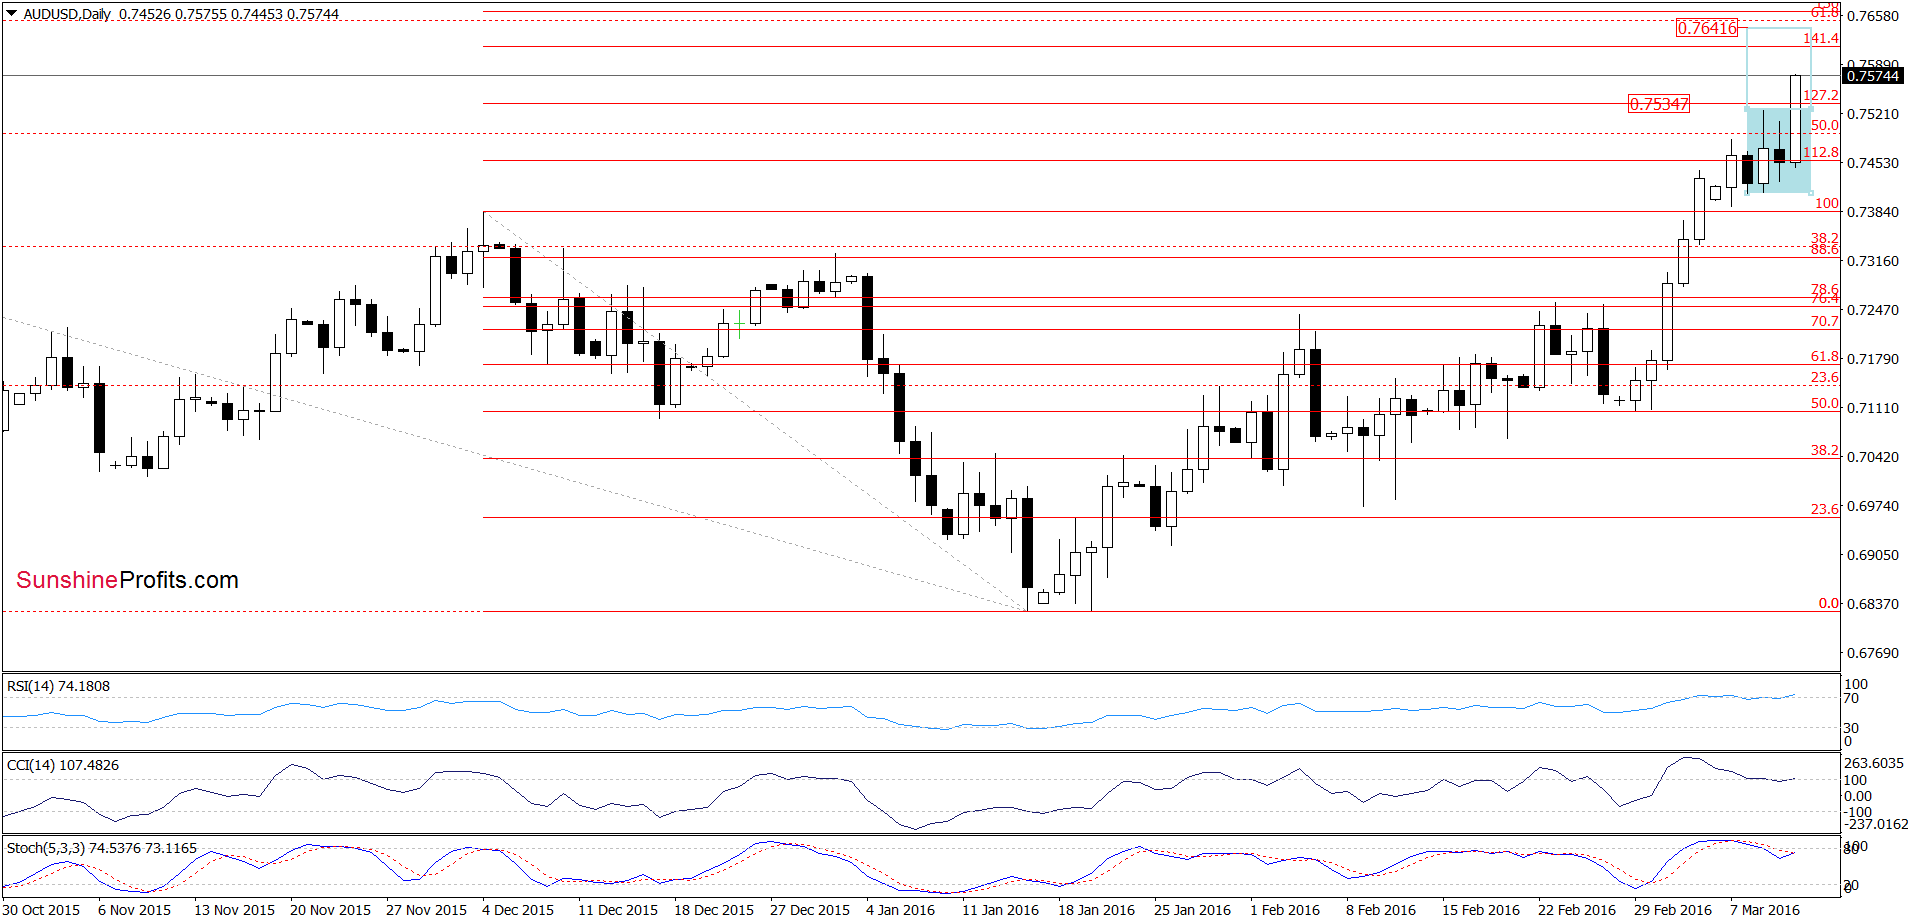
As you see on the daily chart, AUD/USD broke above the upper border of the blue consolidation (and the 127.2% Fibonacci retracement), which suggests an increase to around 0.7641, where the size of the move will correspond to the height of the formation.
Are there any factors that could hinder the realization of the above scenario? Let’s examine the weekly chart and find out.
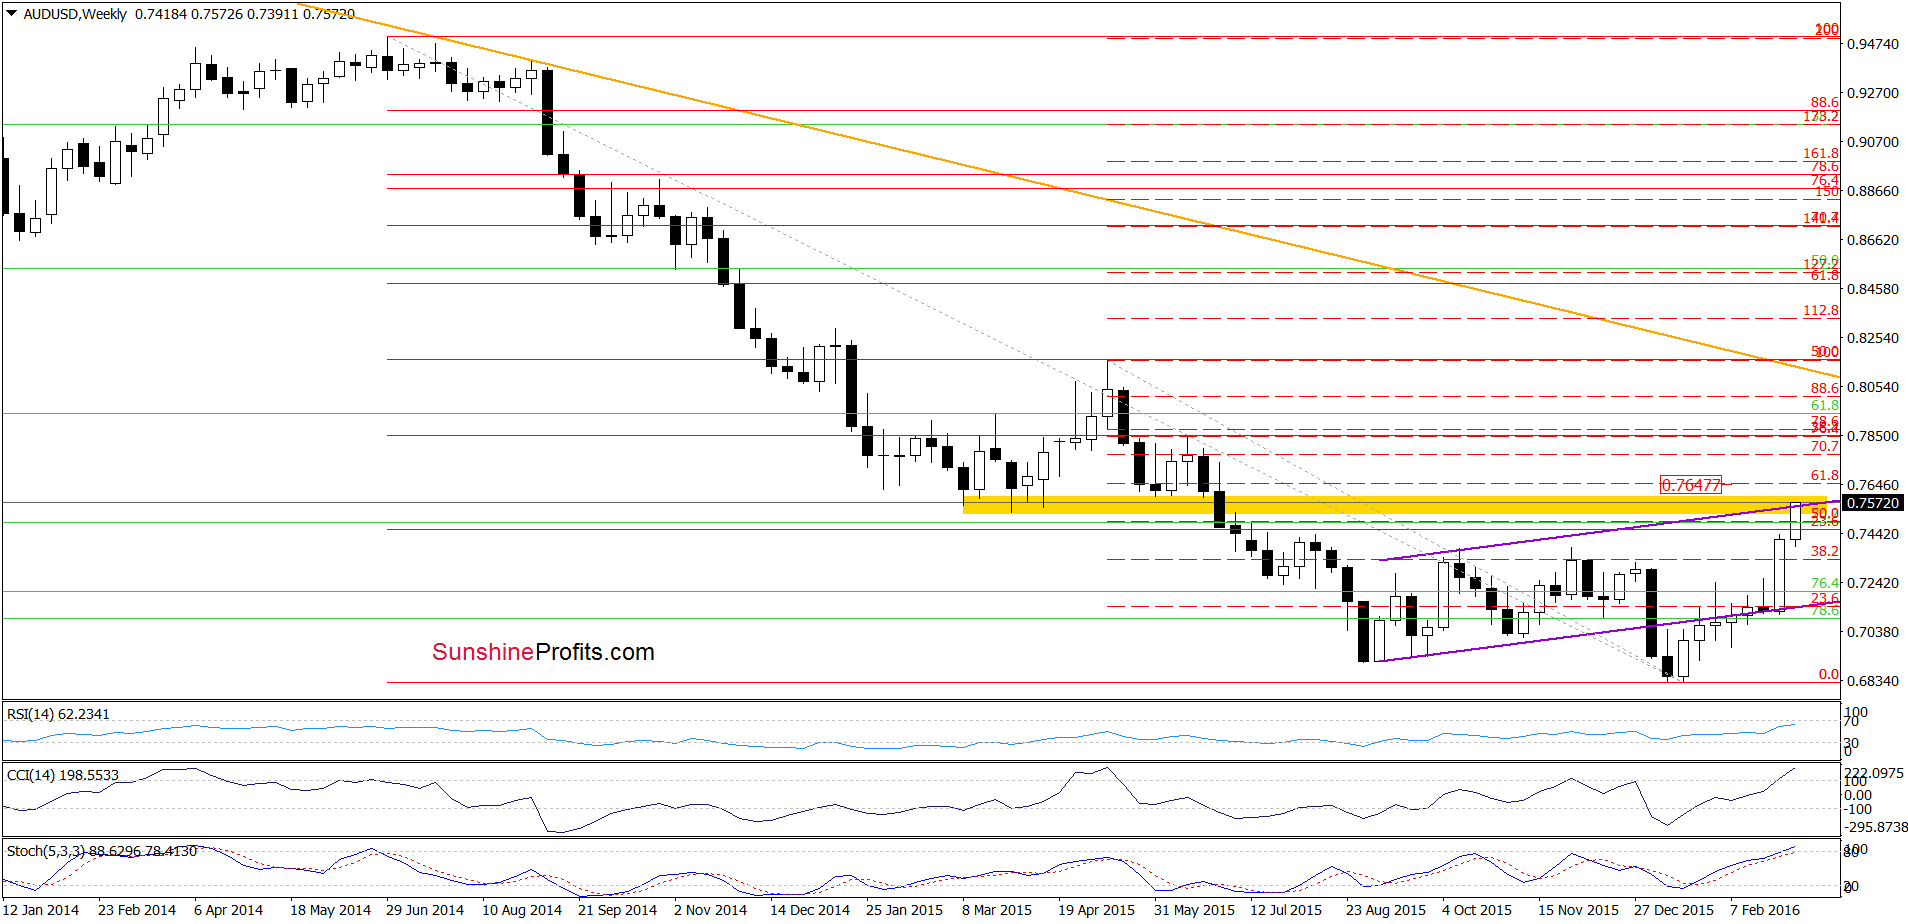
From this perspective we see that AUD/USD extended gains, breaking above the 50% Fibonacci retracement (based on the entire May-Jan downward move) and reaching the yellow resistance zone (created by the upper border of the purple rising trend channel and Mar 2015 lows). If this area doesn’t stop currency bulls, we’ll see a realization of the above-mentioned scenario or even a test of the 61.8% Fibonacci retracement in the coming week. Nevertheless, the current position of daily and weekly indicators suggests that the space for gains may be limited and reversal is just around the corner.
Very short-term outlook: mixed with bullish bias
Short-term outlook: mixed
MT outlook: mixed
LT outlook: mixed
Trading position (short-term; our opinion): No positions are justified from the risk/reward perspective. We will keep you informed should anything change, or should we see a confirmation/invalidation of the above.
Thank you.
Nadia Simmons
Forex & Oil Trading Strategist
Przemyslaw Radomski, CFA
Founder, Editor-in-chief
Gold & Silver Trading Alerts
Forex Trading Alerts
Oil Investment Updates
Oil Trading Alerts

