

Earlier today, the euro extended losses against the greenback before tomorrow's European Central Bank meeting. As a result, EUR/USD came back under the previously-broken support/resistance line, but will we see further declines in the coming days?
In our opinion the following forex trading positions are justified - summary:
- EUR/USD: short (stop-loss order at 1.1512; initial downside target at 1.0572)
- GBP/USD: none
- USD/JPY: none
- USD/CAD: none
- USD/CHF: none
- AUD/USD: none
EUR/USD
Quoting our previous alert:
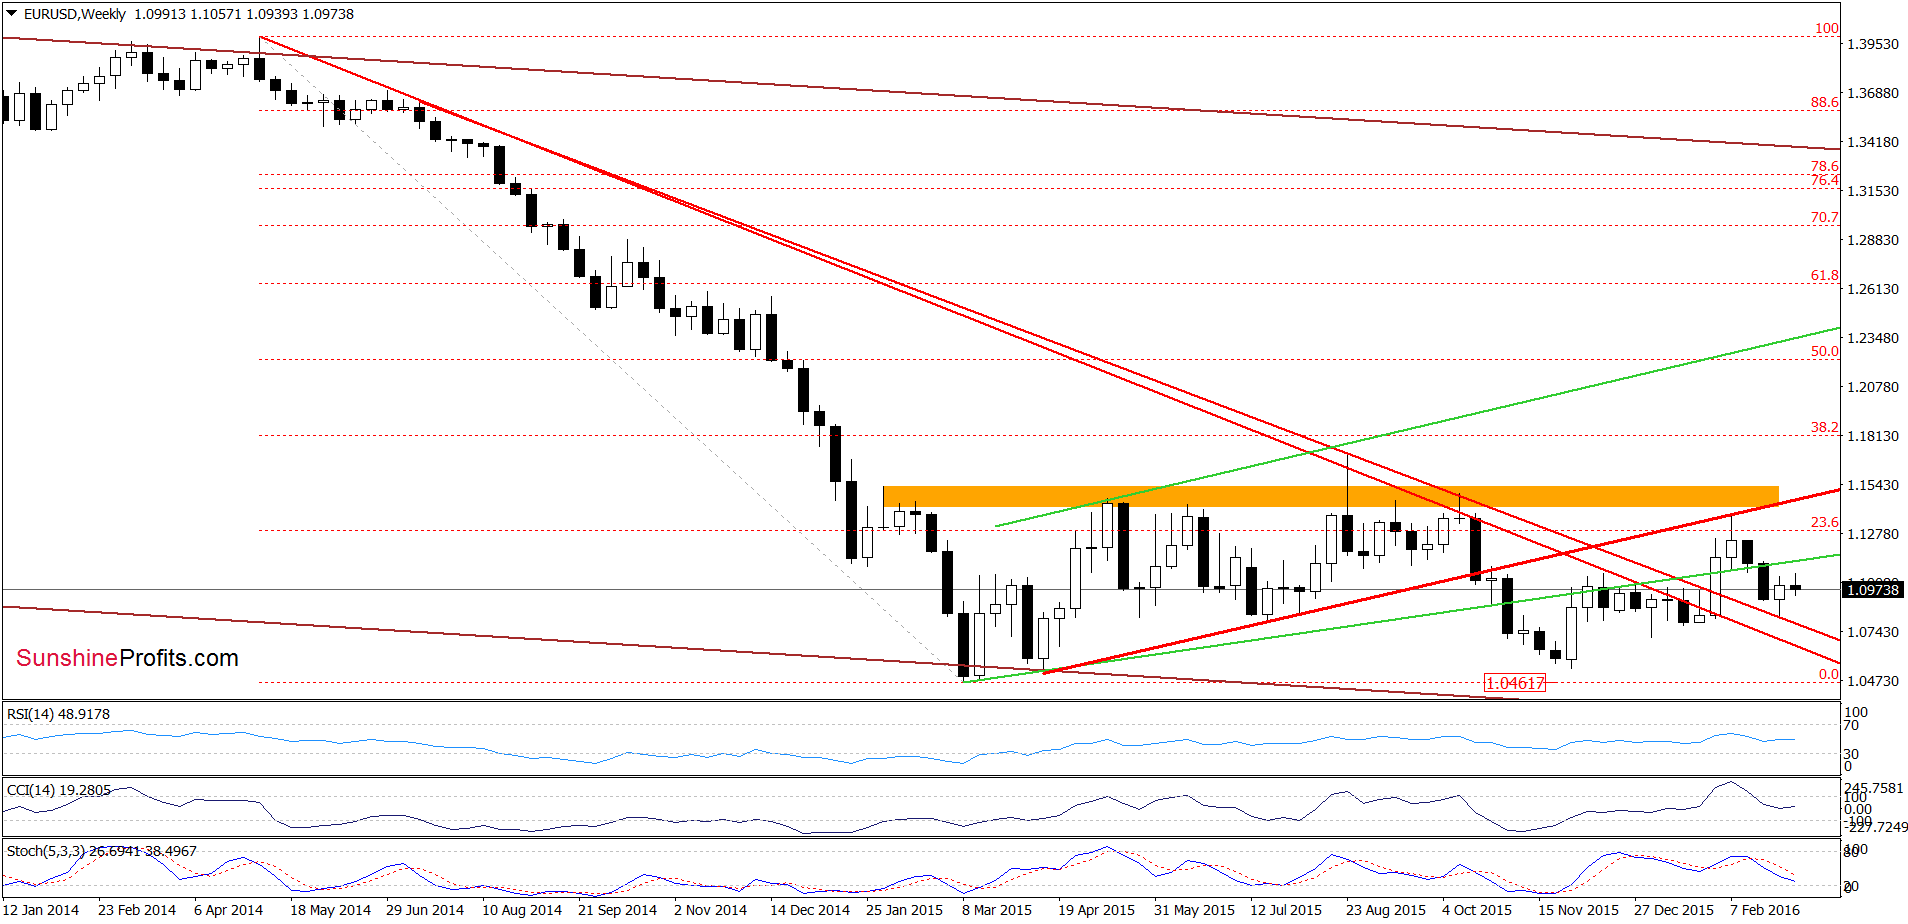
(…) the orange resistance zone (created by the 38.2% Fibonacci retracement and the horizontal resistance line based on the mid-Dec highs) continues to keep gains in check. Taking this fact into account, and combining it with the current position of the Stochastic Oscillator (the indicator is very lose to generating a sell signal), we think that reversal is just around the corner.
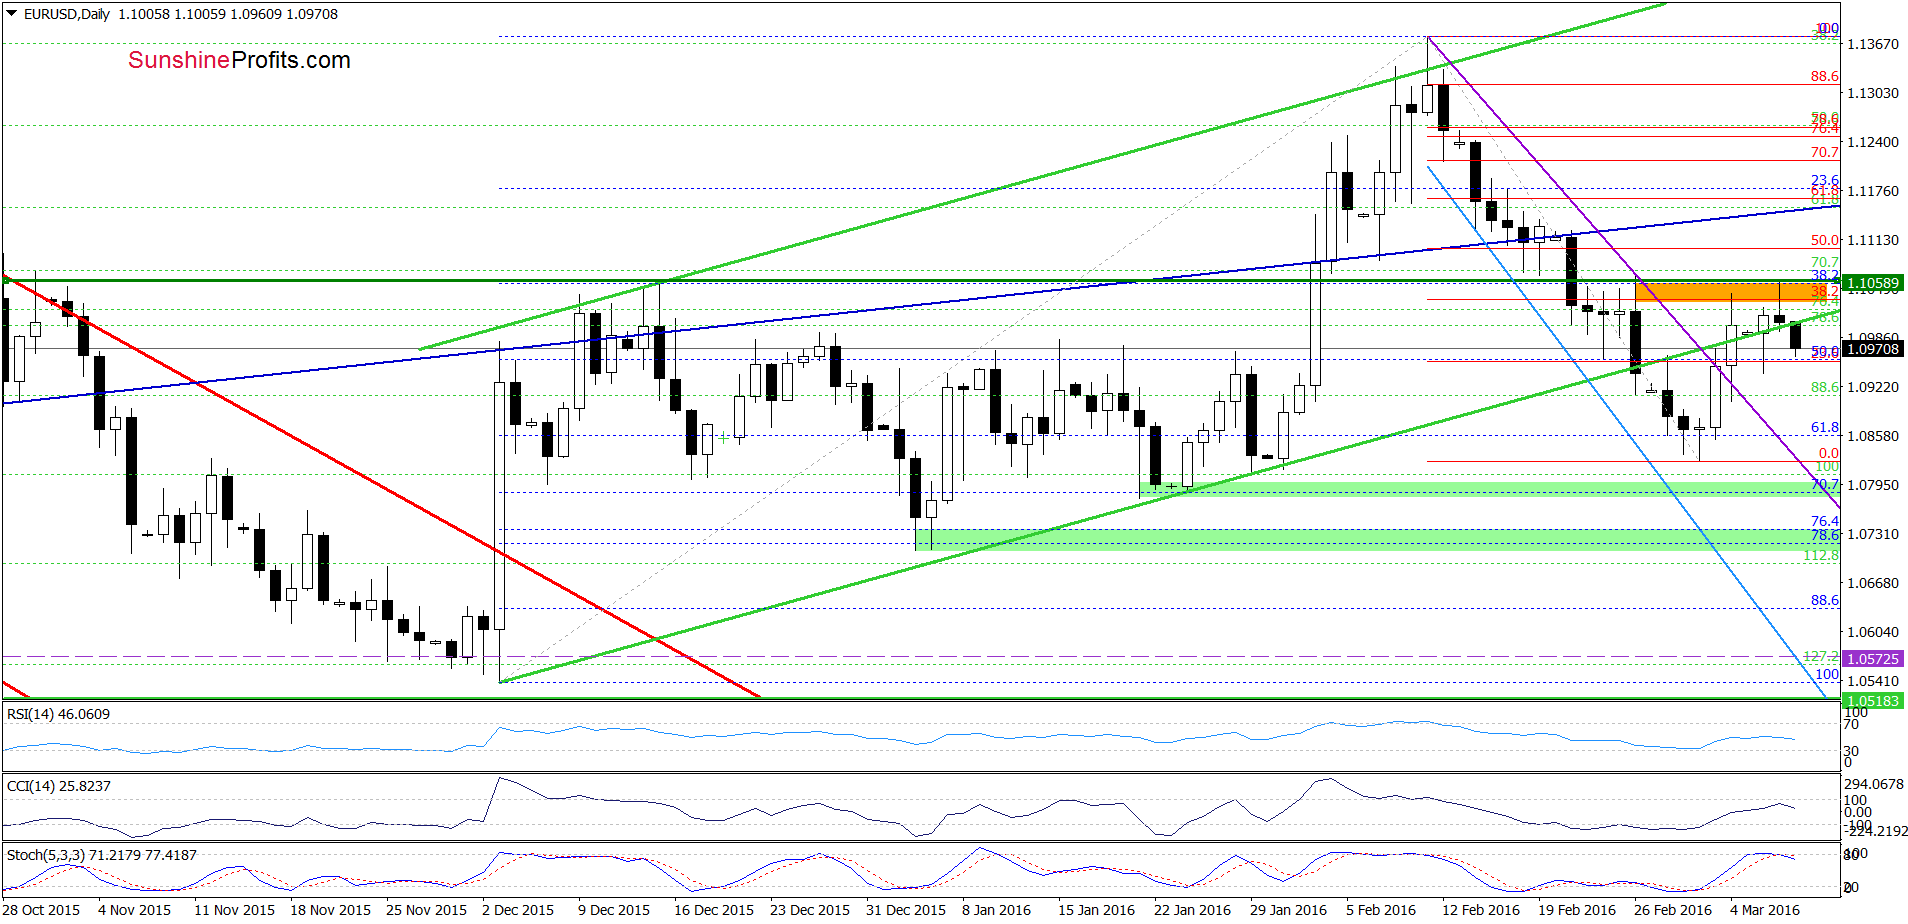
Looking at the daily chart, we see that the situation developed in line with the above scenario and EUR/USD moved lower. With today’s downswing, the pair slipped under the previously-broken lower border of the green rising trend channel, which suggests further deterioration – especially when we factor in a sell signal generated by the Stochastic Oscillator. Therefore, if the exchange rate extends declines from here, EUR/USD will test the strength of the recent lows and the purple declining support line.
Very short-term outlook: bearish
Short-term outlook: bearish
MT outlook: mixed with bearish bias
LT outlook: mixed
Trading position (short-term; our opinion): Short positions (with a stop-loss order at 1.1512 and the initial downside target at 1.0572) are justified from the risk/reward perspective. We will keep you informed should anything change, or should we see a confirmation/invalidation of the above.
USD/JPY
On Monday, we wrote:
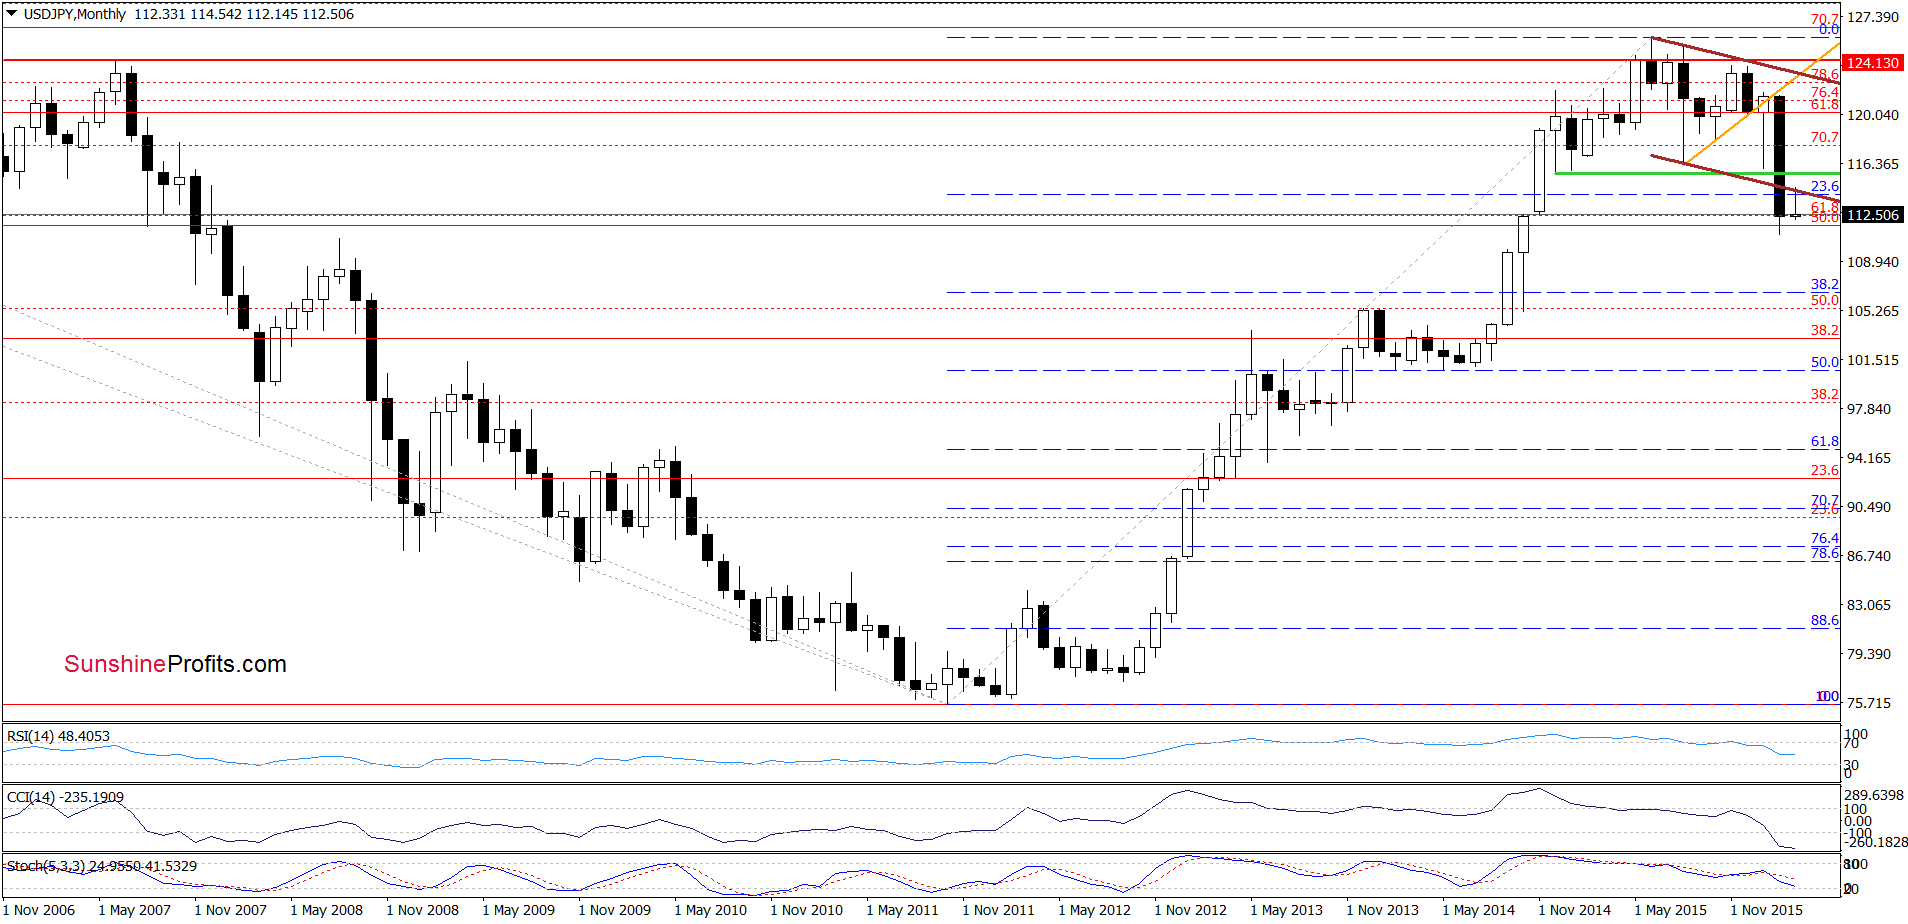
(…) the recent upswing took the exchange rate to the previously-broken lower border of the brown declining trend channel, which looks like a verification of earlier breakdown. Therefore, if the pair declines from here we may see a re-test of the recent lows in the coming week.
From today’s point of view, we see that currency bears pushed UD/JPY lower as we had expected. What impact did this drop have on the very short-term picture? Let’s check.
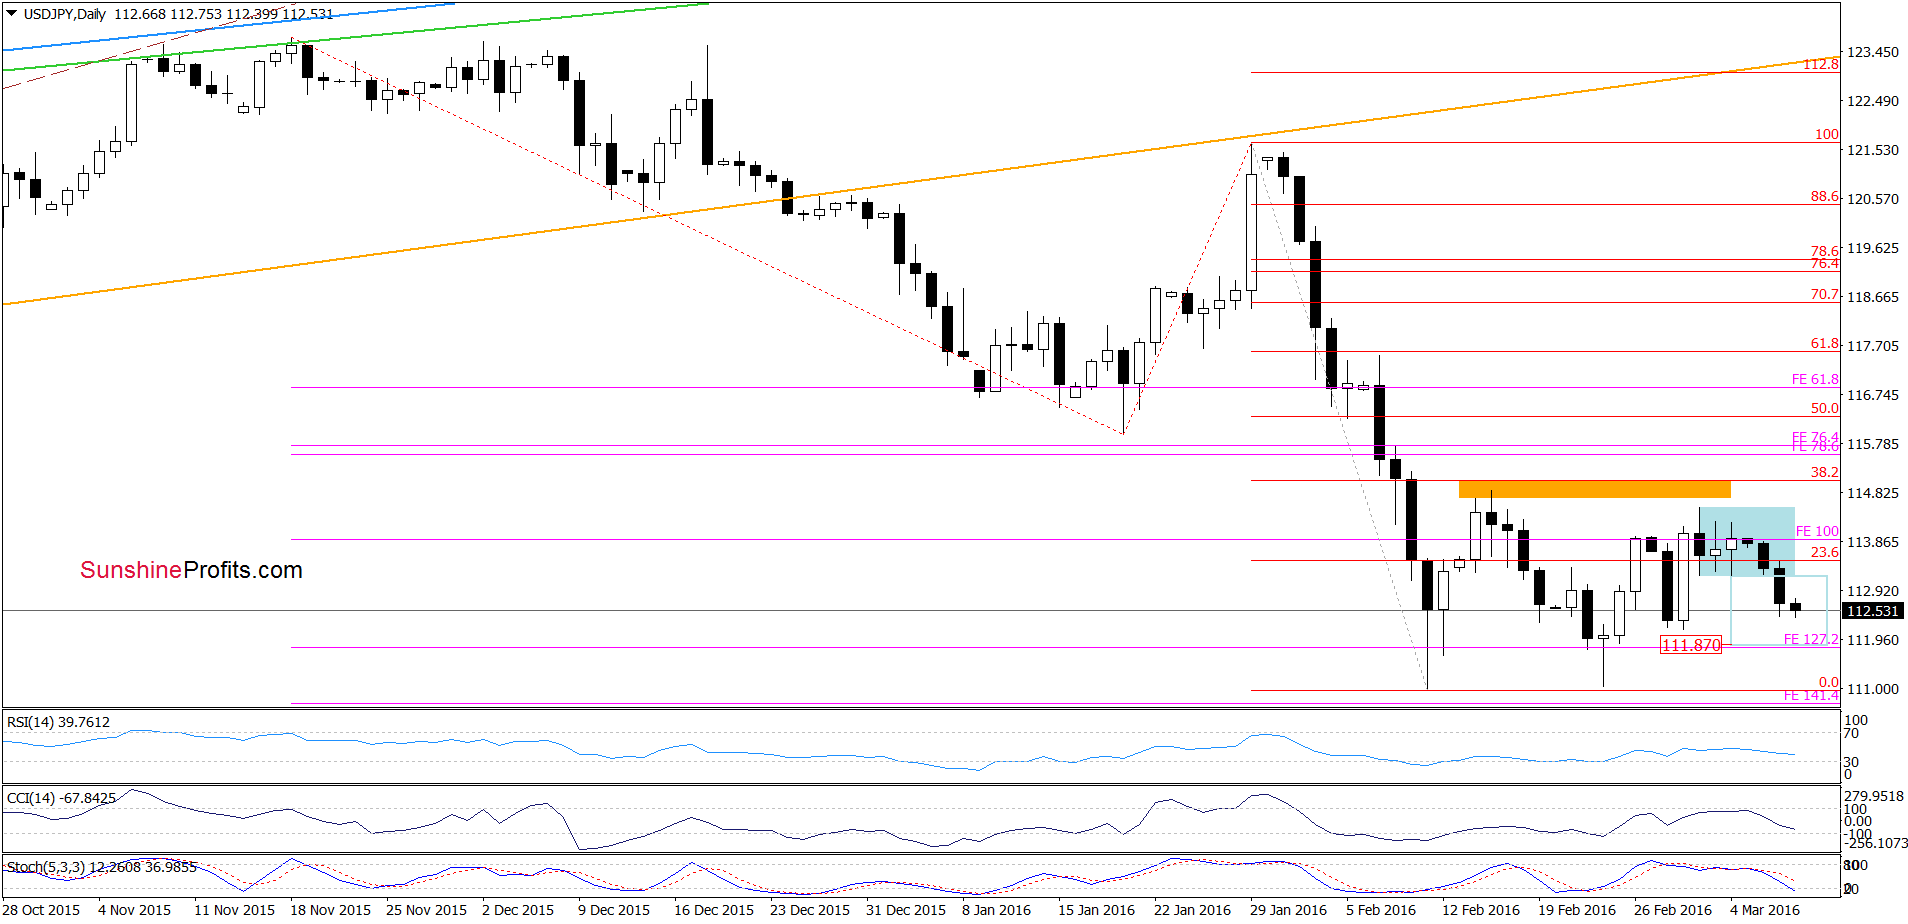
On the daily chart, we see that USD/JPY broke below the lower border of the blue consolidation, which suggests that we’ll see further deterioration and a drop to around 111.87, where the size f the move will correspond to the height of the formation (please note that the current position of the daily indicators supports currency bears).
Very short-term outlook: bearish
Short-term outlook: mixed with bearish bias
MT outlook: mixed
LT outlook: mixed
Trading position (short-term; our opinion): No positions are justified from the risk/reward perspective at the moment. We will keep you informed should anything change, or should we see a confirmation/invalidation of the above.
AUD/USD
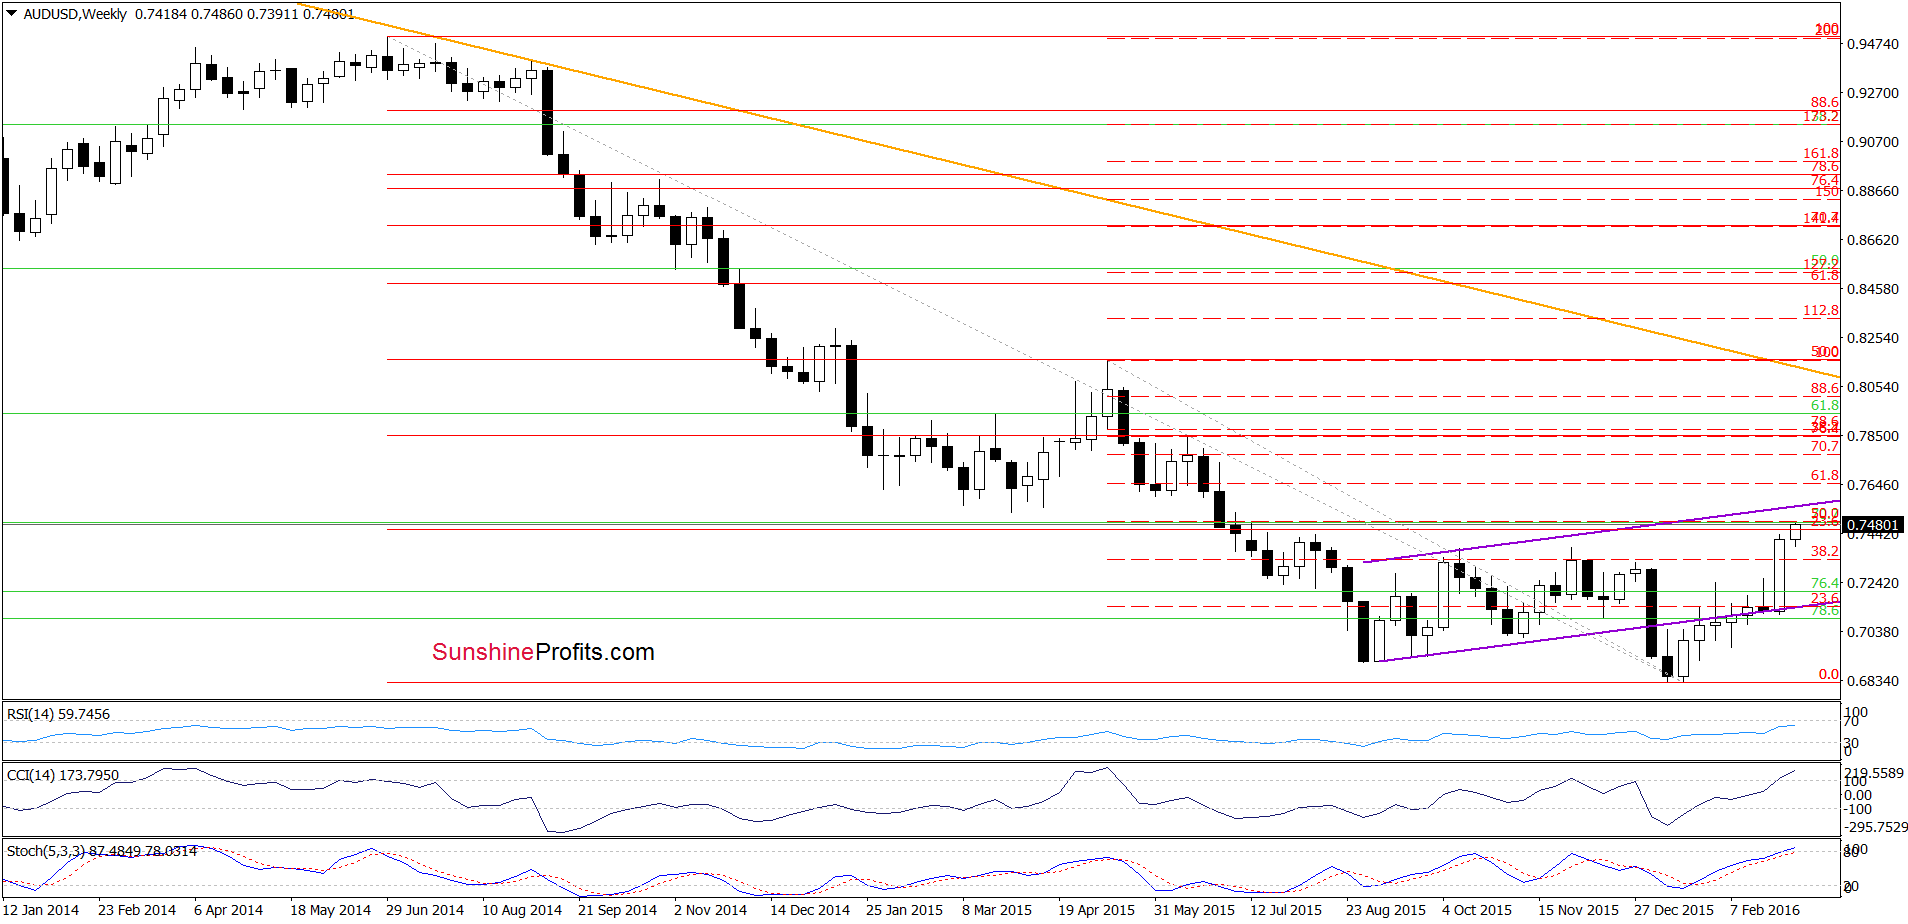
Quoting our Monday’s alert:
(…) AUD/USD bounced off the lower border of the purple rising trend channel and climbed above the 38.2% Fibonacci retracement based on the entire May-Jan downward move. This is a positive signal, which suggests that we’ll likely see a test of the next retracement (around 0.7500) or even the higher border of the formation.
Looking at the above chart, we see that AUD/USD extended gains as we had expected. With this move, the pair approached the 50% Fibonacci retracement based on the entire May-Jan downward move, which could encourage currency bears to act.
Are there any short-term factors that could support the realization of the above scenario? Let’s take a look at the daily chart and find out.
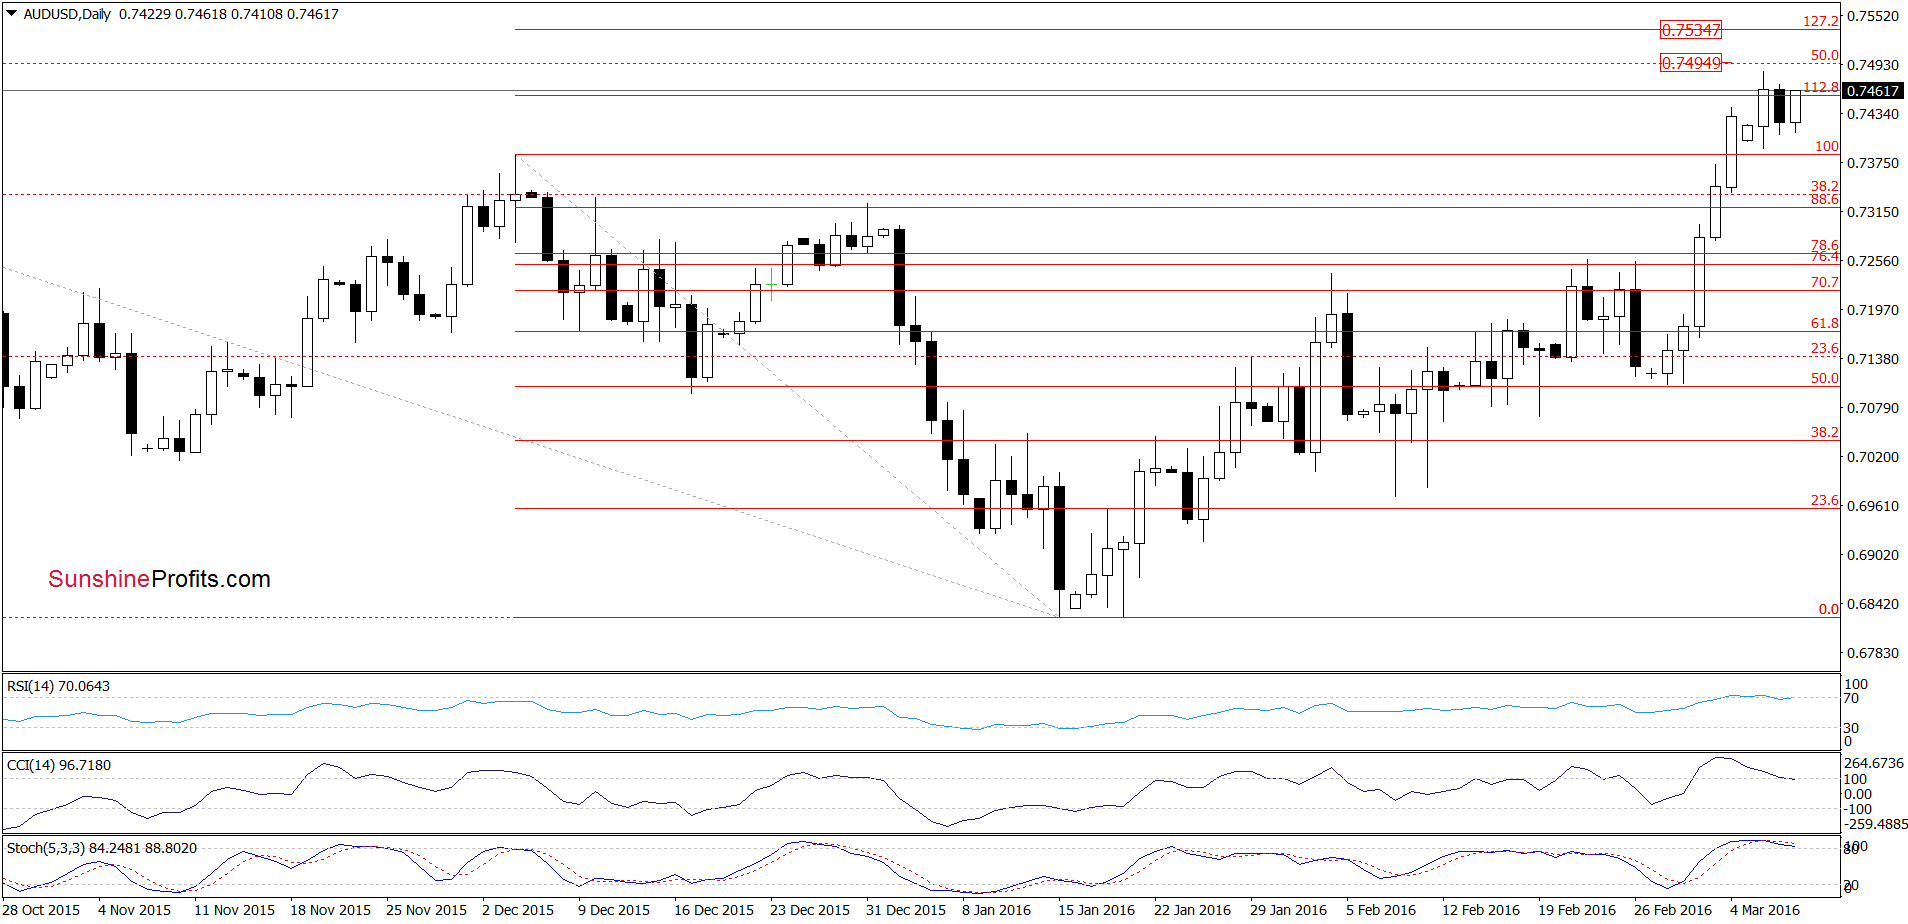
In our previous commentary on this currency pair, we wrote:
(…) AUD/USD broke above the previous highs, which suggests an increase to the 112.8% (around 0.7455)
On the daily chart, we see that AUD/USD reached the above-mentioned first upside target on Monday. Although the pair gave up some gains yesterday, we saw another reversal and rebound earlier today, which suggests a test of the barrier of 0.7500 or even 127.2% Fibonacci extension (around 0.7535) in the coming days. Nevertheless, we should keep in mind that all indicators are very close to generating sell signals, which suggests that reversal is just around the corner.
Very short-term outlook: mixed with bearish bias
Short-term outlook: mixed
MT outlook: mixed
LT outlook: mixed
Trading position (short-term; our opinion): No positions are justified from the risk/reward perspective. We will keep you informed should anything change, or should we see a confirmation/invalidation of the above.
Thank you.
Nadia Simmons
Forex & Oil Trading Strategist
Przemyslaw Radomski, CFA
Founder, Editor-in-chief
Gold & Silver Trading Alerts
Forex Trading Alerts
Oil Investment Updates
Oil Trading Alerts

