

Earlier today, the euro moved lower against the U.S. currency as Friday’s strong U.S. employment report for December continued to weigh on investors’ sentiment. As a result, EUR/USD moved away from the long-term resistance line – similarly to what we saw in previous months. Will we see further deterioration in the coming week?
In our opinion the following forex trading positions are justified - summary:
- EUR/USD: short (stop-loss order at 1.1363; initial downside target at 1.0462)
- GBP/USD: none
- USD/JPY: none
- USD/CAD: none
- USD/CHF: none
- AUD/USD: none
EUR/USD
Quoting our Friday’s alert:
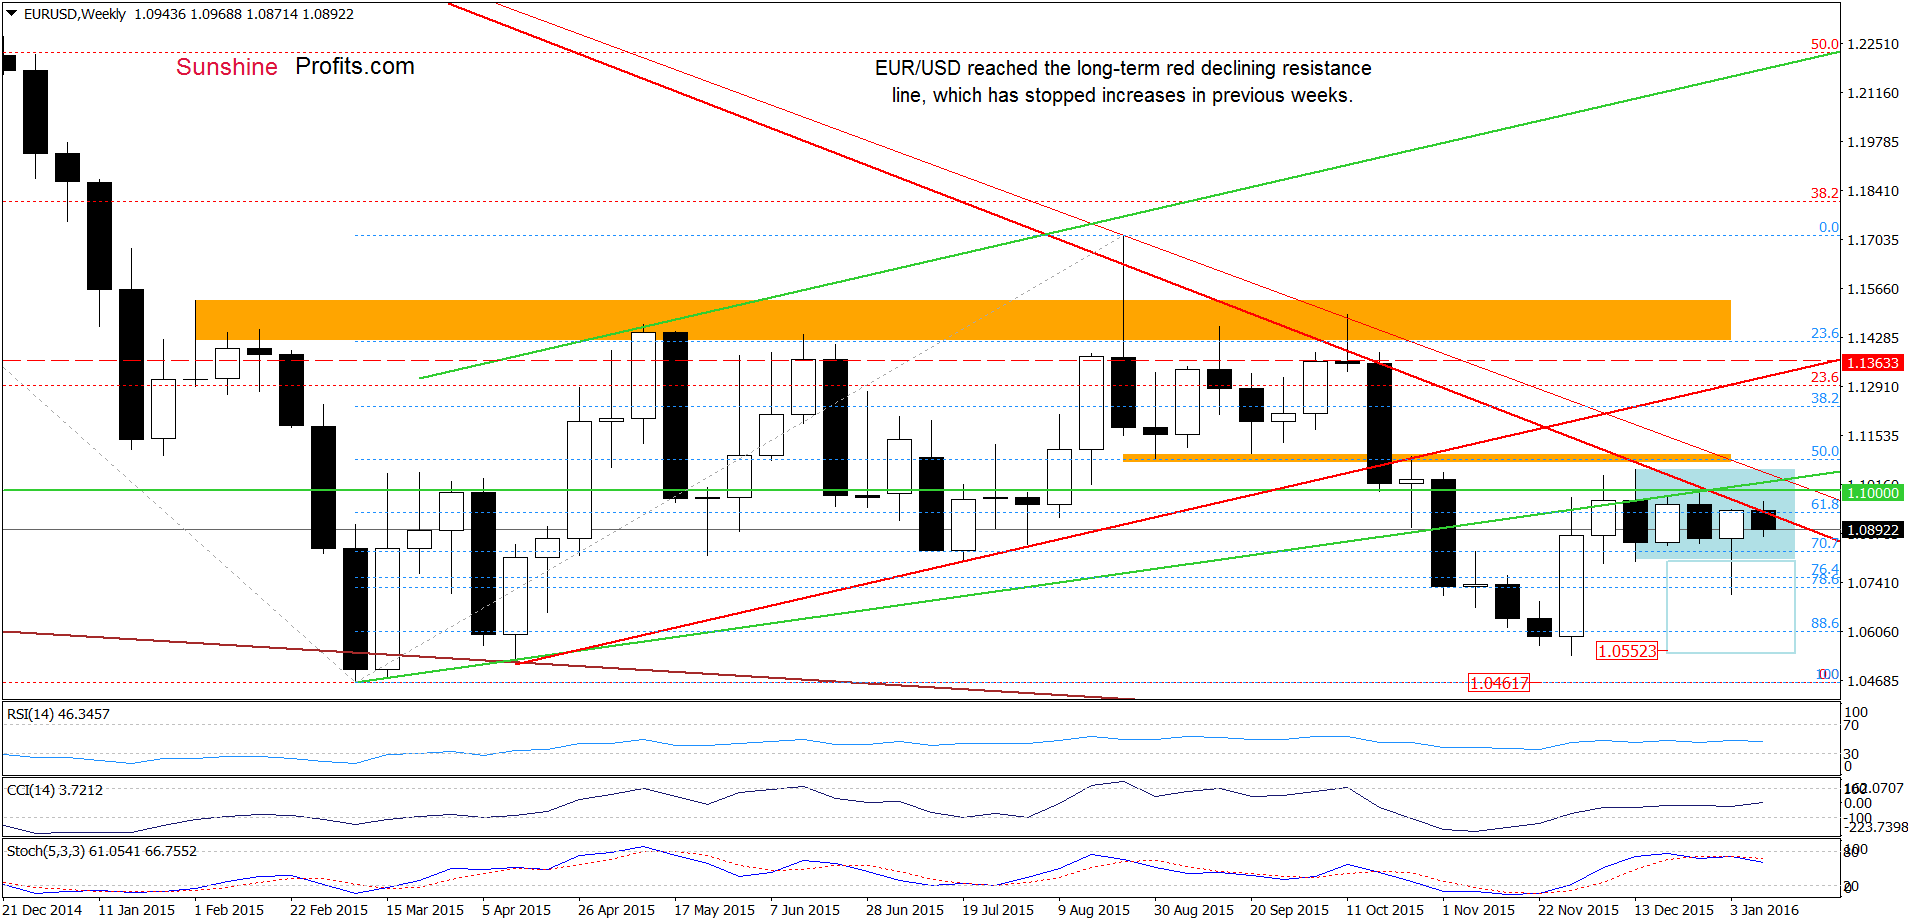
(…) the pair remains under the solid resistance zone (marked on the weekly chart) created by the previously-broken green resistance line, the barrier of 1.1000, the orange resistance zone and the long-term red declining resistance lines, which successfully stopped further rally in recent weeks. Therefore, we believe that as long as there won’t be a breakout above this area, another attempt to move lower is more likely than not.
Looking at the weekly chart, we see that although EUR/USD is still trading in the blue consolidation, currency bears pushed the pair lower as we had expected. As you see the recent upswing took the pair to the long-term red declining resistance line, which triggered a pullback earlier today. When we take a closer look at the medium-term chart, we can see that many times in the past, this key resistance line was strong enough to stop currency bulls, which suggests that we may see a reversal and bigger downward move in the coming week(s).
How did this move affect the very short-term picture? Let’s check.
On Friday, we wrote:
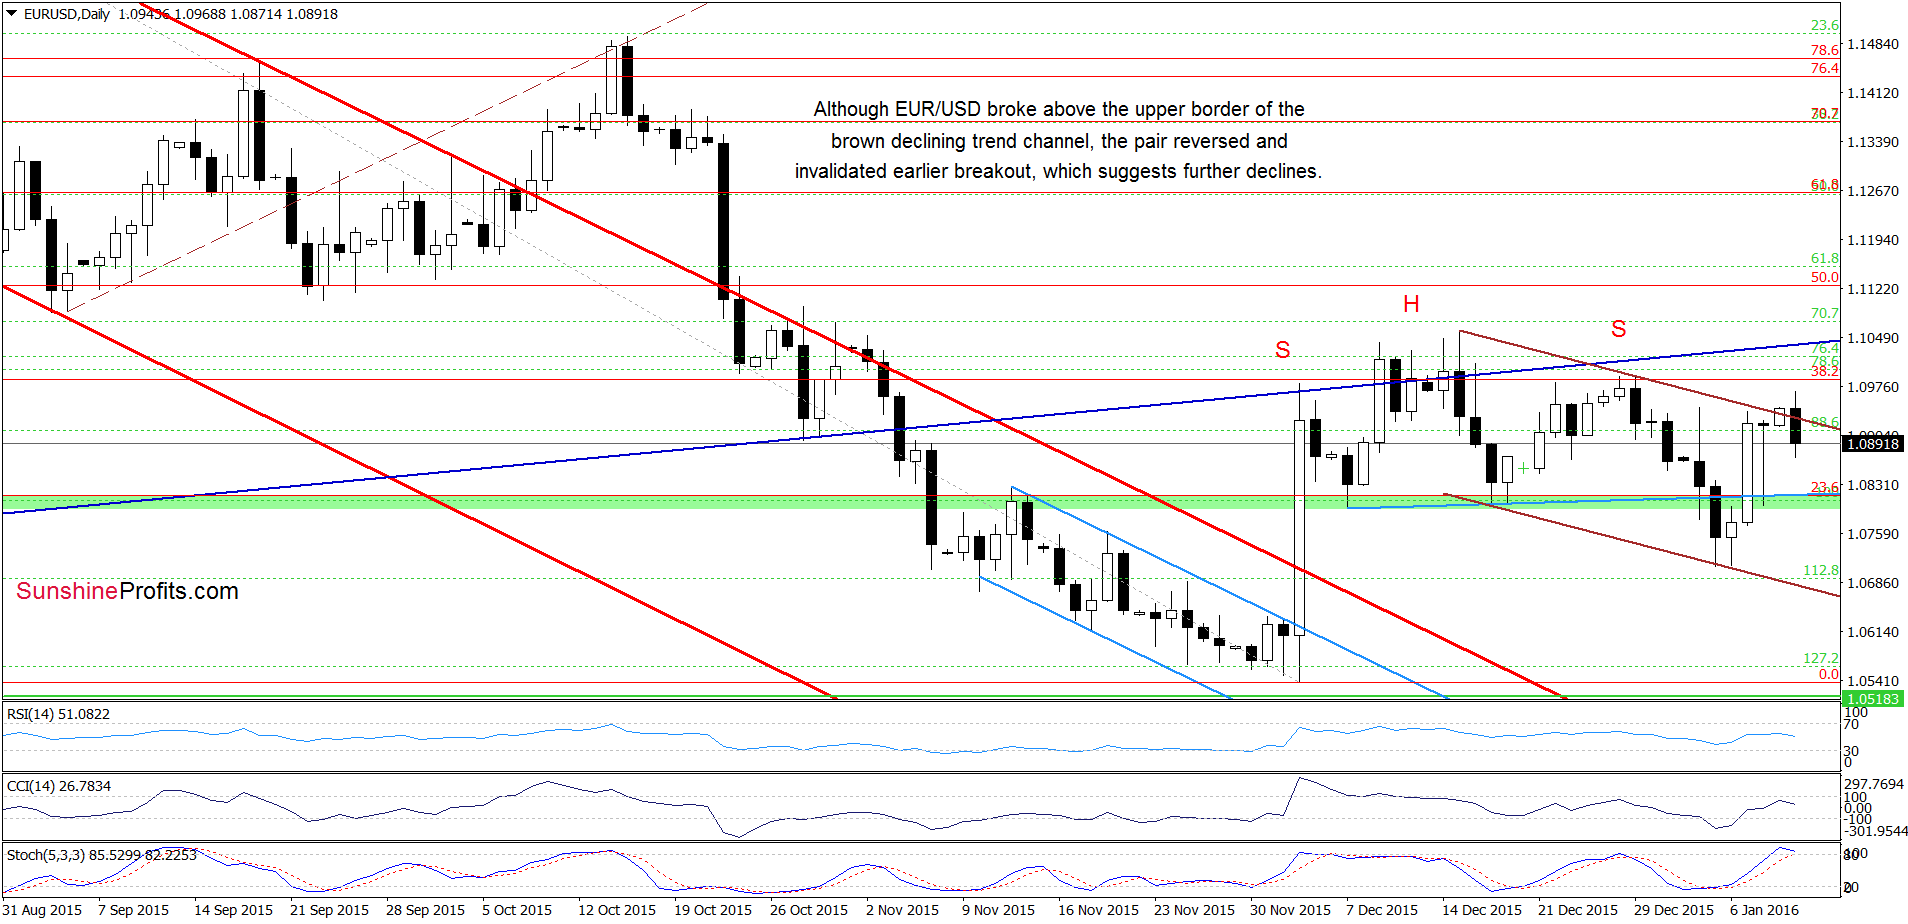
(…) the pair slipped to the green support zone (reinforced by the previously-broken neck line of the head and shoulders formation), which triggered a rebound in the following hours. Taking this fact into account, and combining it with a buy signal generated by the Stochastic Oscillator, it seems that currency bulls will try to push the pair to the upper line of the trend channel once again.
From today’s point of view, we see that the situation developed in line with the above scenario and EUR/USD broke above the upper border of the declining trend channel. Despite this improvement, the exchange rate reversed and declined, invalidating earlier breakout. This is a bearish signal, which in combination with the medium-term picture and the current position of the daily and weekly indicators (the weekly Stochastic Oscillator generated a sell signal, while the daily indicator is very close to doing the same) suggests further deterioration and another test of the green zone in near future.
Very short-term outlook: bearish
Short-term outlook: bearish
MT outlook: bearish
LT outlook: mixed
Trading position (short-term; our opinion): Short positions (with a stop-loss order at 1.1363 and the initial downside target at 1.0462) are justified from the risk/reward perspective. We will keep you informed should anything change, or should we see a confirmation/invalidation of the above.
GBP/USD
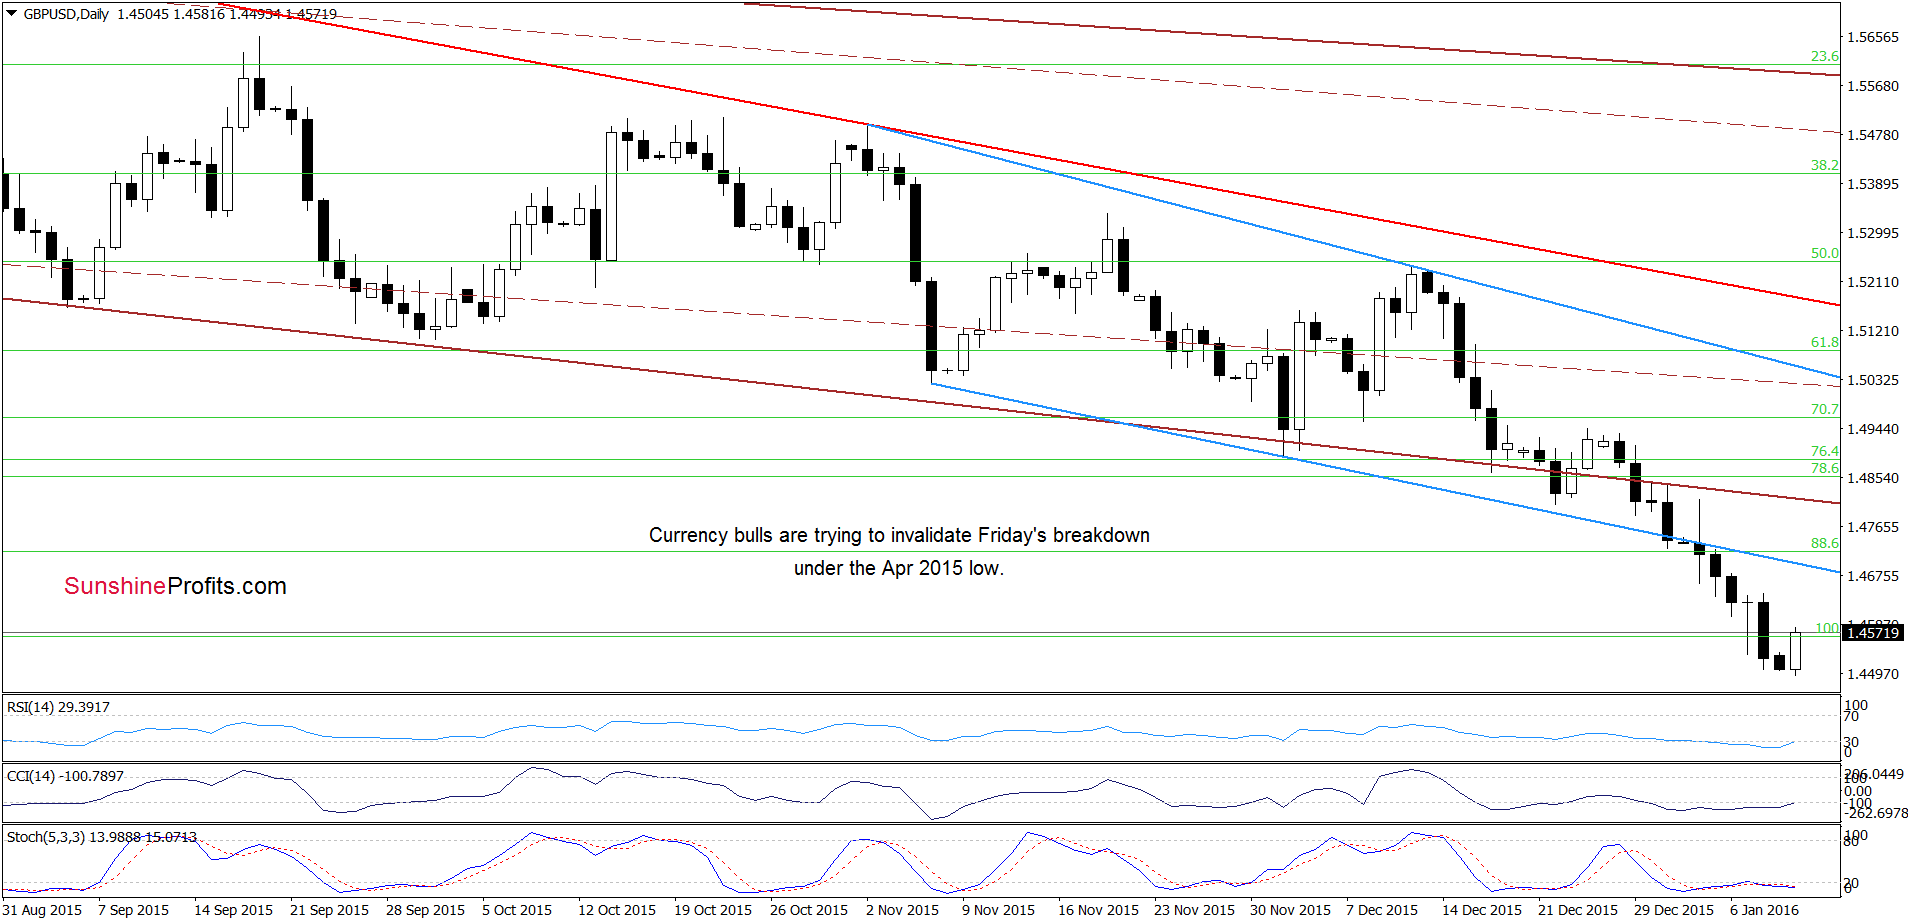
On the daily chart, we see that GBP/USD extended losses after the breakdown below the blue support line, which resulted in a drop under the Apr 2015 low. Although the pair invalidated this breakdown earlier today, we think that as long as there is no daily closure above the Apr low further improvement is questionable – especially when we factor in the medium-term picture.
On Wednesday, we wrote:
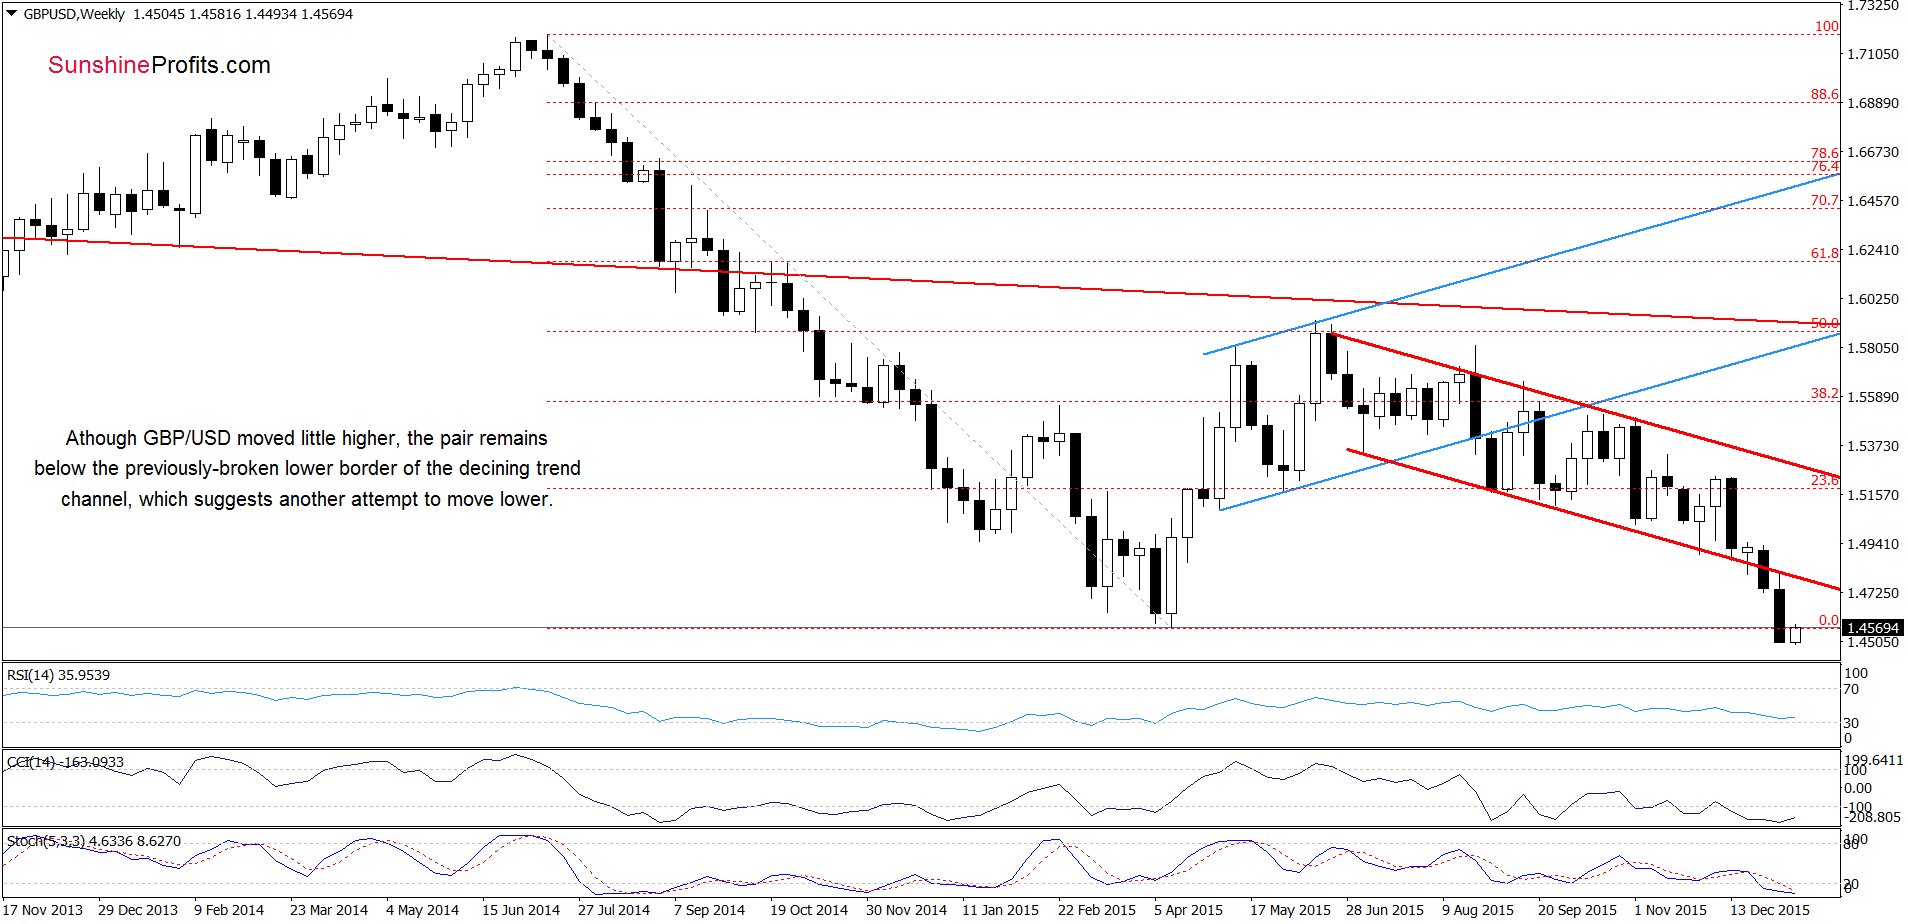
(…) GBP/USD verified earlier breakdown under the lower border of the red declining trend channel, which means that (...) If (…) the exchange rate moves lower from here, we could see a decline even to the Apr low in the coming weeks.
As you see on the weekly chart, the situation developed in line with the above scenario and the exchange rate reached our downside target. Although the pair rebounded earlier today, it is still trading under the previously-broken lower border of the red declining trend channel, which suggests that another attempt to move lower is likely. When can we expect a more reliable improvement? In our opinion, only if GBP/USD invalidates this breakdown, a bigger upward move will be more likely.
Very short-term outlook: mixed
Short-term outlook: mixed with bearish bias
MT outlook: mixed
LT outlook: mixed
Trading position (short-term; our opinion): No positions are justified from the risk/reward perspective at the moment. We will keep you informed should anything change, or should we see a confirmation/invalidation of the above.
USD/JPY
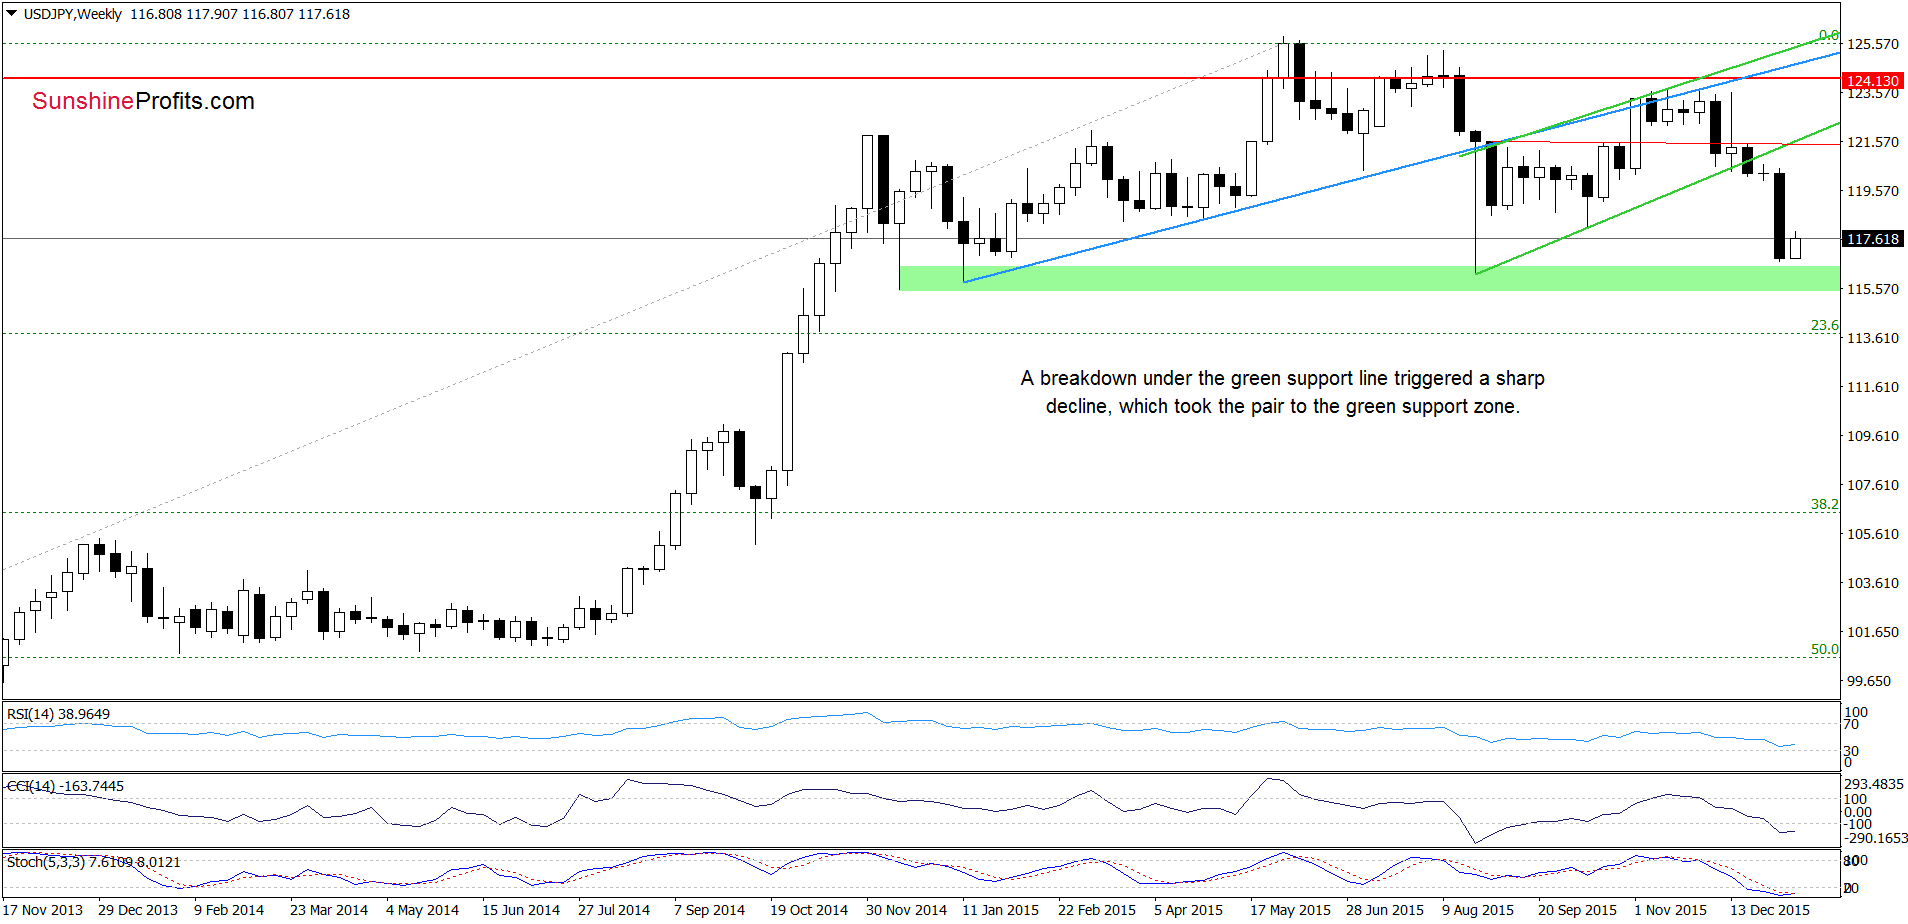
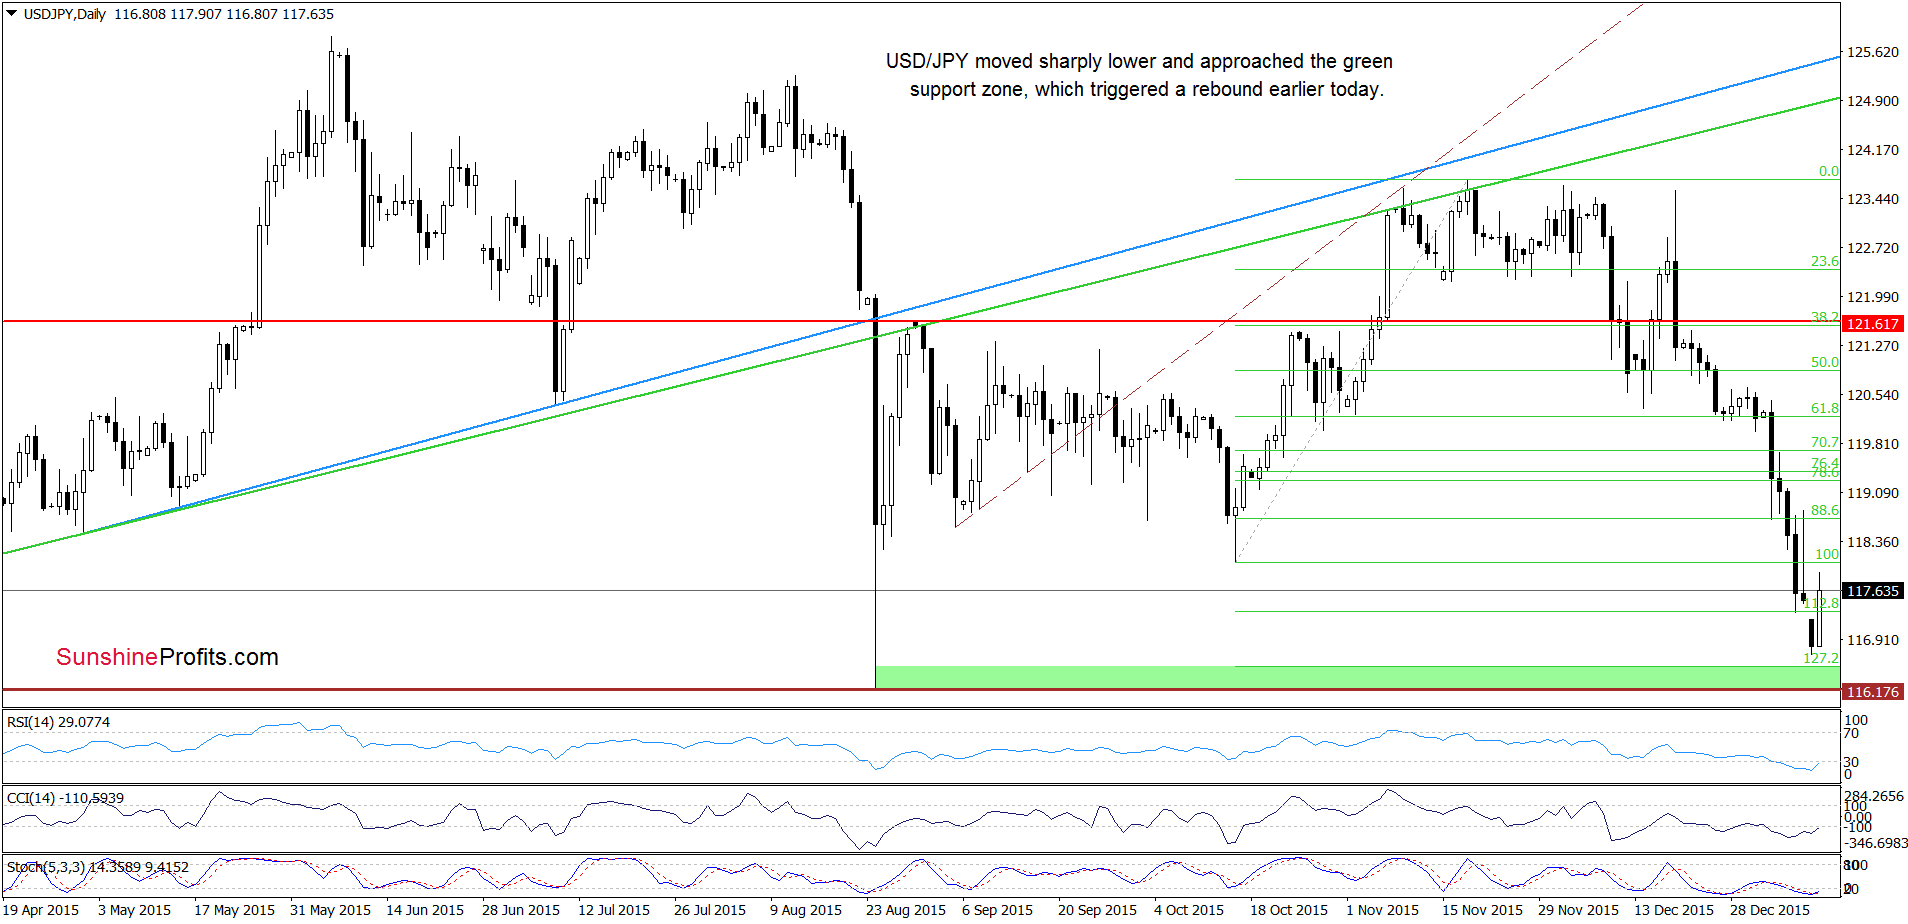
Looking at the above charts, we see that the breakdown under the green support line (marked on the weekly chart) triggered a sharp decline, which approached the exchange rate to the green support zone created by the Dec 2014, Jan 2015, Aug 2015 lows and the 127.2% Fibonacci extension. As you see on the charts this area encouraged currency bulls to act, which resulted in a rebound earlier today. What’s next? Taking into account the current position of the indicators (weekly and daily), we think that further improvement is just around the corner. If this is the case, and USD/JPY increases from here, the initial upside target would be around 118.30, where the 23.6% Fibonacci retracement (based on the recent downward move) is. If it is broken, the next target for currency bulls would be around 119.32 (the 38.2% retracement).
USD/CAD
Quoting our last commentary on this currency pair:
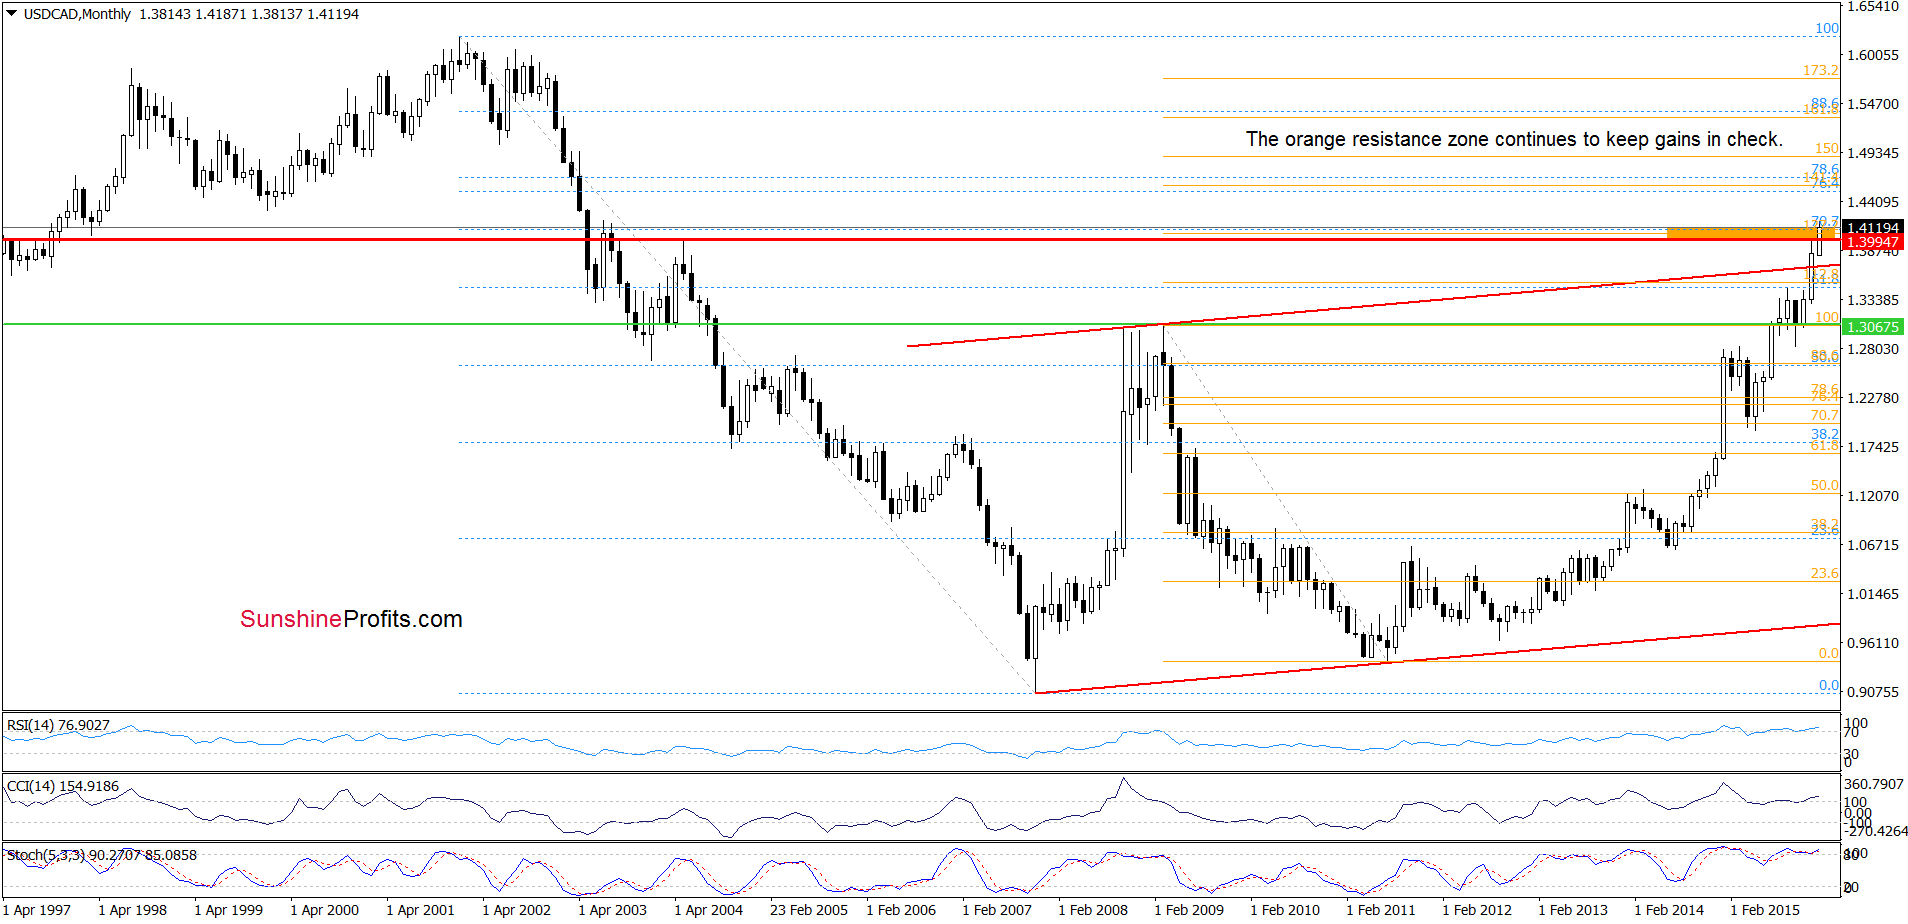
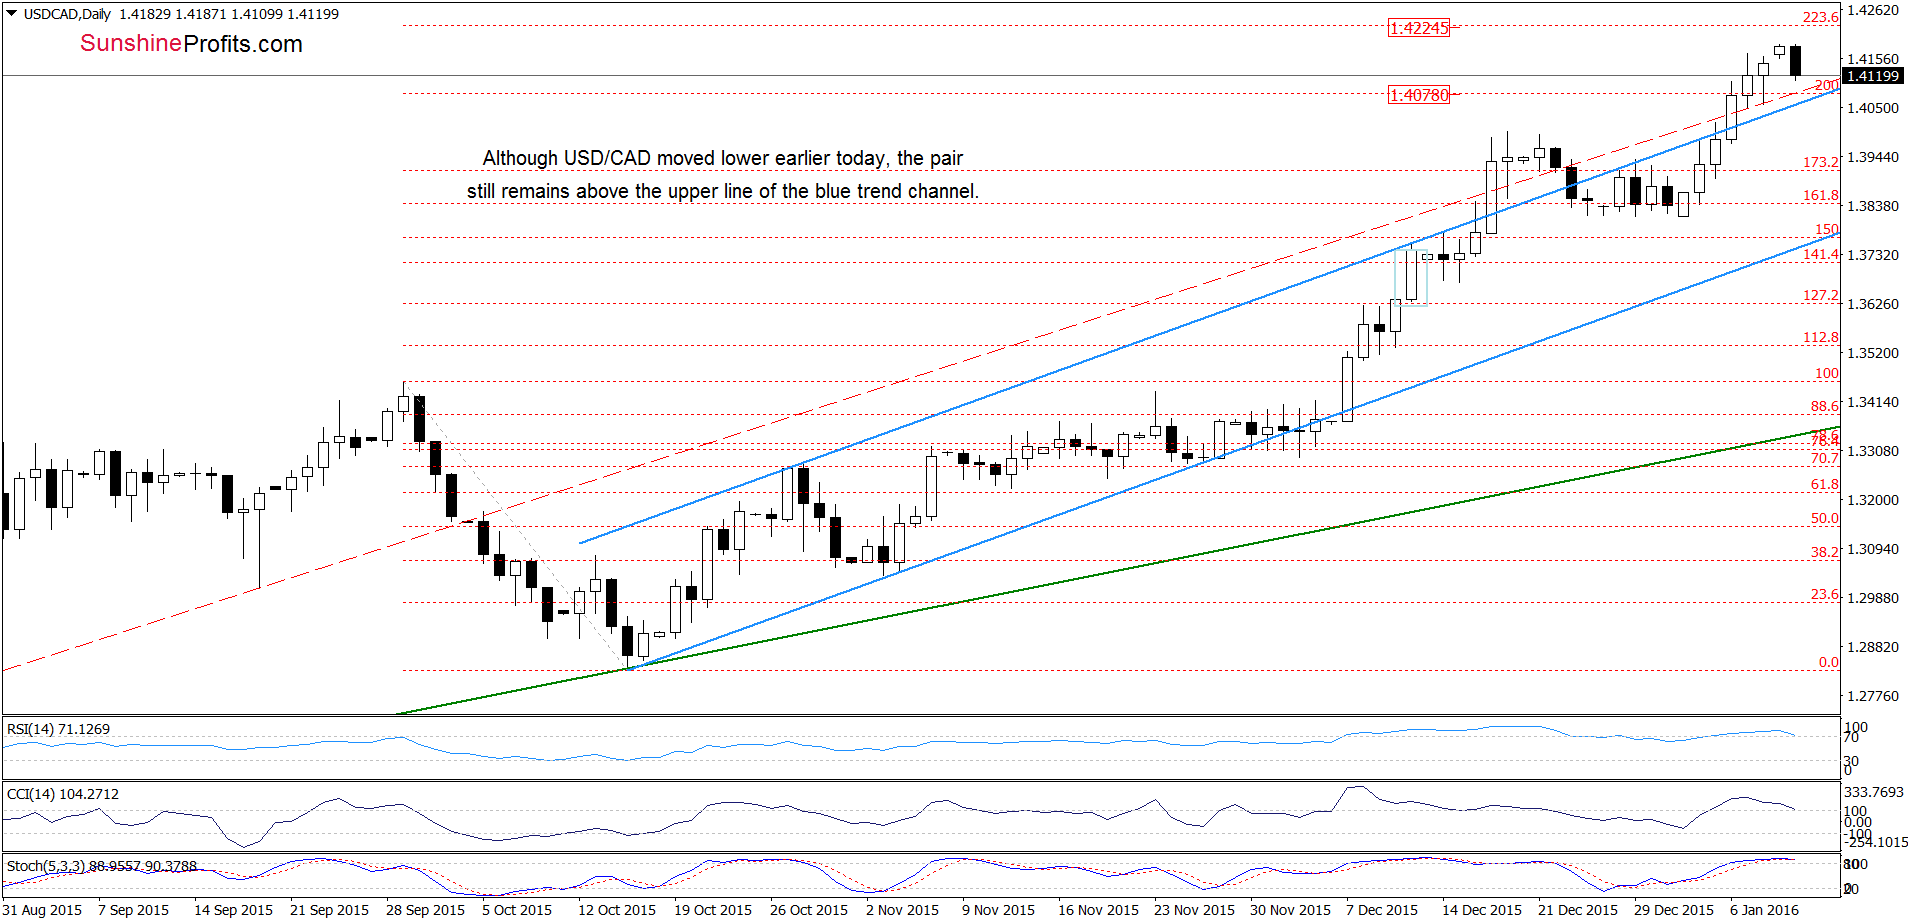
(…) USD/CAD came back above the upper line of the blue trend channel, invalidating earlier breakdown, which resulted in an increase to the 200% Fibonacci extension. Taking this fact into account, and combining it with the current position of the indictors, we think that another upswing is just around the corner
From today’s point of view, we see that although currency bulls pushed the exchange rate higher (as we had expected), the orange resistance zone (marked on the long-term chart) encouraged their opponents to act, which resulted in a pullback. Taking this fact and the current position of the daily indicators into account, we think that the pair will drop to the previously-broken upper line of the blue trend channel in near future. If it withstands the selling pressure, we’ll likely see a fresh multi-year high, however, if it is broken, it would be a negative signal, which will likely translate into a decline to around 1.3813-1.3840 (the bottom of the previous correction).
Very short-term outlook: mixed
Short-term outlook: mixed
MT outlook: mixed
LT outlook: mixed
Trading position (short-term; our opinion): No positions are justified from the risk/reward perspective at the moment. We will keep you informed should anything change, or should we see a confirmation/invalidation of the above.
USD/CHF
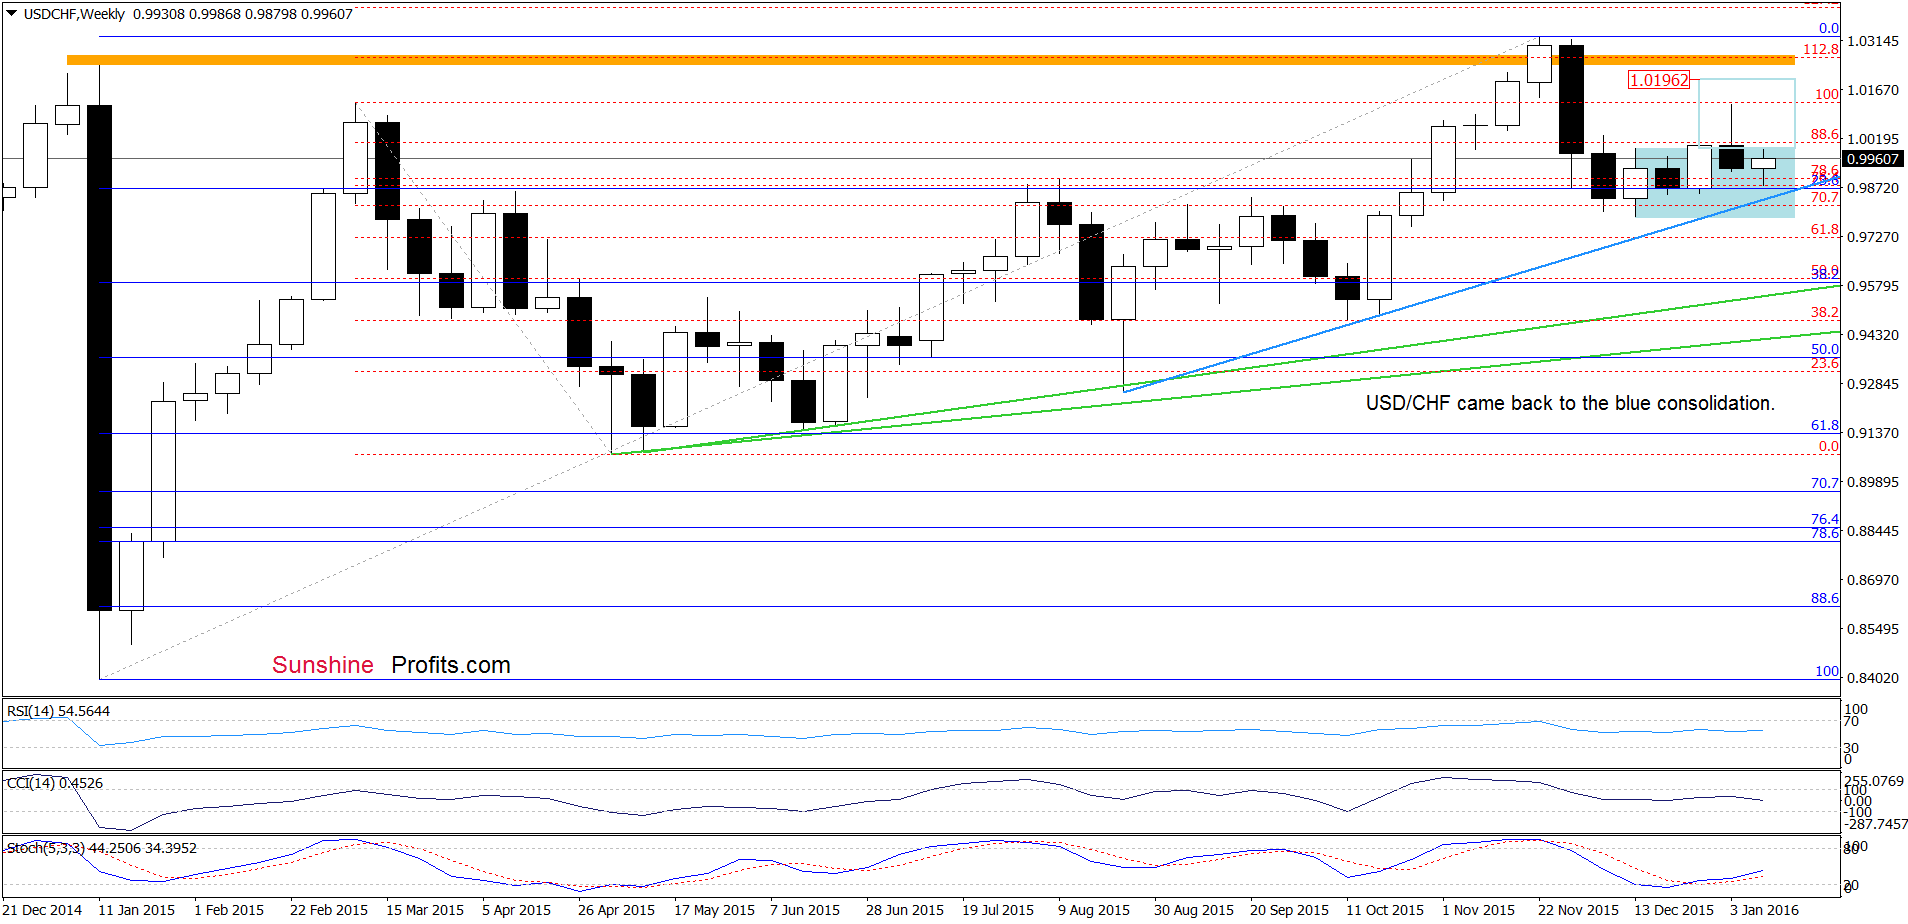
The situation in the medium term has deteriorated slightly as USD/CHF reversed and came back to the blue consolidation, invalidating earlier breakout above the upper line of the formation.
What impact did this move have on the daily chart? Lets check.
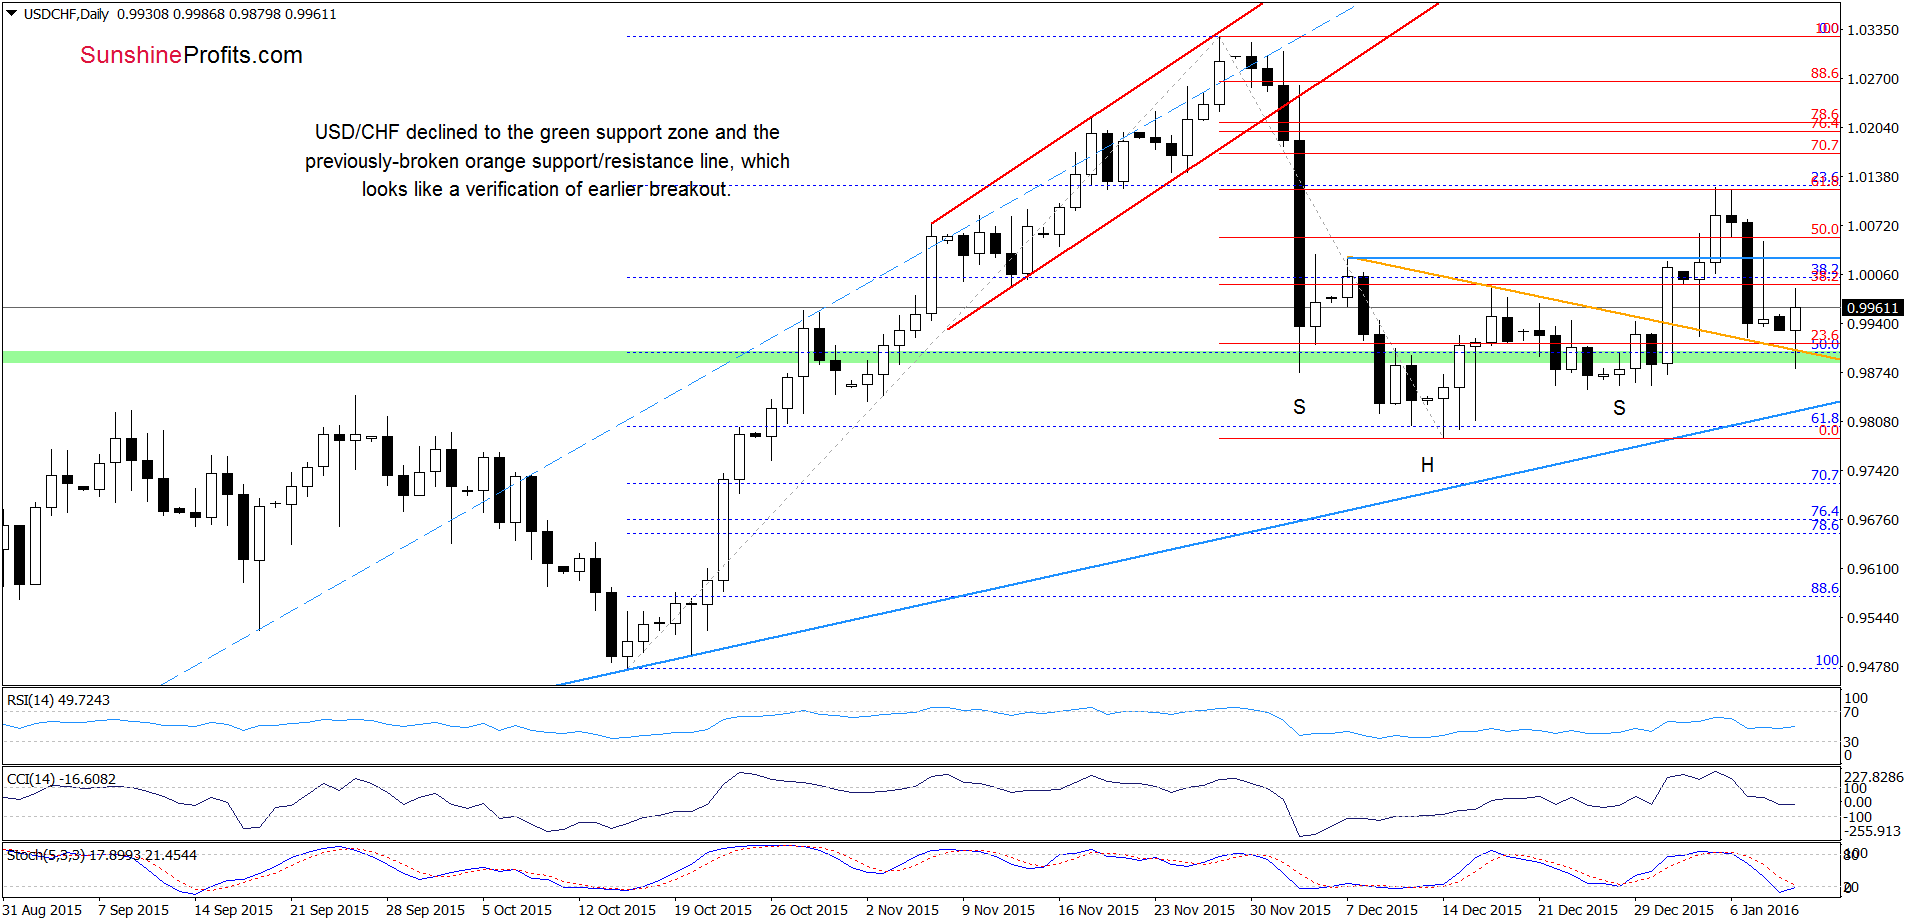
In our last commentary on this currency pair, we wrote:
(…) the 61.8% Fibonacci retracement (based on the Nov-Dec declines) stopped further improvement, triggering a pullback. With this downswing, the pair invalidated earlier breakout, which suggests a test of the orange support line and the green support zone in the coming days.
As you see on the chart, the situation developed in tune with the above scenario and USD/CHF reached our downside target earlier today. In our opinion, such price action looks like a verification of earlier breakout above the range line. If this is the case, we’ll see further improvement and an increase to recent highs in the coming day(s).
Very short-term outlook: mixed with bullish bias
Short-term outlook: mixed
MT outlook: mixed
LT outlook: mixed
Trading position (short-term; our opinion): No positions are justified from the risk/reward perspective. We will keep you informed should anything change, or should we see a confirmation/invalidation of the above.
AUD/USD
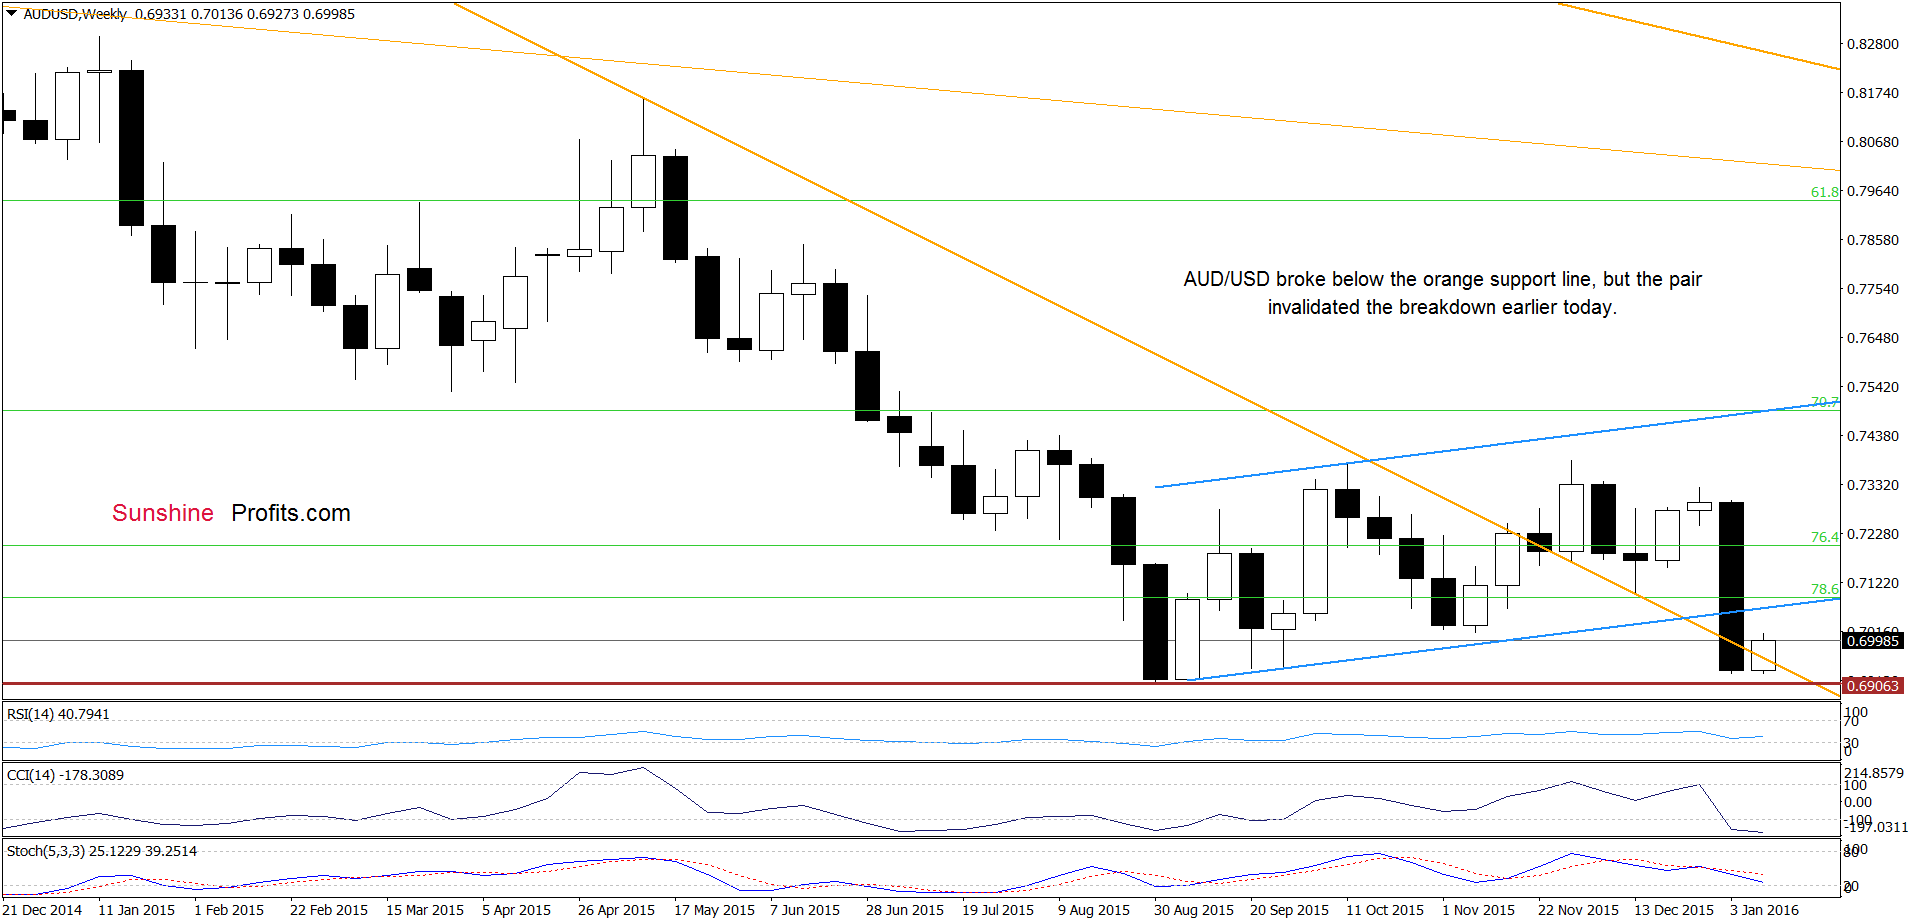
In our Forex Trading Alert posted on Jan 7, w wrote the following:
(…) currency bears (…) managed to push AUD/USD under the Nov lows. This is a bearish signal, which suggests a drop to the 88.6% Fibonacci retracement or even a test of the purple horizontal support line based on the mid-Sep low.
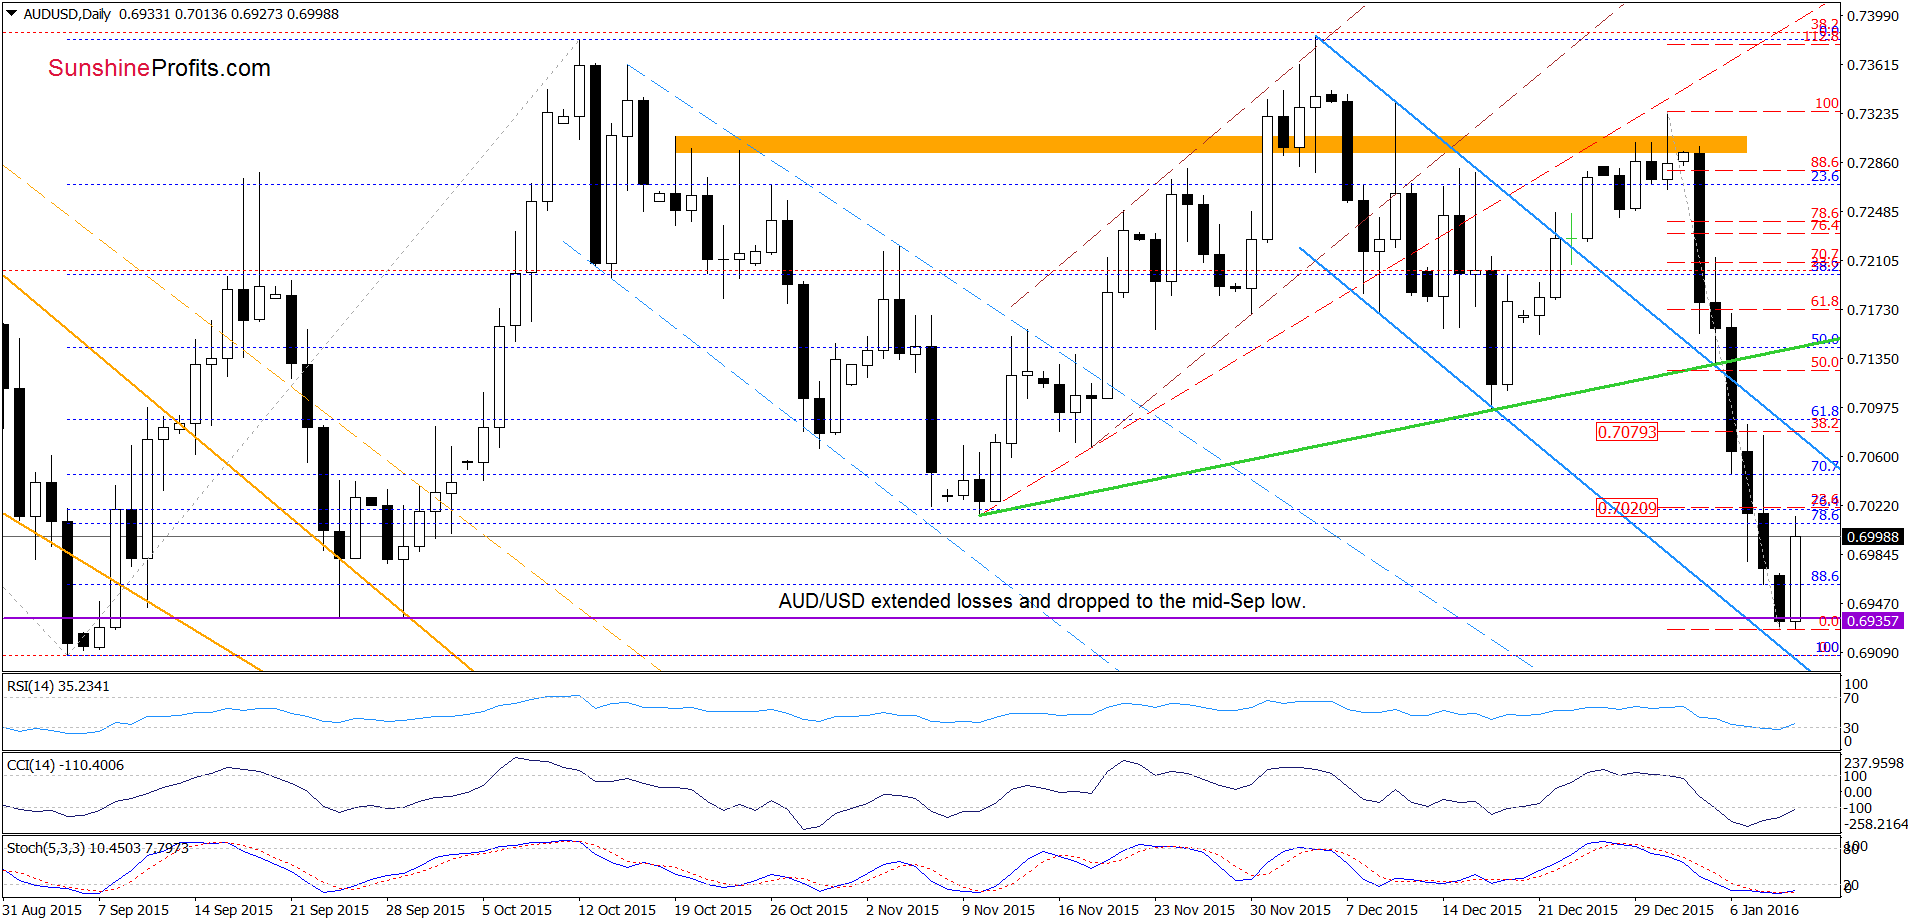
On the daily chart, we see that AUD/USD extended losses as we had expected. With the recent downward move, the pair dropped not only to our downside target, but also broke slightly below the orange support line (marked on the weekly chart). Despite this deterioration, currency bulls didn’t give up and pushed the pair higher earlier today. As a result, AUD/USD invalidated the breakdown under the orange line and bounced off session’s low. Taking these facts into account, and combining them with the current position of the daily indicators, it seems that further improvement is just around the corner. If this is the case, and the exchange rate increases from here, the initial upside target would be around 0.7079, where the 38.2% Fibonacci retracement (based on the recent downward move) is.
Very short-term outlook: mixed with bullish bias
Short-term outlook: mixed with bullish bias
MT outlook: mixed
LT outlook: mixed
Trading position (short-term; our opinion): No positions are justified from the risk/reward perspective. We will keep you informed should anything change, or should we see a confirmation/invalidation of the above.
Thank you.
Nadia Simmons
Forex & Oil Trading Strategist
Przemyslaw Radomski, CFA
Founder, Editor-in-chief
Gold & Silver Trading Alerts
Forex Trading Alerts
Oil Investment Updates
Oil Trading Alerts

