

Earlier today, the U.S. dollar extended gains against its Canadian counterpart, which resulted in a fresh multi-year high. How high could the pair go in the coming days?
In our opinion the following forex trading positions are justified - summary:
- EUR/USD: short (stop-loss order at 1.1363; initial downside target at 1.0462)
- GBP/USD: none
- USD/JPY: none
- USD/CAD: none
- USD/CHF: none
- AUD/USD: none
EUR/USD
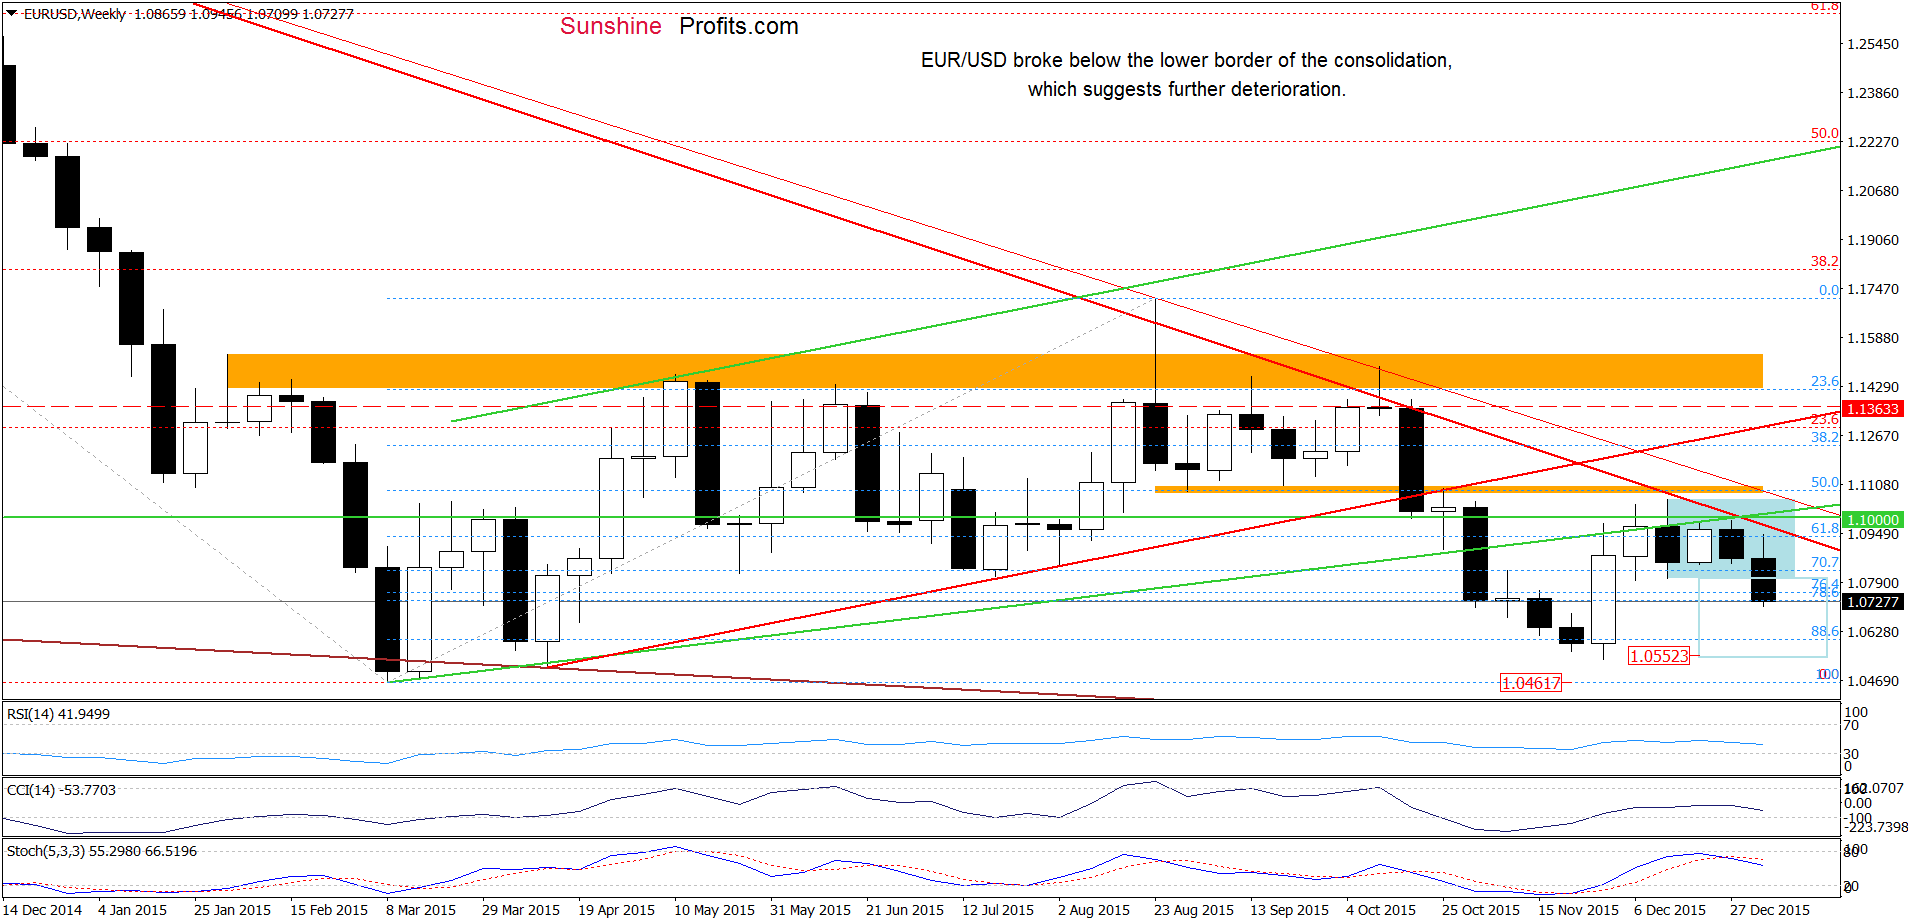
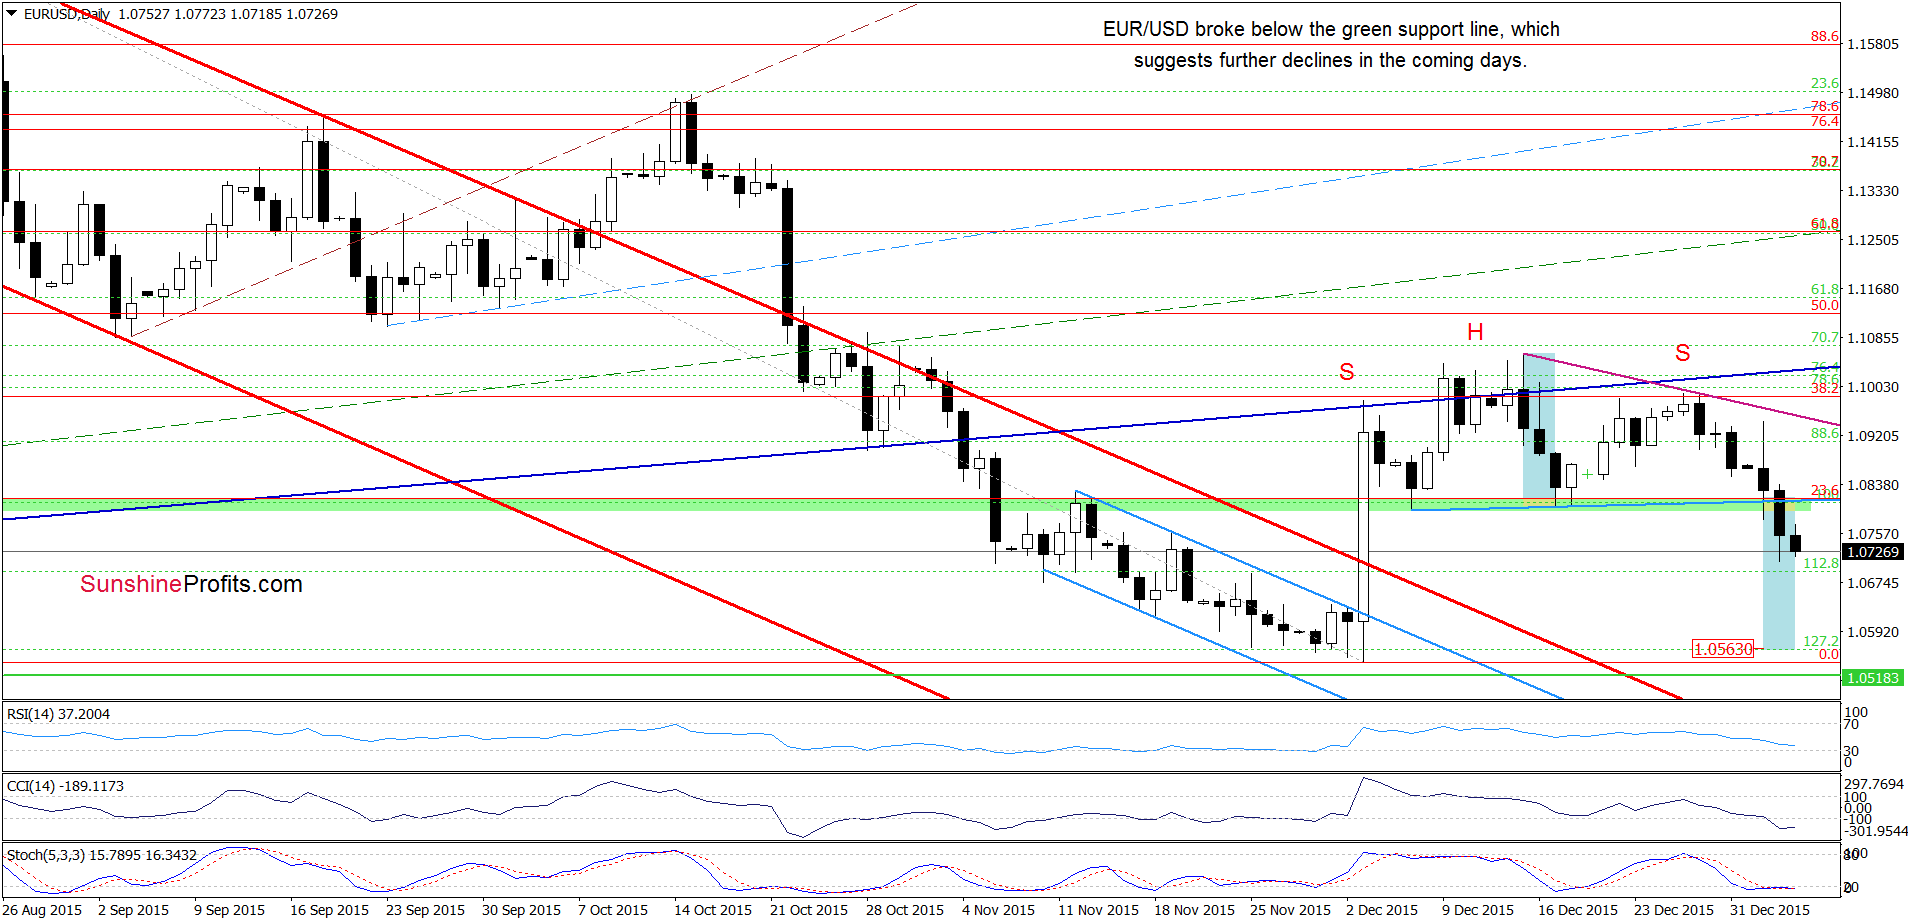
Looking at the charts, we see that EUR/USD extended losses, which means that what we wrote yesterday is up-to-date:
(…) EUR/USD broke below the lower border of the consolidation. With this move, the pair also declined under the green support zone (marked on the daily char), which means that the head and shoulders pattern is underway and a drop to around 1.0563 is more likely than not (in this area the size of the move will correspond to the height of the bearish pattern).
Very short-term outlook: bearish
Short-term outlook: bearish
MT outlook: bearish
LT outlook: mixed
Trading position (short-term; our opinion): Short positions (with a stop-loss order at 1.1363 and the initial downside target at 1.0462) are justified from the risk/reward perspective. We will keep you informed should anything change, or should we see a confirmation/invalidation of the above.
GBP/USD
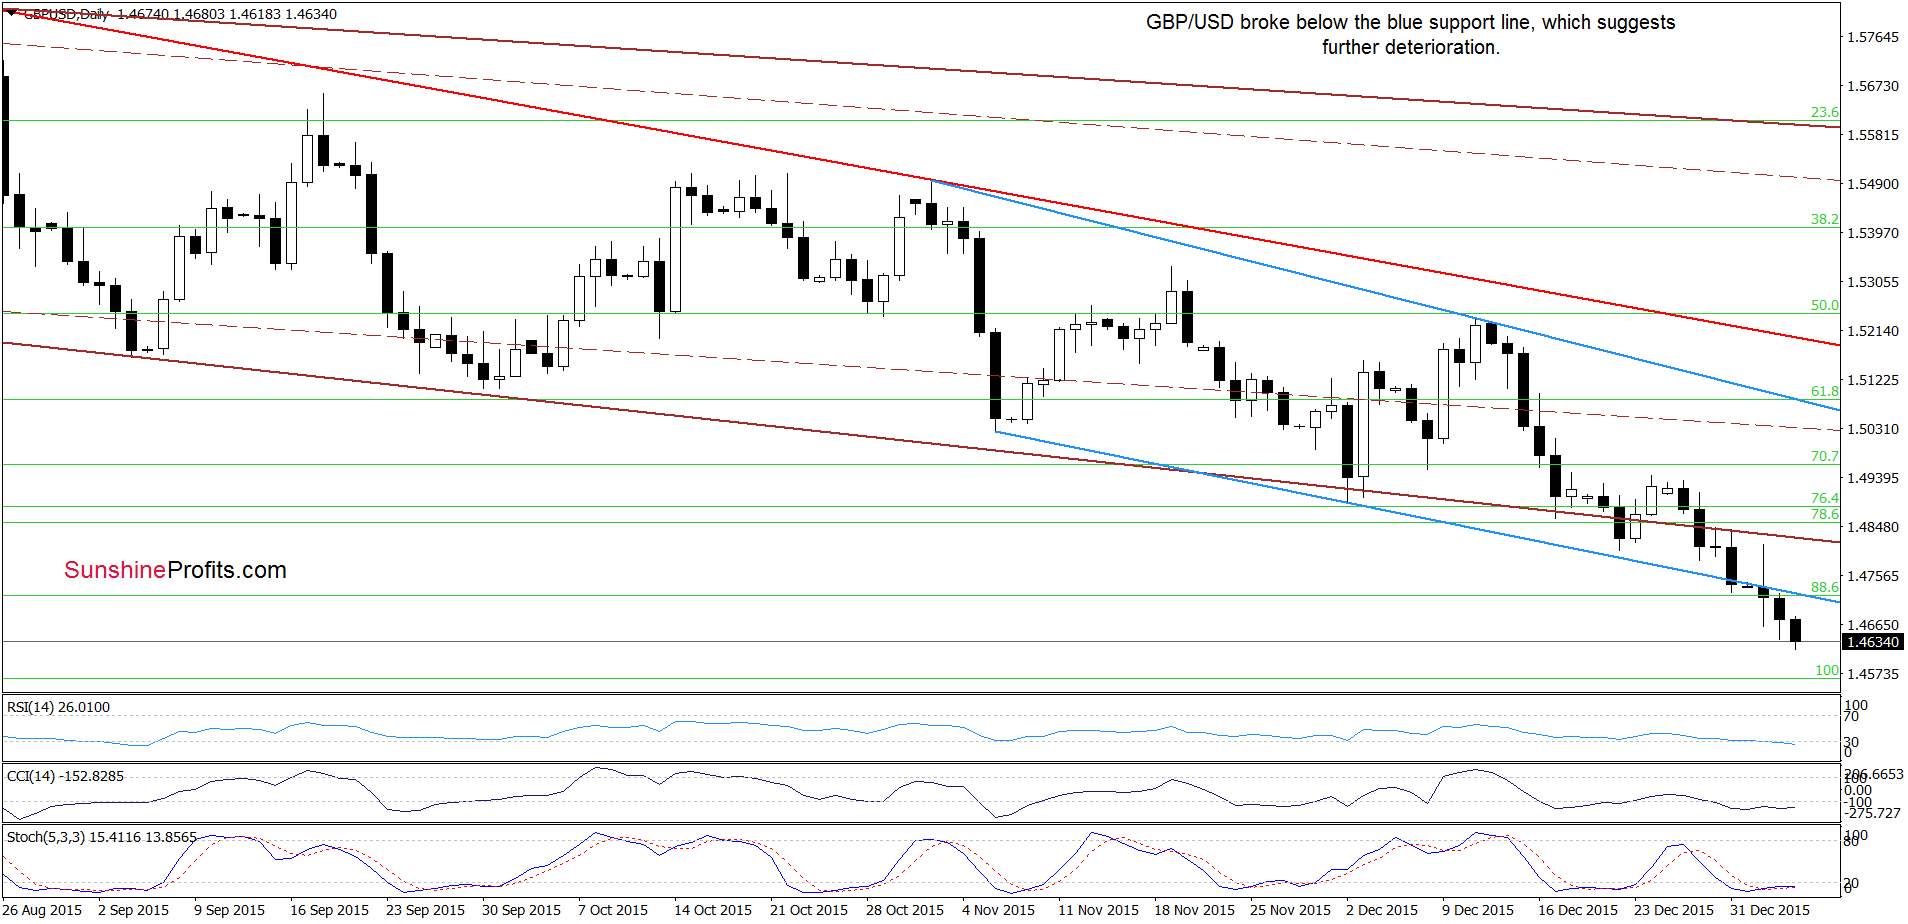
On the daily chart, we see that GBP/USD broke below the blue support line, which is a bearish signal that suggests further deterioration.
What impact did this drop have on the medium-term picture? Let’s check.
On Monday, we wrote:
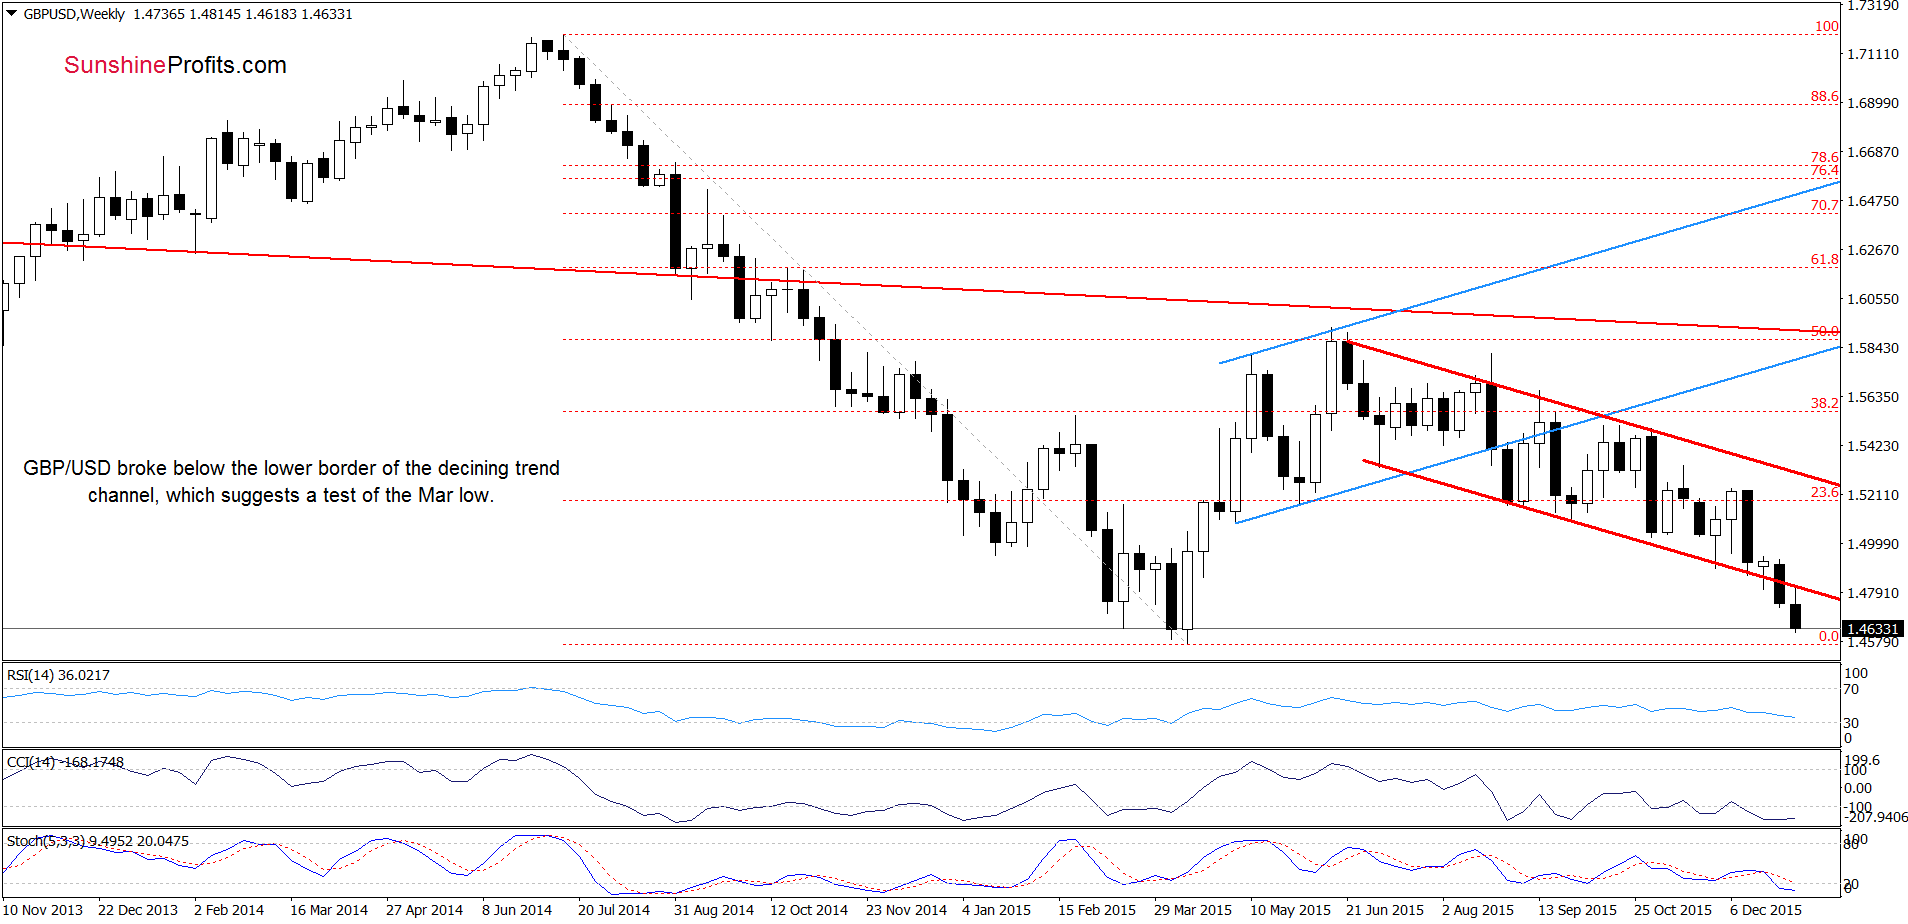
(…) the last week’s downward move pushed GBP/USD under the lower border of the red declining trend channel, which is a bearish signal. Despite today’s increase (which looks like a verification of the breakdown), the pair remains below this important line, which means that as long as there is no invalidation of the breakdown further deterioration is very likely.
As you see on the chart, currency bears pushed the pair lower as we had expected. With this move, GBP/USD rate verified earlier breakdown under the lower border of the red declining trend channel, which means that our Monday’s downside target will be in play in the coming days:
If (…) the exchange rate moves lower from here, we could see a decline even to the Apr low in the coming weeks.
Very short-term outlook: bearish
Short-term outlook: mixed with bearish bias
MT outlook: mixed
LT outlook: mixed
Trading position (short-term; our opinion): No positions are justified from the risk/reward perspective at the moment. We will keep you informed should anything change, or should we see a confirmation/invalidation of the above.
USD/CAD
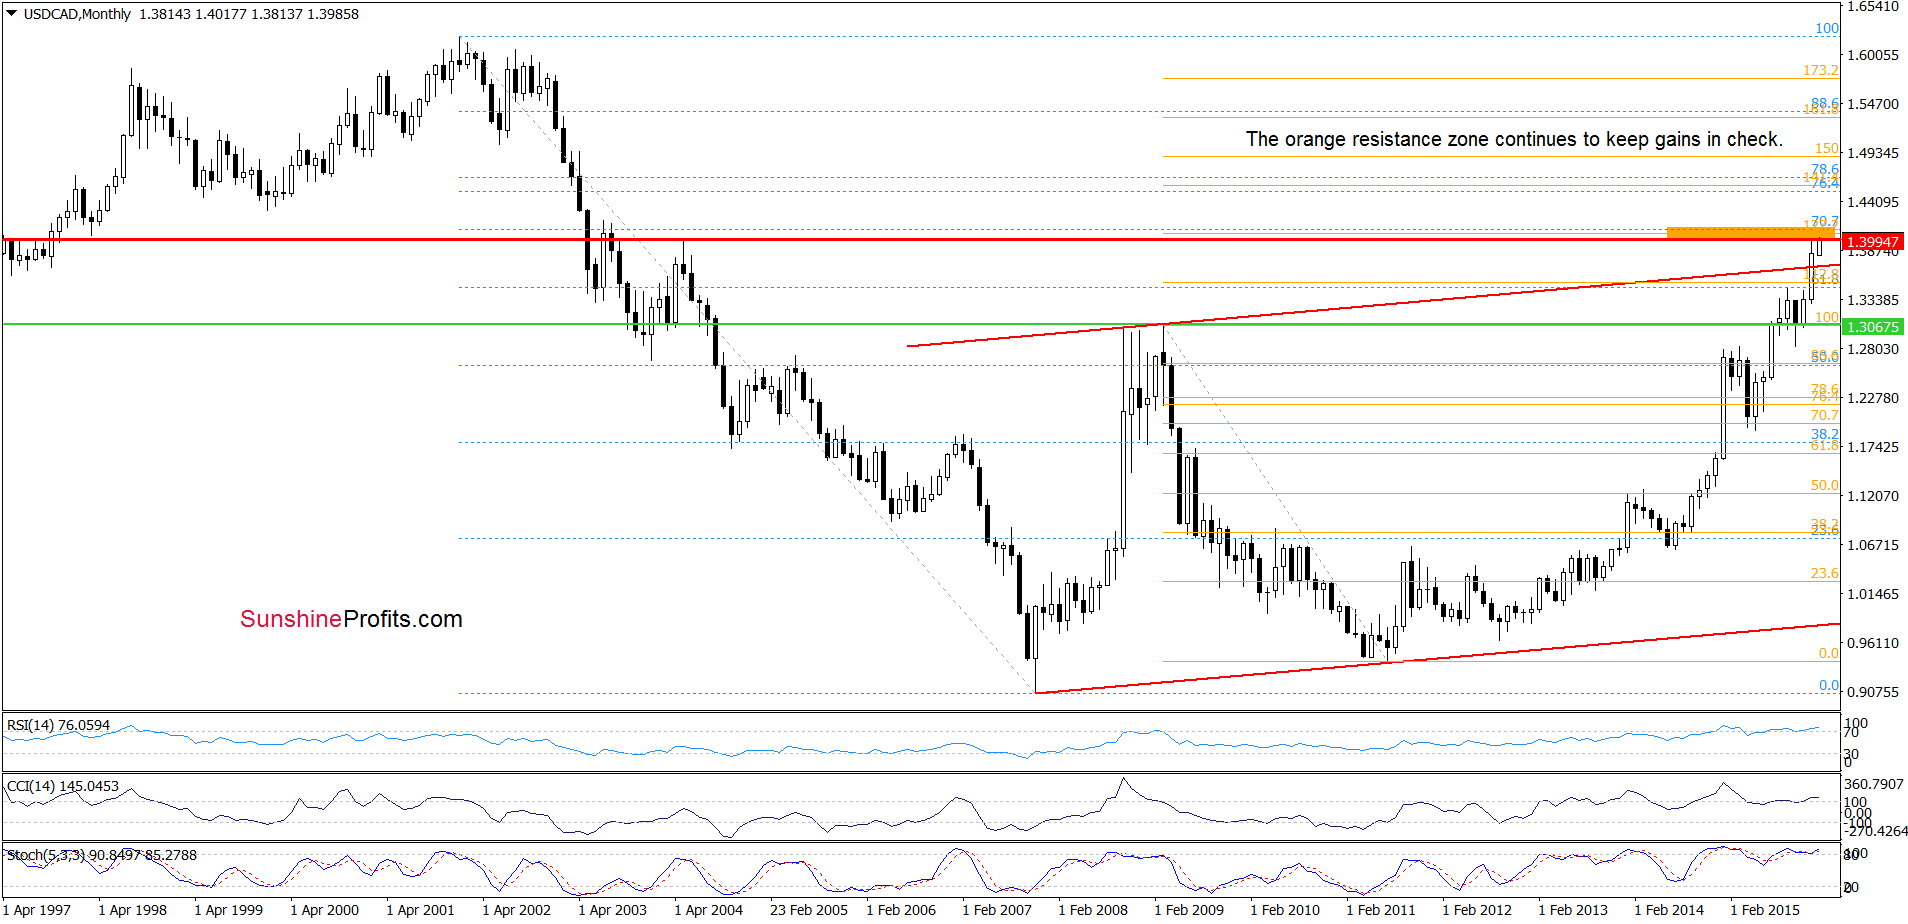
On the long-term chart, we see that the situation hasn’t changed much since our last commentary was posted as the orange resistance zone continues to keep gains in check.
What can we infer from the very short-term picture? Let’s check.
Quoting our last commentary on this currency pair:
(…) USD/CAD is consolidating under the previously-broken upper border of the blue trend channel, which means that as long as there won’t be a breakout/breakdown another sizable move is not likely to be seen. Nevertheless, the current position of the CCI and Stochastic Oscillator suggests that currency bulls will try to push the pair higher. If we see such price action, the initial upside target would be the Dec high of 1.3998.
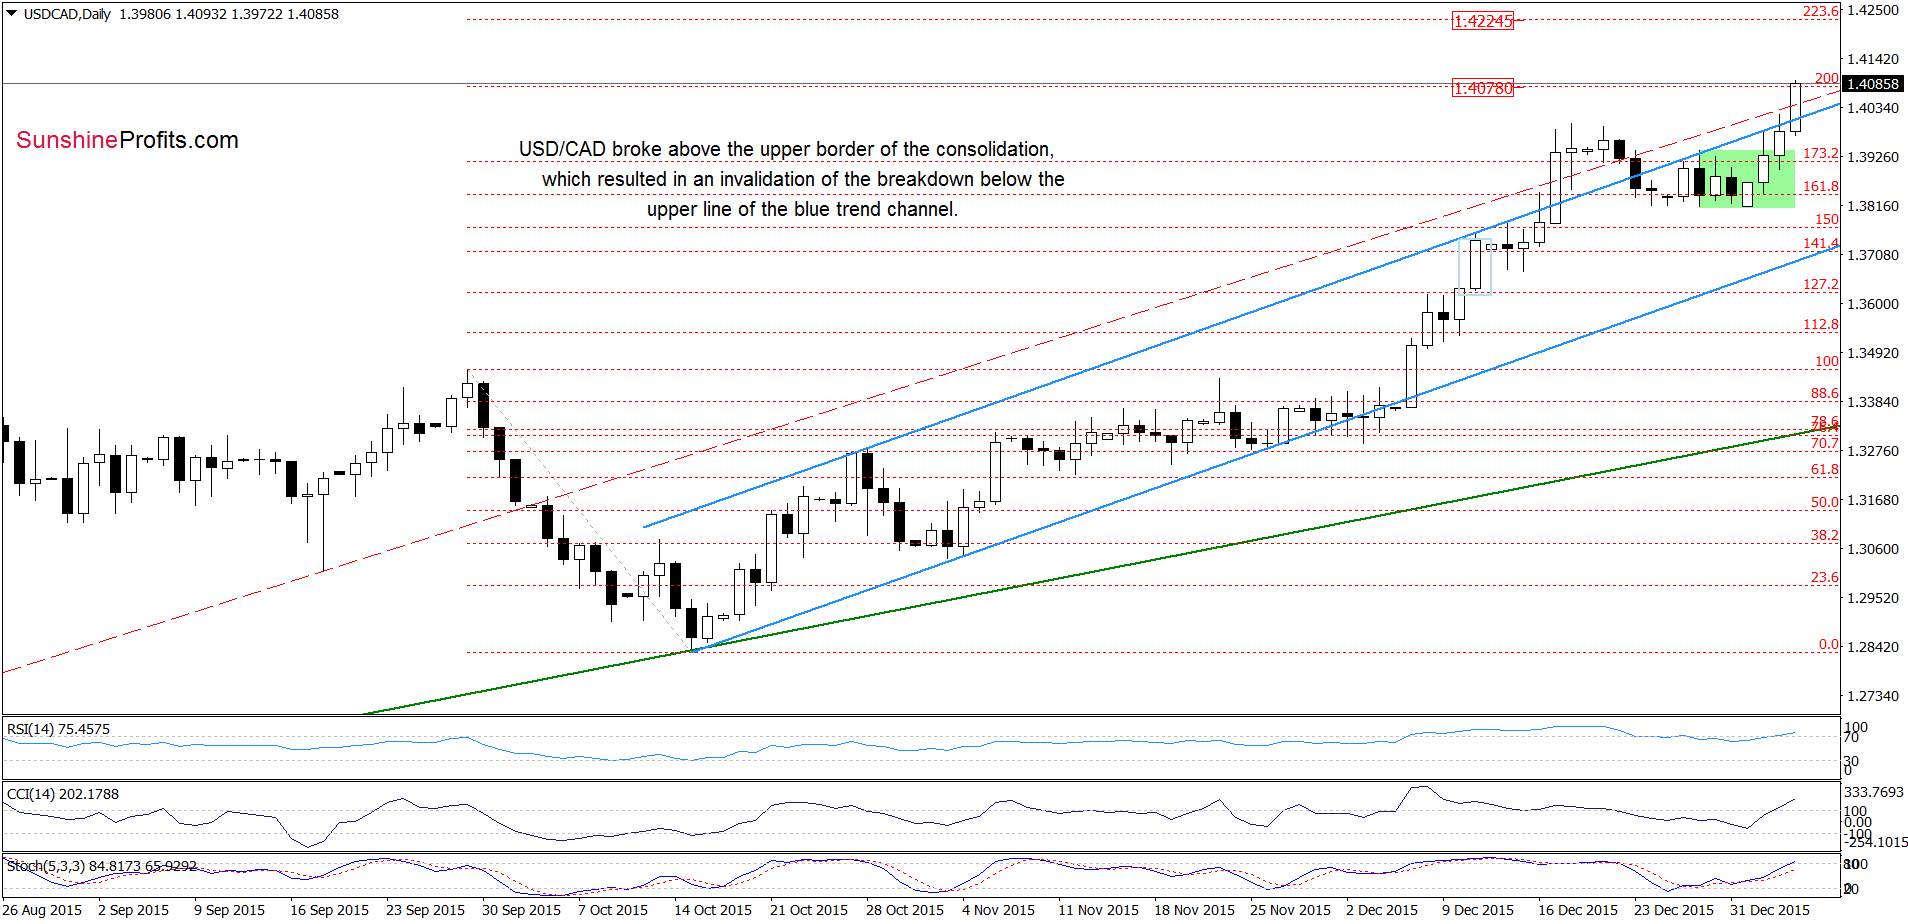
On the daily chart, we see that the situation developed in line with the above scenario and currency bulls not only took the pair to the Dec high, but also managed to push USD/CAD above it. This positive signal, in combination with a breakout above the upper border of the consolidation and buy signal generated by the Stochastic Oscillator triggered further improvement. As a result, USD/CAD came back above the upper line of the blue trend channel, invalidating earlier breakdown, which resulted in an increase to the 200% Fibonacci extension. Taking this fact into account, and combining it with the current position of the indictors, we think that another upswing is just around the corner (in this case the next target for currency bulls would be around 1.4224, where the next Fibonacci extension is). Nevertheless, such price action will be more reliable if the exchange rate breaks above the orange resistance zone marked on the log-term chart.
Very short-term outlook: mixed with bullish bias
Short-term outlook: mixed
MT outlook: mixed
LT outlook: mixed
Trading position (short-term; our opinion): No positions are justified from the risk/reward perspective at the moment. We will keep you informed should anything change, or should we see a confirmation/invalidation of the above.
Thank you.
Nadia Simmons
Forex & Oil Trading Strategist
Przemyslaw Radomski, CFA
Founder, Editor-in-chief
Gold & Silver Trading Alerts
Forex Trading Alerts
Oil Investment Updates
Oil Trading Alerts

