

Yesterday, the U.S. National Association of Realtors showed that existing home sales dropped 10.5% to a 19-month low of 4.76 million units in Nov, which pushed the USD Index lower. As a result, AUD/USD broke above an important resistance line. Will we see further improvement in the coming days?
In our opinion the following forex trading positions are justified - summary:
- EUR/USD: short (stop-loss order at 1.1363; initial downside target at 1.0462)
- GBP/USD: none
- USD/JPY: none
- USD/CAD: none
- USD/CHF: none
- AUD/USD: none
EUR/USD
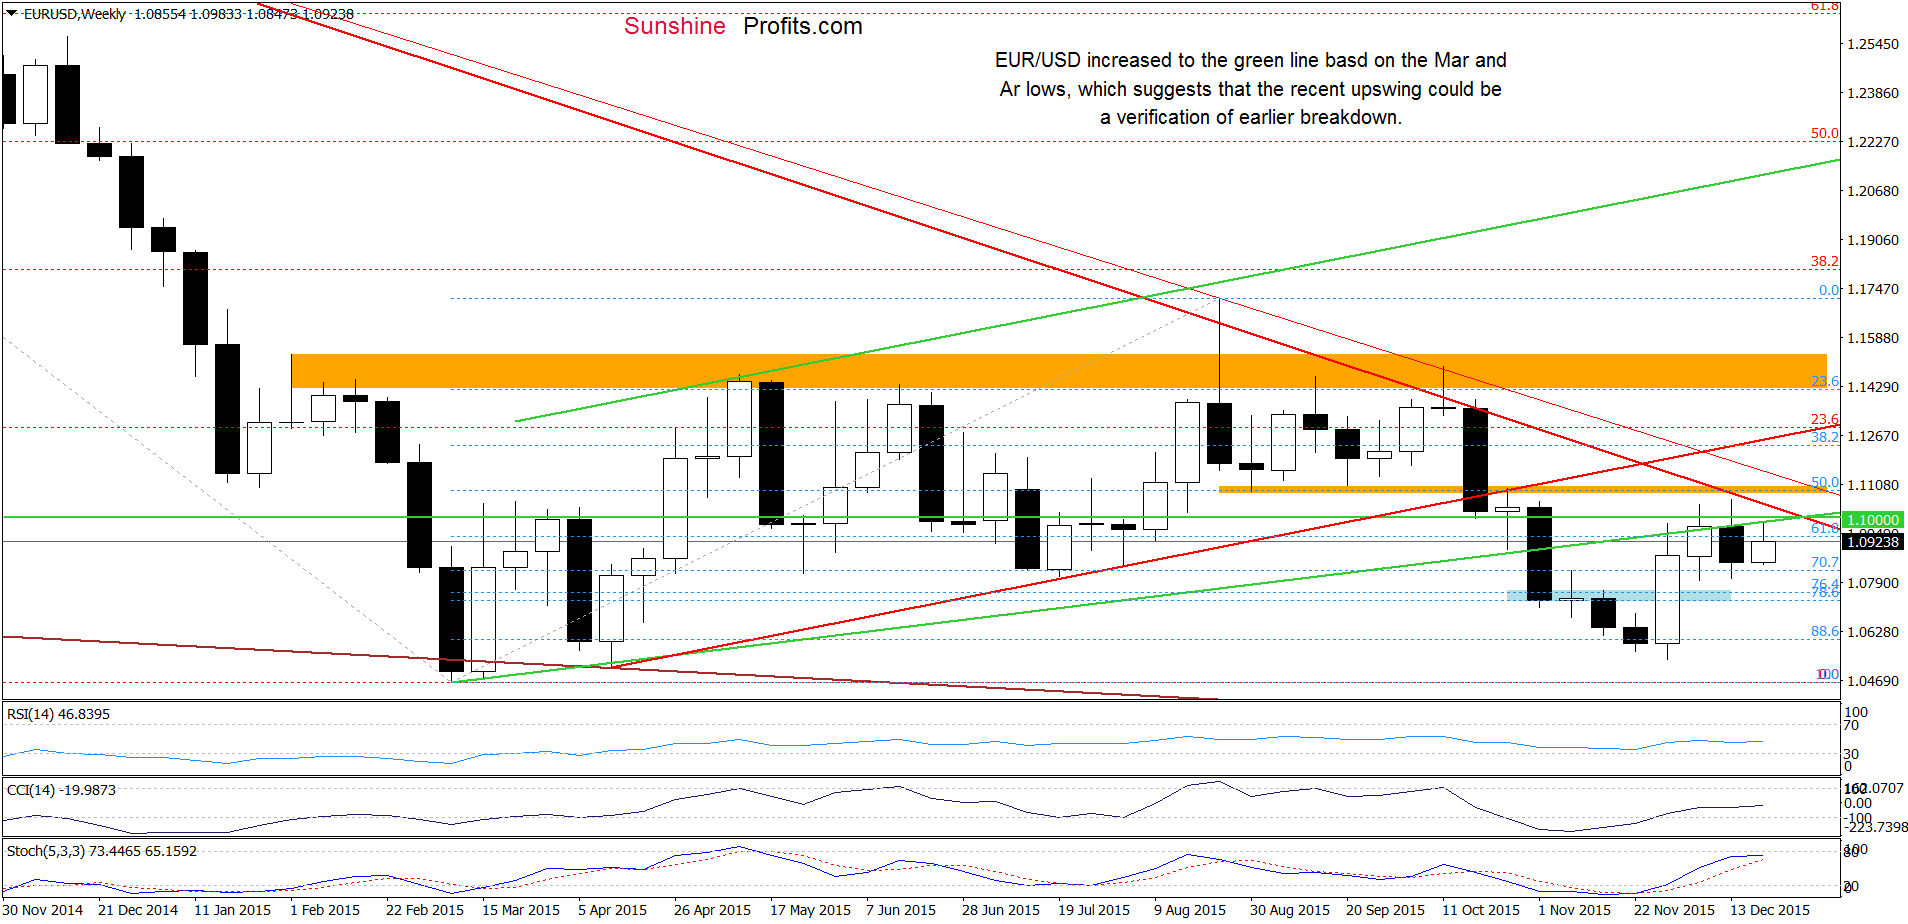
Looking at the weekly chart, we see that EUR/USD increased and cimbed to the previously-broken green resistance line, which suggests that the recent upswing could be a verification of earlier breakdown. If this is the case, will likely see a reversal and a decline from here in near future (please keep in mind that the proximity to the long-term red declining resistance line is another factor that could encourage currency bears to act).
Will the daily chart confirm this bearish scenario? Let’s check.
On Monday, we wrote the following:
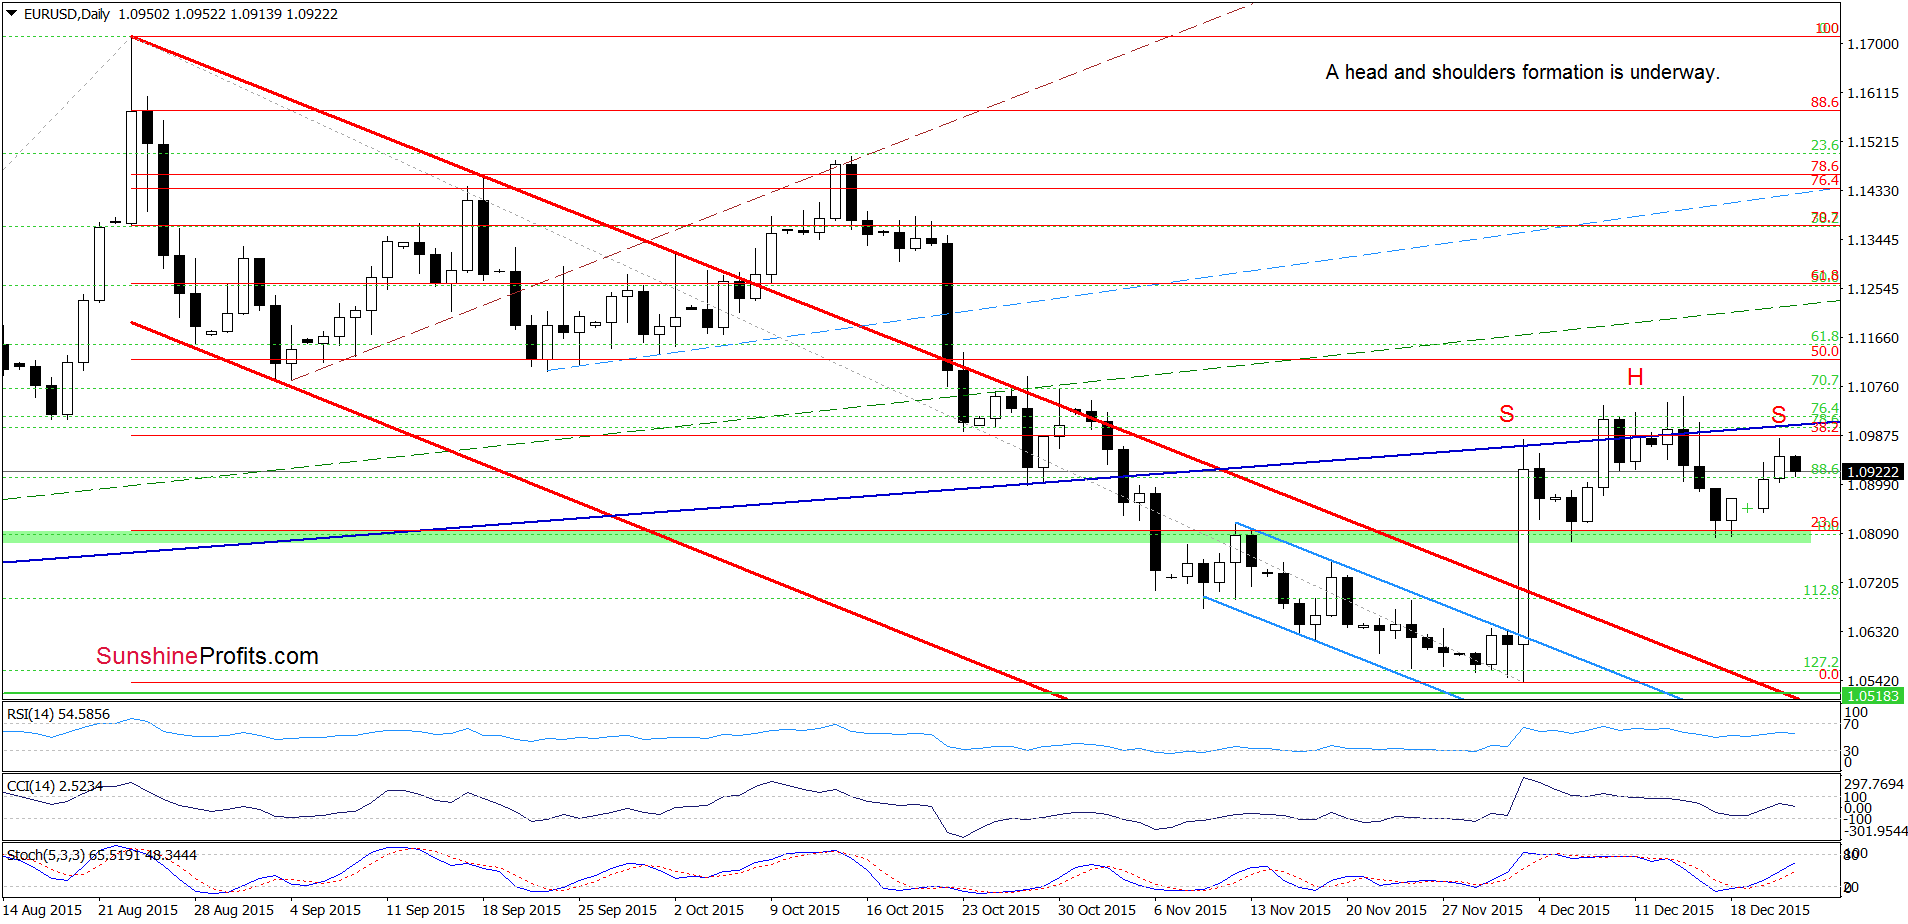
(…) Taking into account the fact that the green area continues to keep gains in check and combining it with the current position of the indicators (the CCI and Stochastic Oscillator are very close to generating buy signals), we think that further improvement is just around the corner. If we see such price action, the initial upside target would be around 1.1000, where the 38.2% Fibonacci retracement and the navy blue resistance line are. Please note that in this case, we may see a head and shoulders formation in the coming days (an upward move from current levels would be a potential right shoulder of the pattern).
As you see on the daily chart, the situation developed in line with the above scenario and EUR/USD approached our upside target yesterday. Earlier today, the combination of the 38.2% Fibonacci retracement and the navy blue resistance line triggered a pullback, which suggests that lower values of the exchange rate are ahead us. In this case, the initial downside target would be the green support zone. Nevertheless, taking into account the medium-term picture, we think that further declines and (at least) a test of the Dec low are more likely than not.
Very short-term outlook: bearish
Short-term outlook: bearish
MT outlook: bearish
LT outlook: mixed
Trading position (short-term; our opinion): Short positions (with a stop-loss order at 1.1363 and the initial downside target at 1.0462) are justified from the risk/reward perspective. We will keep you informed should anything change, or should we see a confirmation/invalidation of the above.
USD/CAD
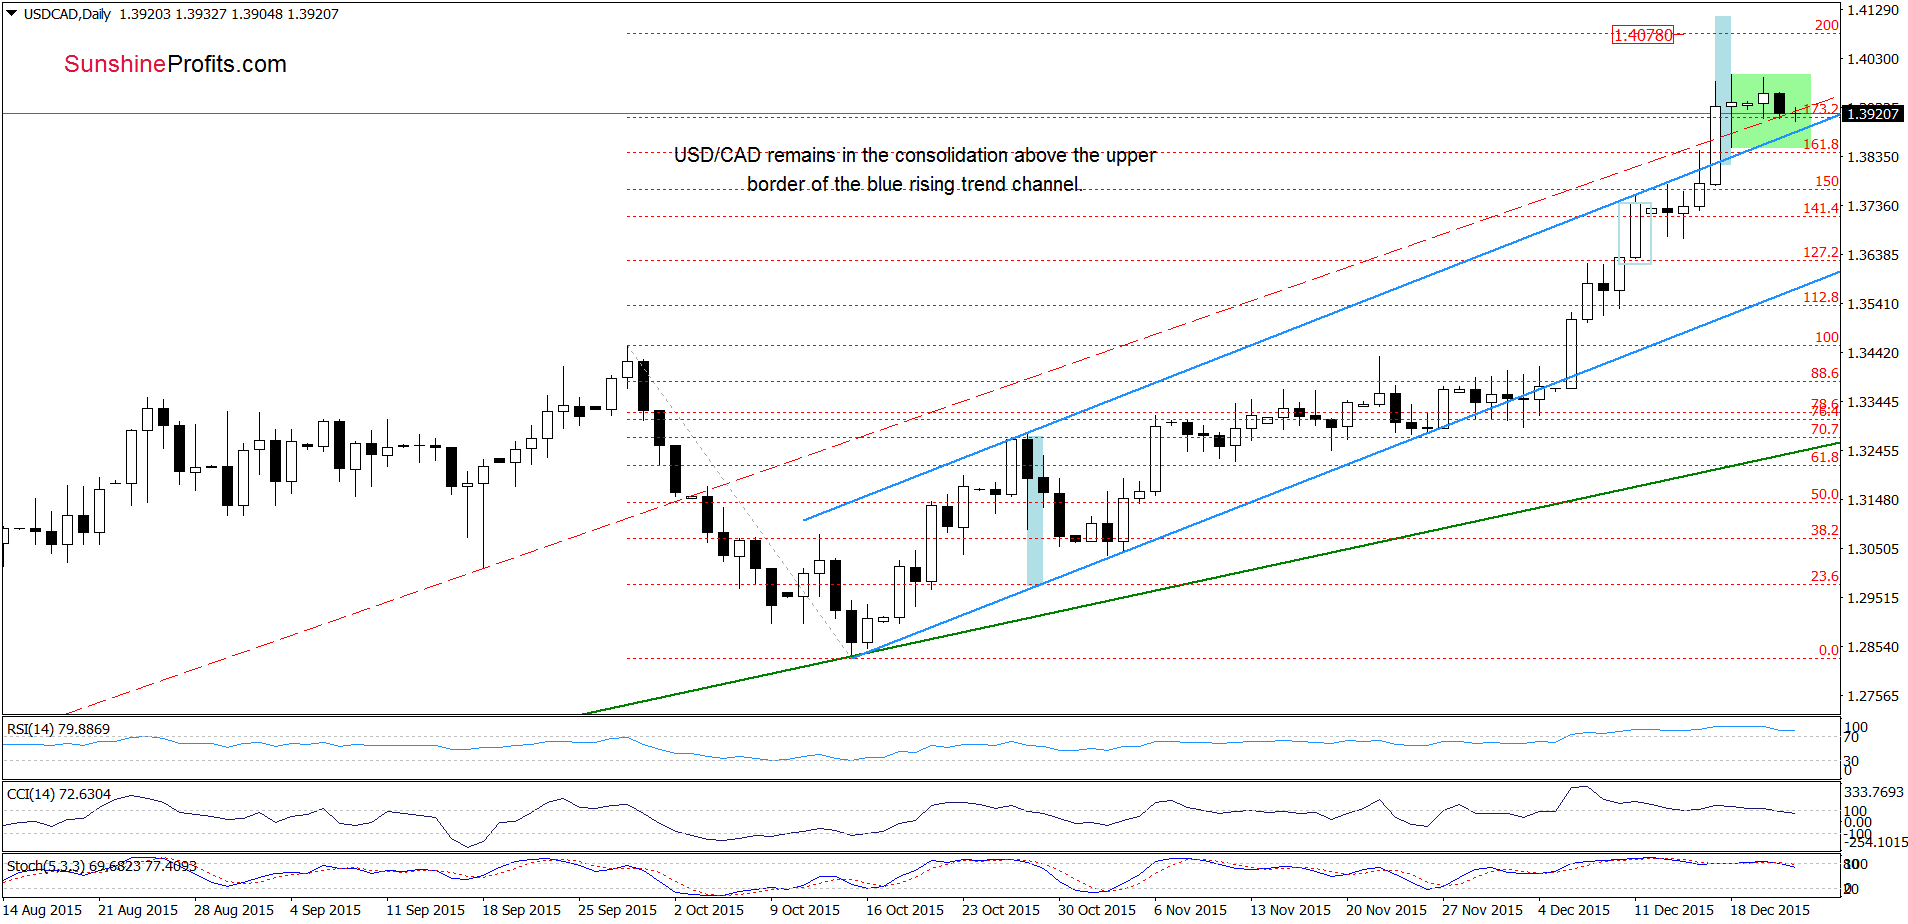
From today’s point of view, we see that USD/CAD is still consolidating slightly above the previously-broken upper border of the blue trend channel, which means that our Friday’s commentary on this currency pair is still valid:
This is a bullish signal, which suggests an increase to around 1.4078 (the 200% Fibonacci extension). At this point, it is worth noting that around 1.4103 the size of the upward move will correspond to the height of the trend channel.
But will we see further improvement? Let’s examine the long-term chart and look for more clues about future moves.
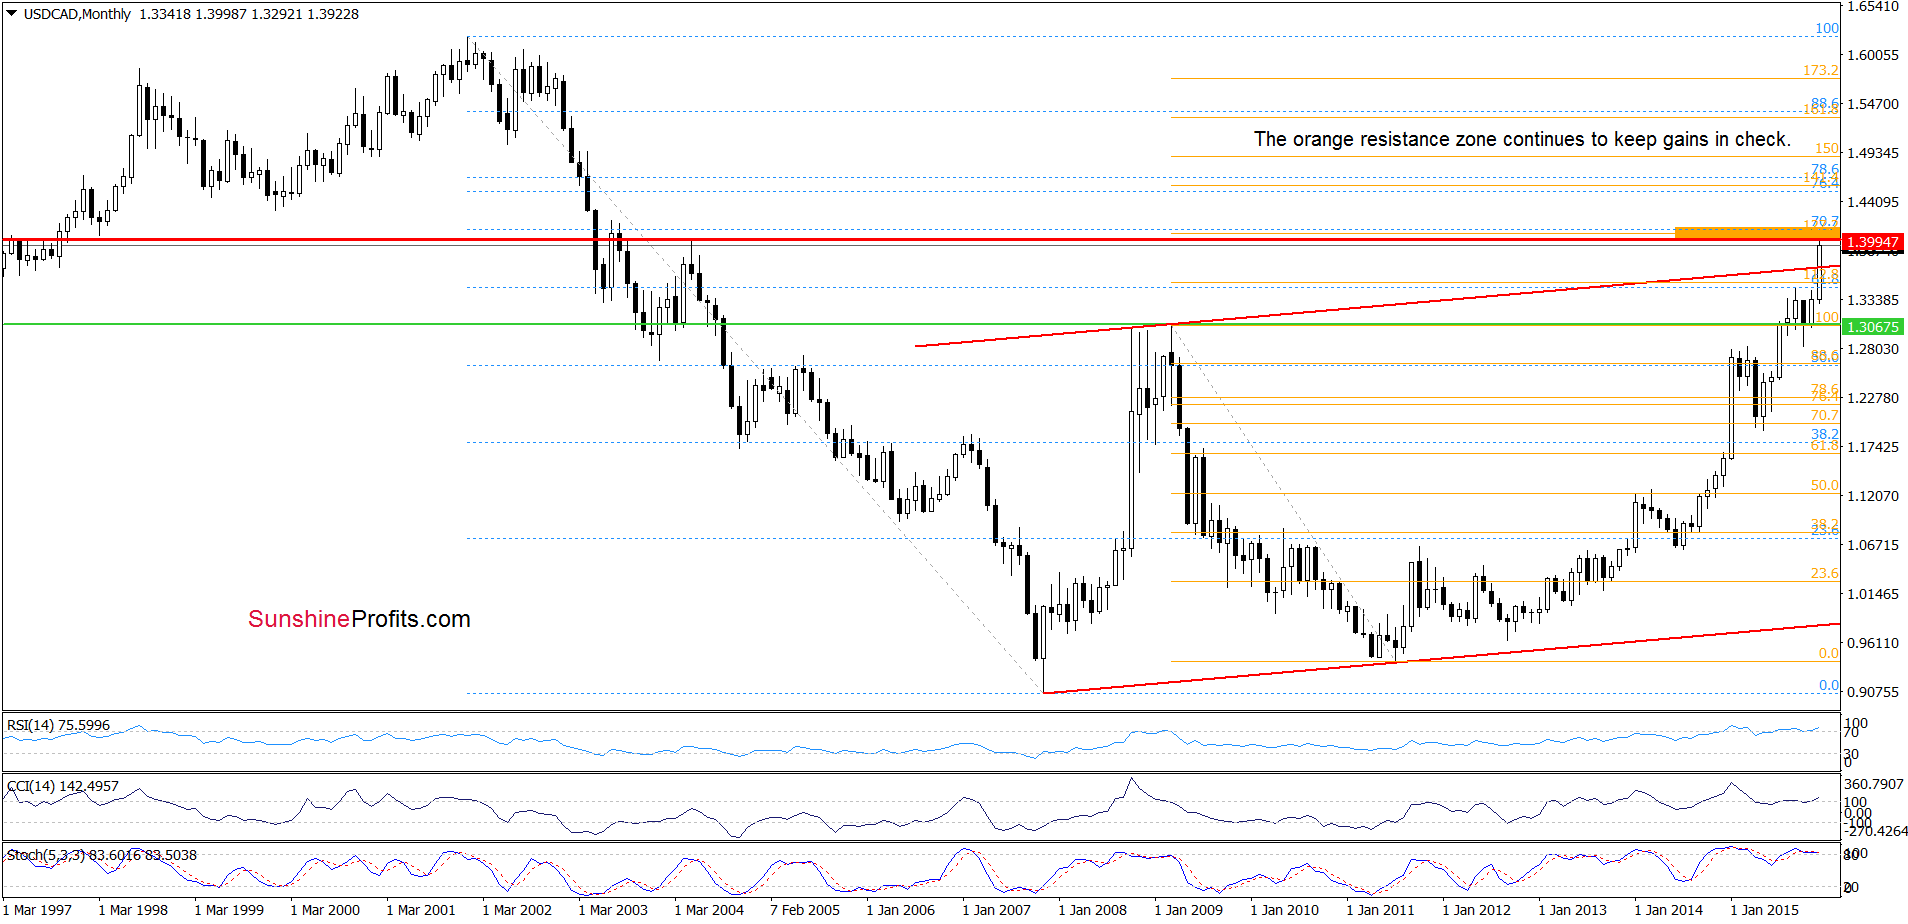
(…) the exchange rate approached the red line and the orange resistance zone created by the 27.2% Fibonacci extension and the 70.7% Fibonacci retracement based on the Jan 2002-Nov 2007 declines. Taking into account the current position of the daily and monthly indicators, we think that this solid resistance area will stop further rally and trigger a pullback in the coming week. Nevertheless, taking into account a breakout above the upper border of the red trend channel, we should also consider a pro growth scenario. If USD/CAD breaks above the orange zone, the next upside target for currency bulls would be around 1.4494-.4665, where the next resistance zone (created by the 76.4% and 78.6% Fibonacci retracements and the 141,4% Fibonacci extension) is.
Very short-term outlook: mixed
Short-term outlook: mixed
MT outlook: mixed
LT outlook: mixed
Trading position (short-term; our opinion): No positions are justified from the risk/reward perspective at the moment. We will keep you informed should anything change, or should we see a confirmation/invalidation of the above.
AUD/USD
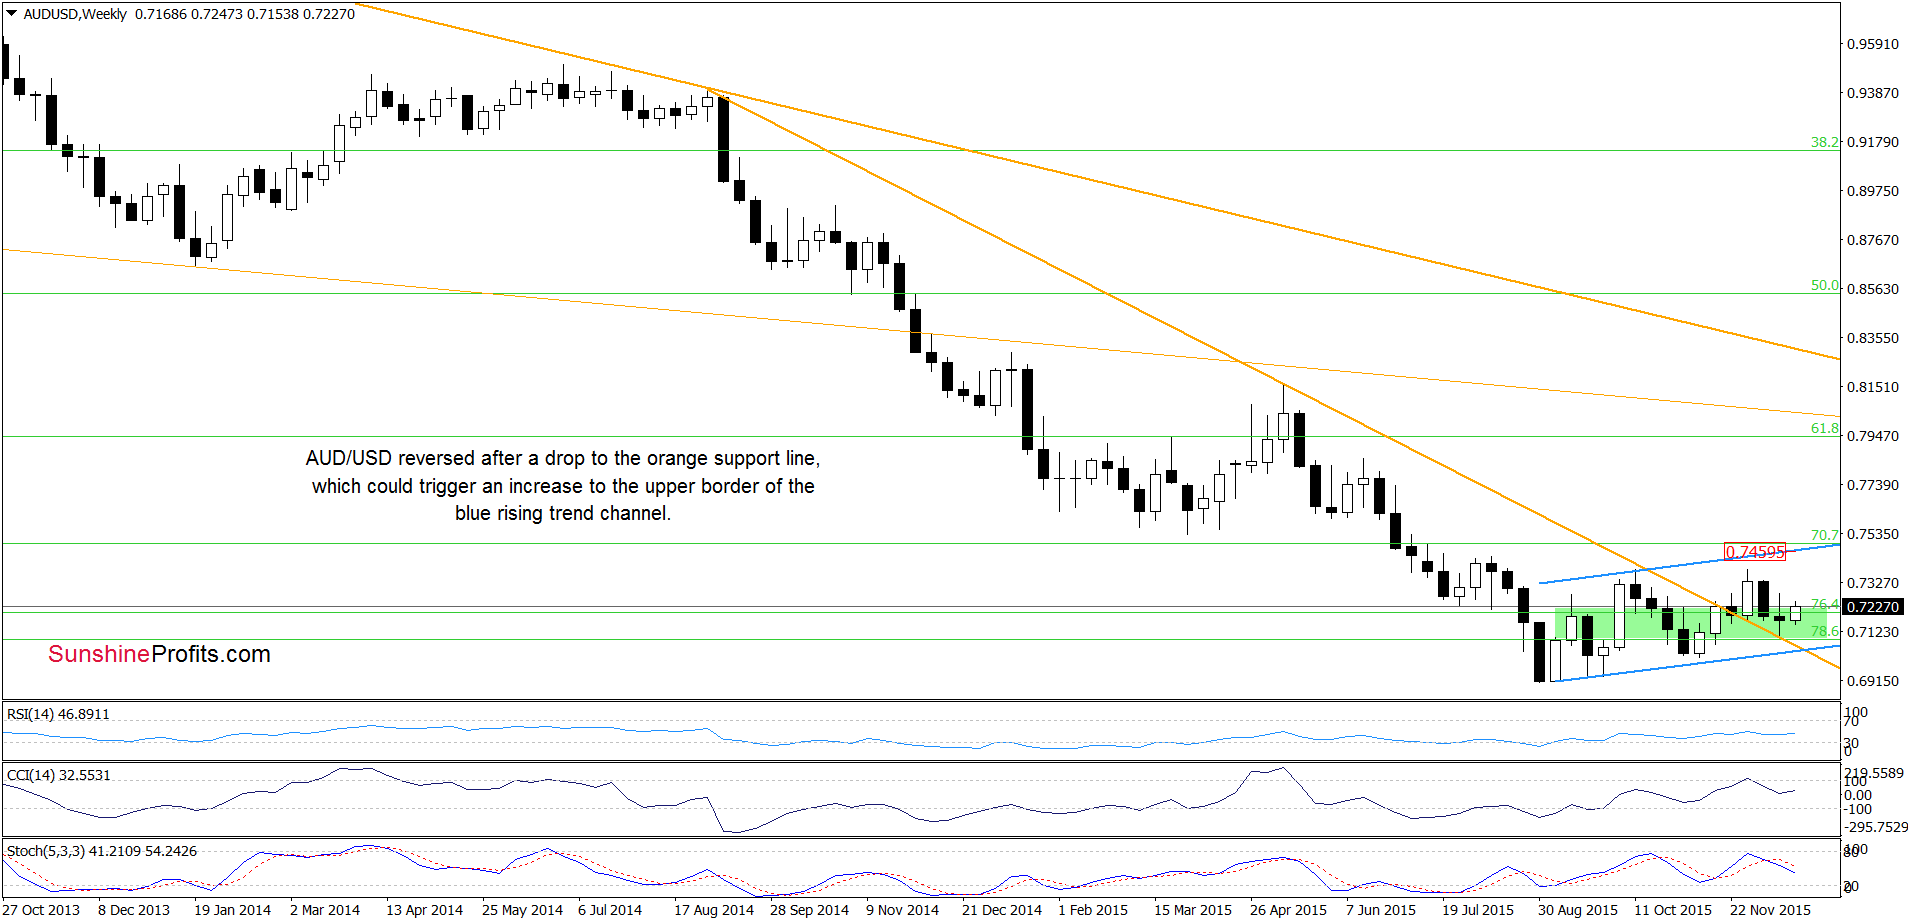
Looking at the weekly chart, we see that AUD/USD reversed and rebounded after a drop to the orange support line, which is a positive signal that suggests further improvement – even to the upper border of the blue rising trend channel.
But will we see such price action? Let’s take a closer look at the daily chart and look for more clues about future moves.
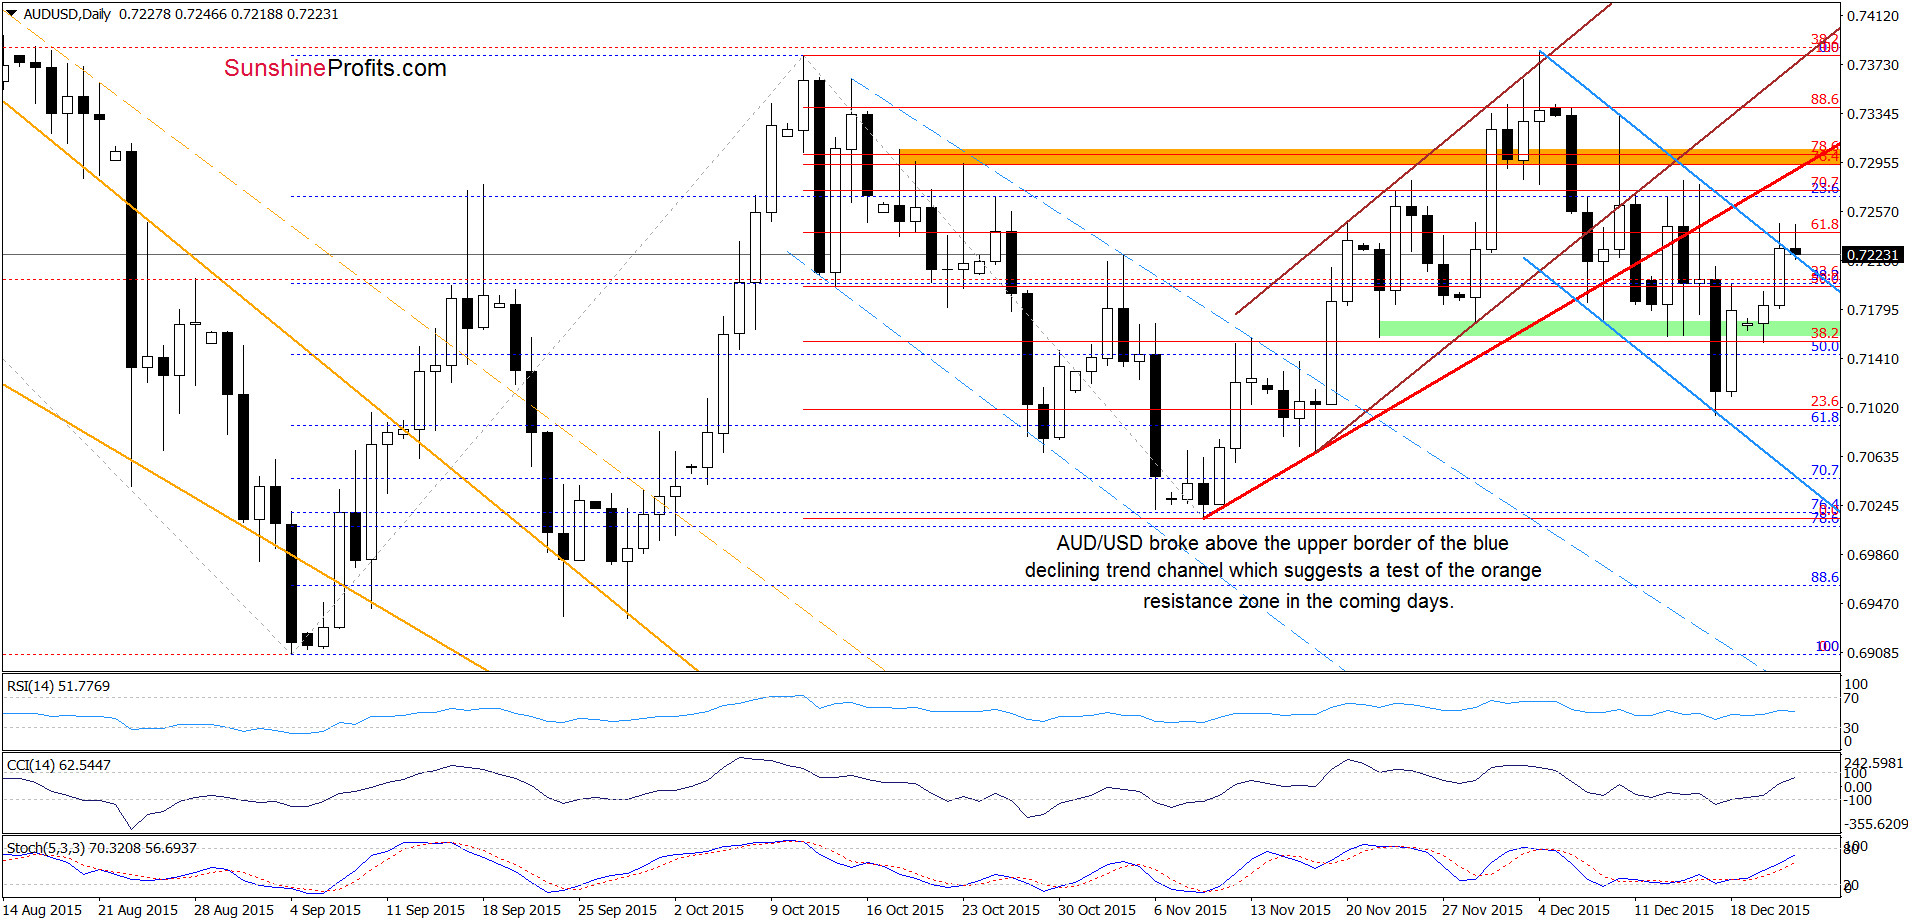
Quoting our Friday’s alert:
(…) if AUD/USD comes back above the green zone marked on the daily chart (…) the next upside target would be the upper line of the blue declining trend channel (currently around 0.7256).
On the daily chart, we see that the situation developed in line with the above scenario and AUD/USD broke above the upper line of the blue declining trend channel. This is a positive signal, which suggests a test of the orange resistance zone in the coming days (please note that buy signals generated by the indicators support currency bulls).
Very short-term outlook: mixed with bullish bias
Short-term outlook: mixed
MT outlook: mixed
LT outlook: mixed
Trading position (short-term; our opinion): No positions are justified from the risk/reward perspective at the moment. We will keep you informed should anything change, or should we see a confirmation/invalidation of the above.
Thank you.
Nadia Simmons
Forex & Oil Trading Strategist
Przemyslaw Radomski, CFA
Founder, Editor-in-chief
Gold & Silver Trading Alerts
Forex Trading Alerts
Oil Investment Updates
Oil Trading Alerts

