

Although the USD Index moved little lower earlier today, the greenback remains supported by the Wednesday’s FED decision to raise interest rates for the first time in nearly a decade. Additionally, yesterday’s data, which showed that the number of initial jobless claims in the week ending December 11 decreased by 11,000 to 271 added to optimism over the strength of the U.S. economy and pushed the index above the level of 99. How did recent moves in the USD Index affect the technical picture of our six currency pairs?
In our opinion the following forex trading positions are justified - summary:
EUR/USD
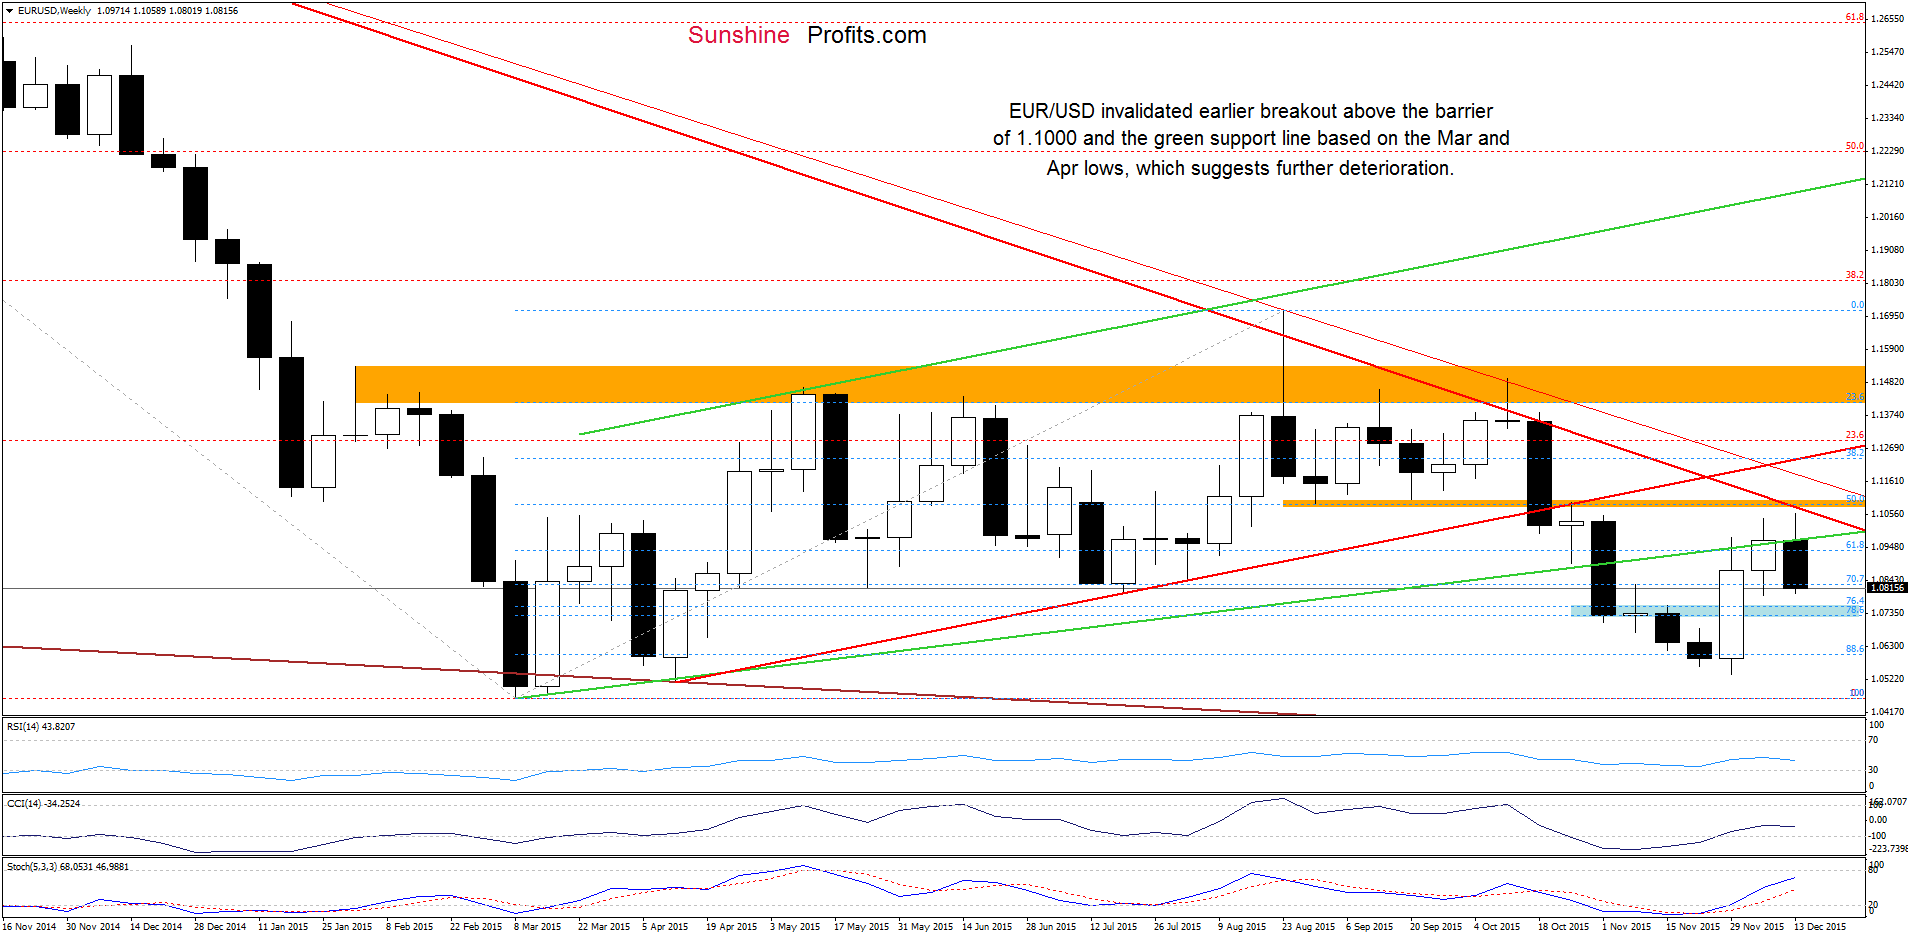
EUR/USD extended losses, which suggests a test of the blue support zone in the coming week, but will we see such price action? Let’s examine the very short-term picture and find out.
Quoting our previous alert:
(…) EUR/USD broke below the lower border of the consolidation. This is a negative signal, which in combination with sell signals generated by the indicators, suggests further declines and a drop to around 1.0708, where the size of the downward move will correspond to the height of the formation. Nevertheless, before we see such price action, currency bears will have to push the pair under the green support zone, which stopped further deterioration ten days ago.
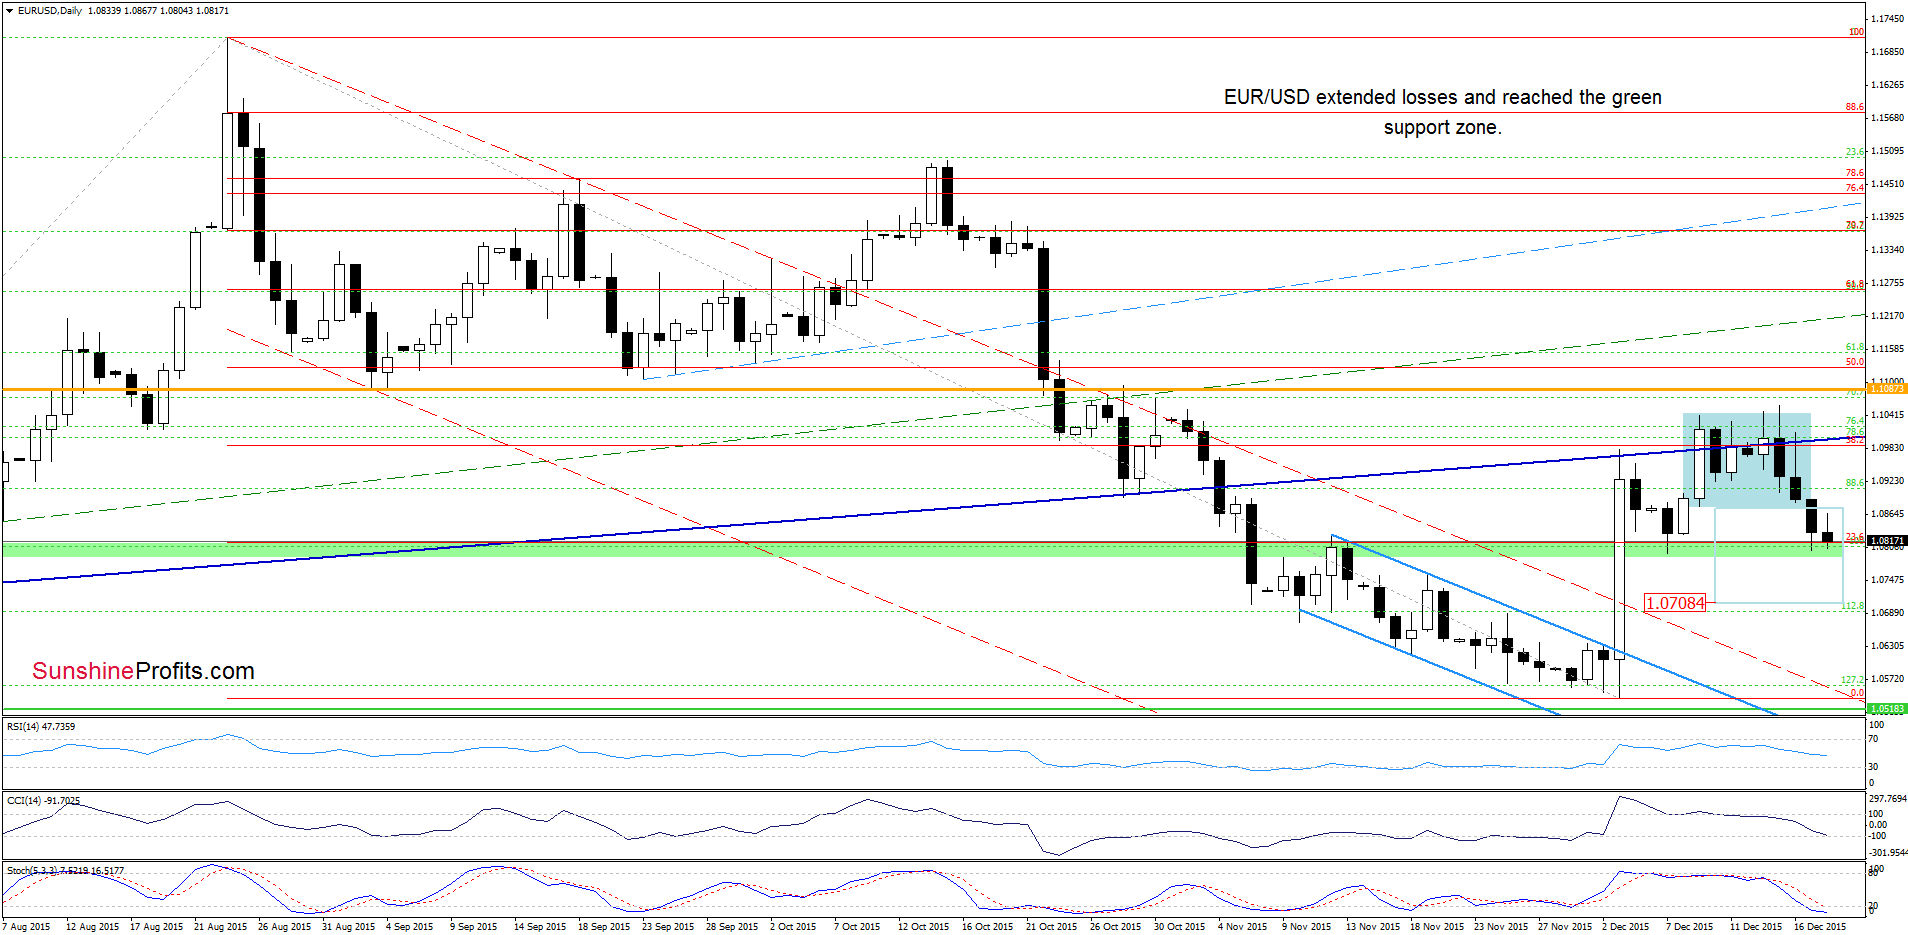
Looking at the daily chart, we see that currency bears pushed the pair to the green support zone as we had expected. Despite this deterioration, EUR/USD is still trading above the last week’s low, which suggests that we may see a rebound from here – similarly to what we saw in the previous week. Nevertheless, the medium-term picture and the current position of the daily indicators (sell signals remain in play) suggest that currency bears will try to push the exchange rate lower in the coming days.
Very short-term outlook: mixed with bearish bias
Short-term outlook: mixed
MT outlook: mixed
LT outlook: mixed
Trading position (short-term; our opinion): No positions are justified from the risk/reward perspective at the moment. However, if the pair drops under the green support zone we’ll consider re-opening short positions. We will keep you informed should anything change, or should we see a confirmation/invalidation of the above.
GBP/USD
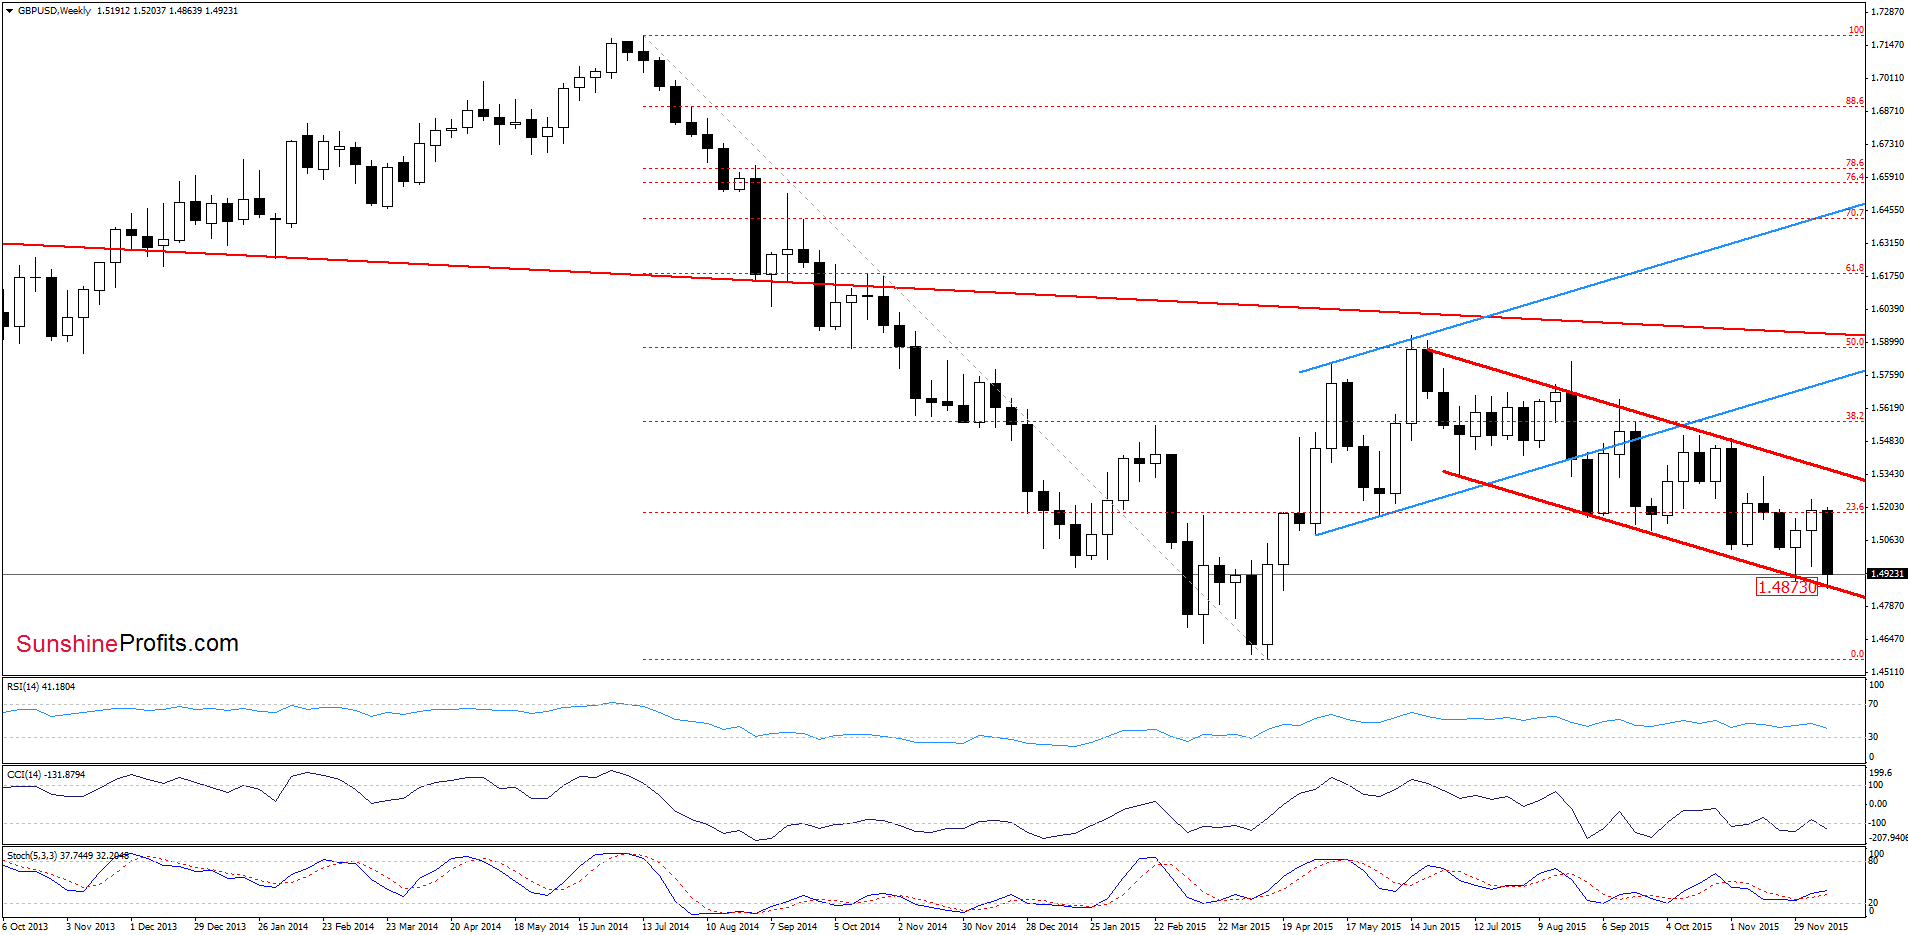
On Tuesday, we wrote:
(…) currency bears not only took the pair to our downside target, but also managed to push GBP/USD below it earlier today. This suggests that we’ll see further deterioration and a drop to the next downside target – the green support zone (created by the 76.4% and 78.6% Fibonacci retracements), which is currently reinforced by the lower border of the brown declining trend channel.
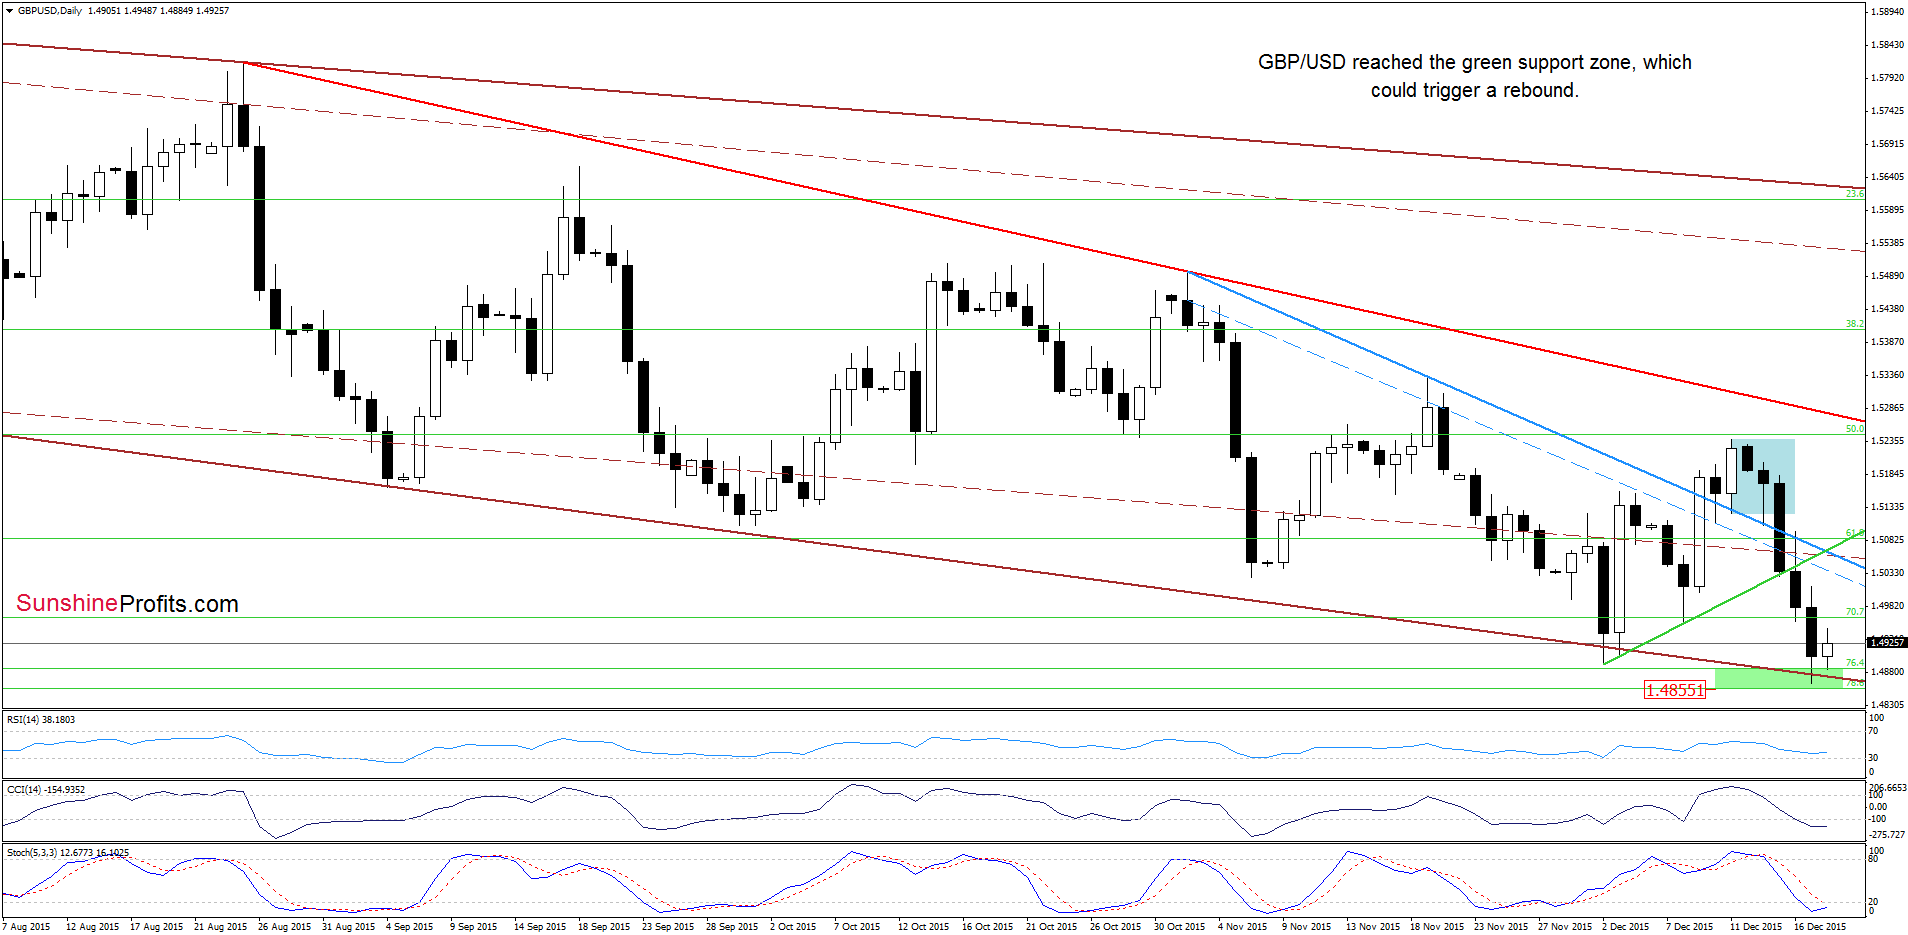
As you see on the charts, the situation developed in line with the above scenario and GBP/USD reached our downside target. With this downswing, the pair also reached the lower border of the red declining trend channel (marked on the weekly chart), which suggests that we may see a rebound from here in the coming days – especially if daily indicators generate buy signals. If this is the case, and we see such price action, the initial upside target would be the blue resistance line (currently around 1.5061).
Very short-term outlook: mixed
Short-term outlook: mixed
MT outlook: mixed
LT outlook: mixed
Trading position (short-term; our opinion): No positions are justified from the risk/reward perspective at the moment. We will keep you informed should anything change, or should we see a confirmation/invalidation of the above.
USD/JPY
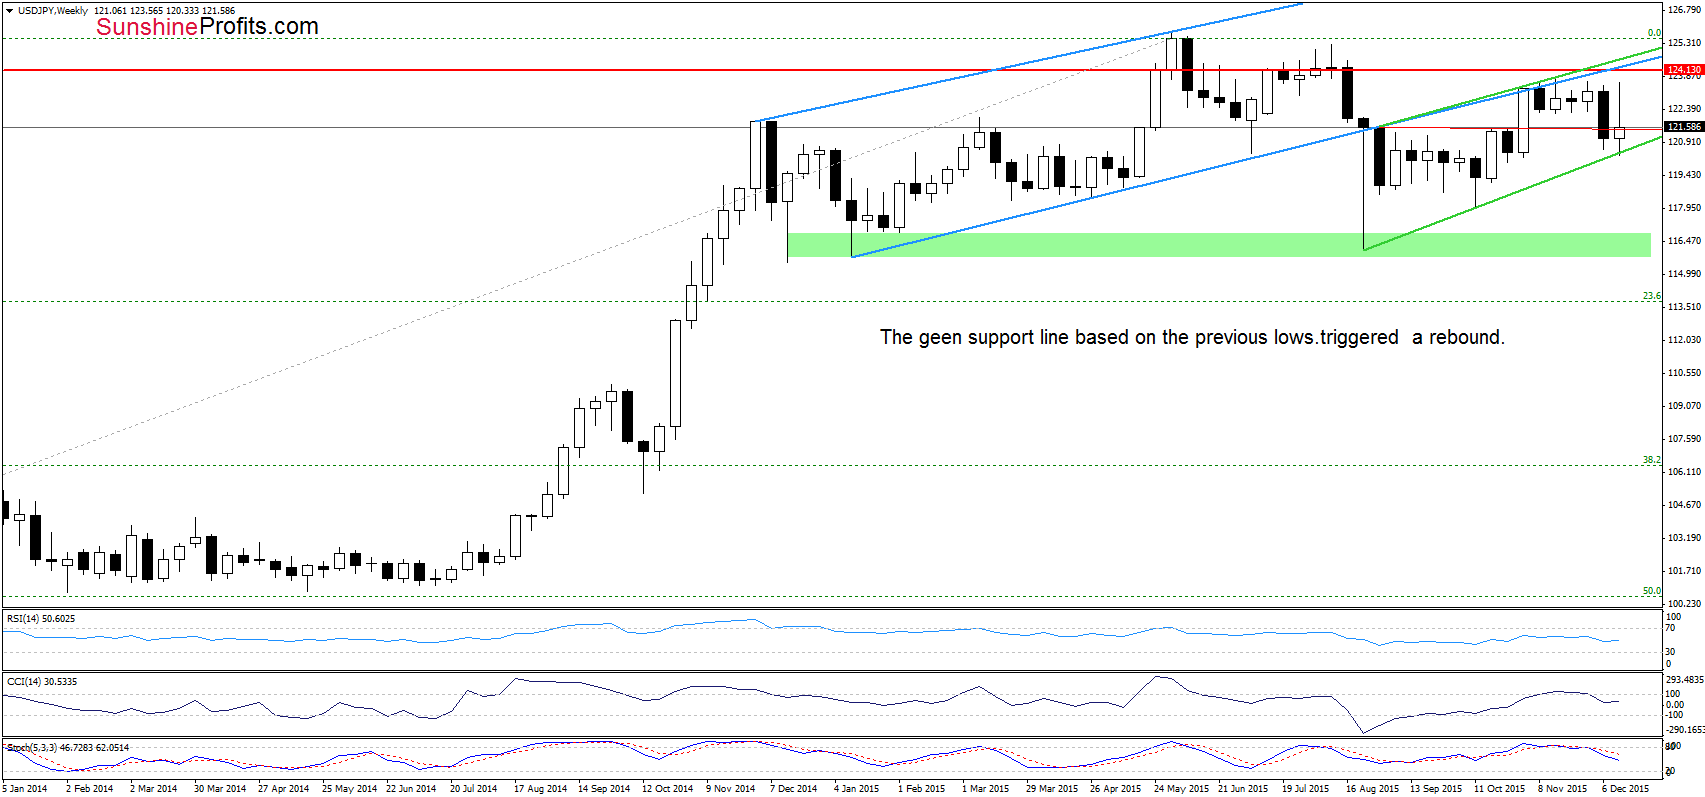
As you see USD/JPY re-approached the lower border of the blue rising trend channel, which triggered a pullback – similarly to what we saw in the previous week.
How did this move affect the very short-term picture? Let’s check.
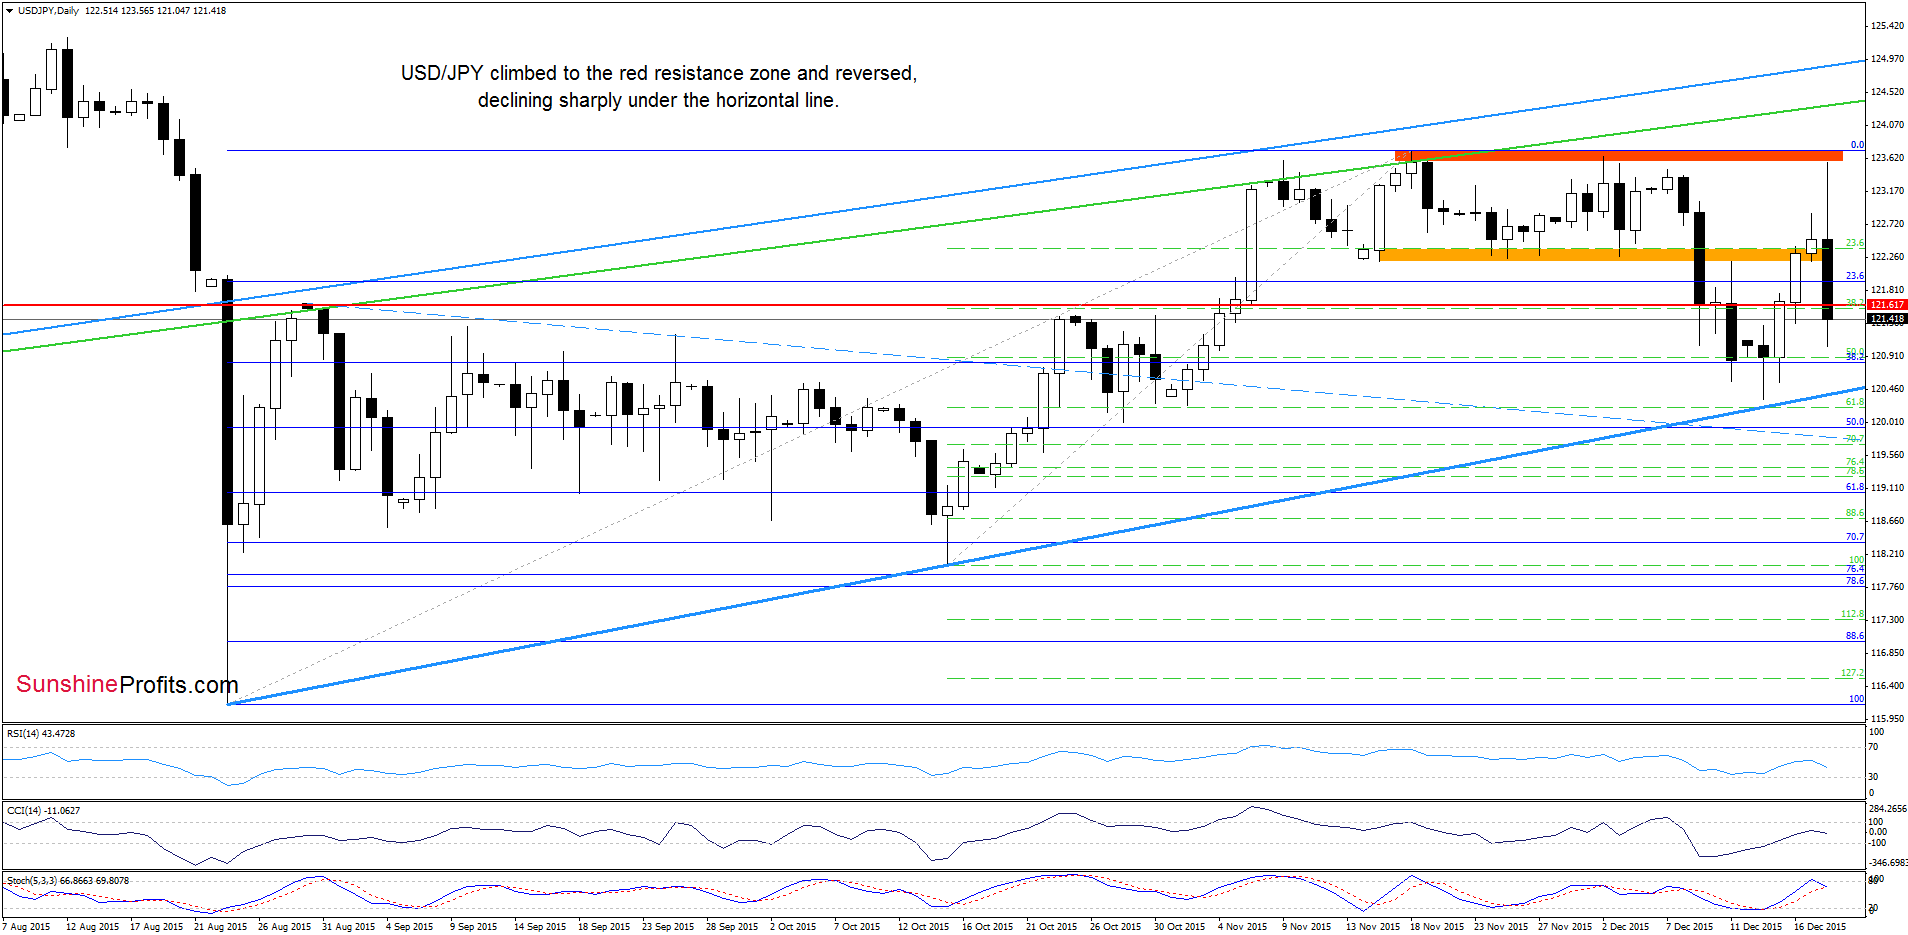
Quoting our previous commentary on this currency pair:
(…) USD/JPY reversed and rebounded, invalidating earlier breakdown under the red horizontal support line. Taking this positive signal into account, and combining it with buy signals generated by the indicators, we think that currency bulls will try to push the pair higher.
From today’s point of view, we see that currency bills pushed the pair higher as we had expected. With the recent upward move, USD/JPY broke above the orange resistance zone, which triggered an increase to the red resistance zone based on the previous highs. As you see this solid resistance area stopped currency bulls, which resulted in a reversal and a sharp decline earlier today. With this downswing, the exchange rate invalidated earlier breakout above the orange zone and the red horizontal line, which suggests a test of the medium-term blue support line in the coming day(s). At this point, it is worth noting that the current position of the indicators suggests further deterioration, which could translate into a breakdown under this key support line.
Very short-term outlook: mixed
Short-term outlook: mixed
MT outlook: mixed
LT outlook: mixed
Trading position (short-term; our opinion): No positions are justified from the risk/reward perspective at the moment. We will keep you informed should anything change, or should we see a confirmation/invalidation of the above.
USD/CAD
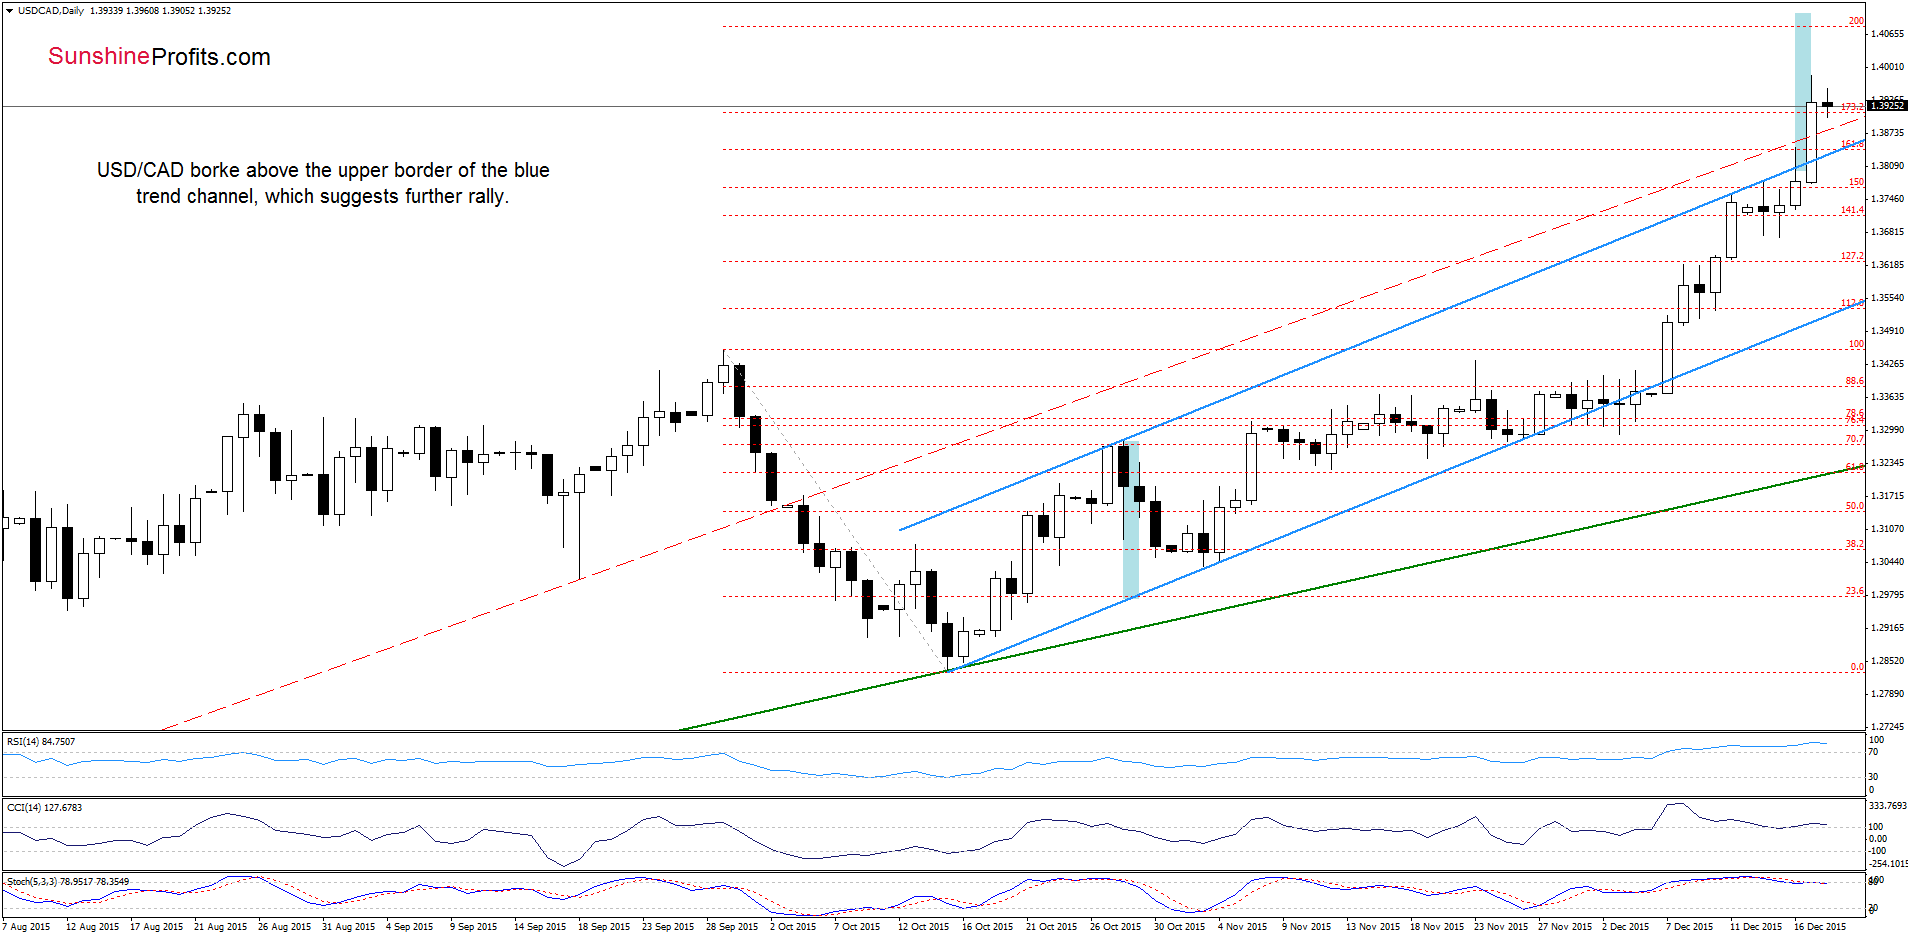
Yesterday, we wrote:
(…) the proximity to the lower border of the consolidation encouraged currency bulls to act, which resulted in a breakout above the upper line of the formation. This is a positive signal, which suggests further improvement and an increase to around 1.3883, where the size of the move will correspond to the height of the consolidation.
Looking at the daily chart, we see that currency bulls not only realized our yesterday’s scenario, but also managed to push the pair well above the upper border of the blue trend channel. This is a bullish signal, which suggests an increase to around 1.4078 (the 200% Fibonacci extension). At this point, it is worth noting that around 1.4103 the size of the upward move will correspond to the height of the trend channel.
But will we see further improvement? Let’s examine the long-term chart and look for more clues about future moves.
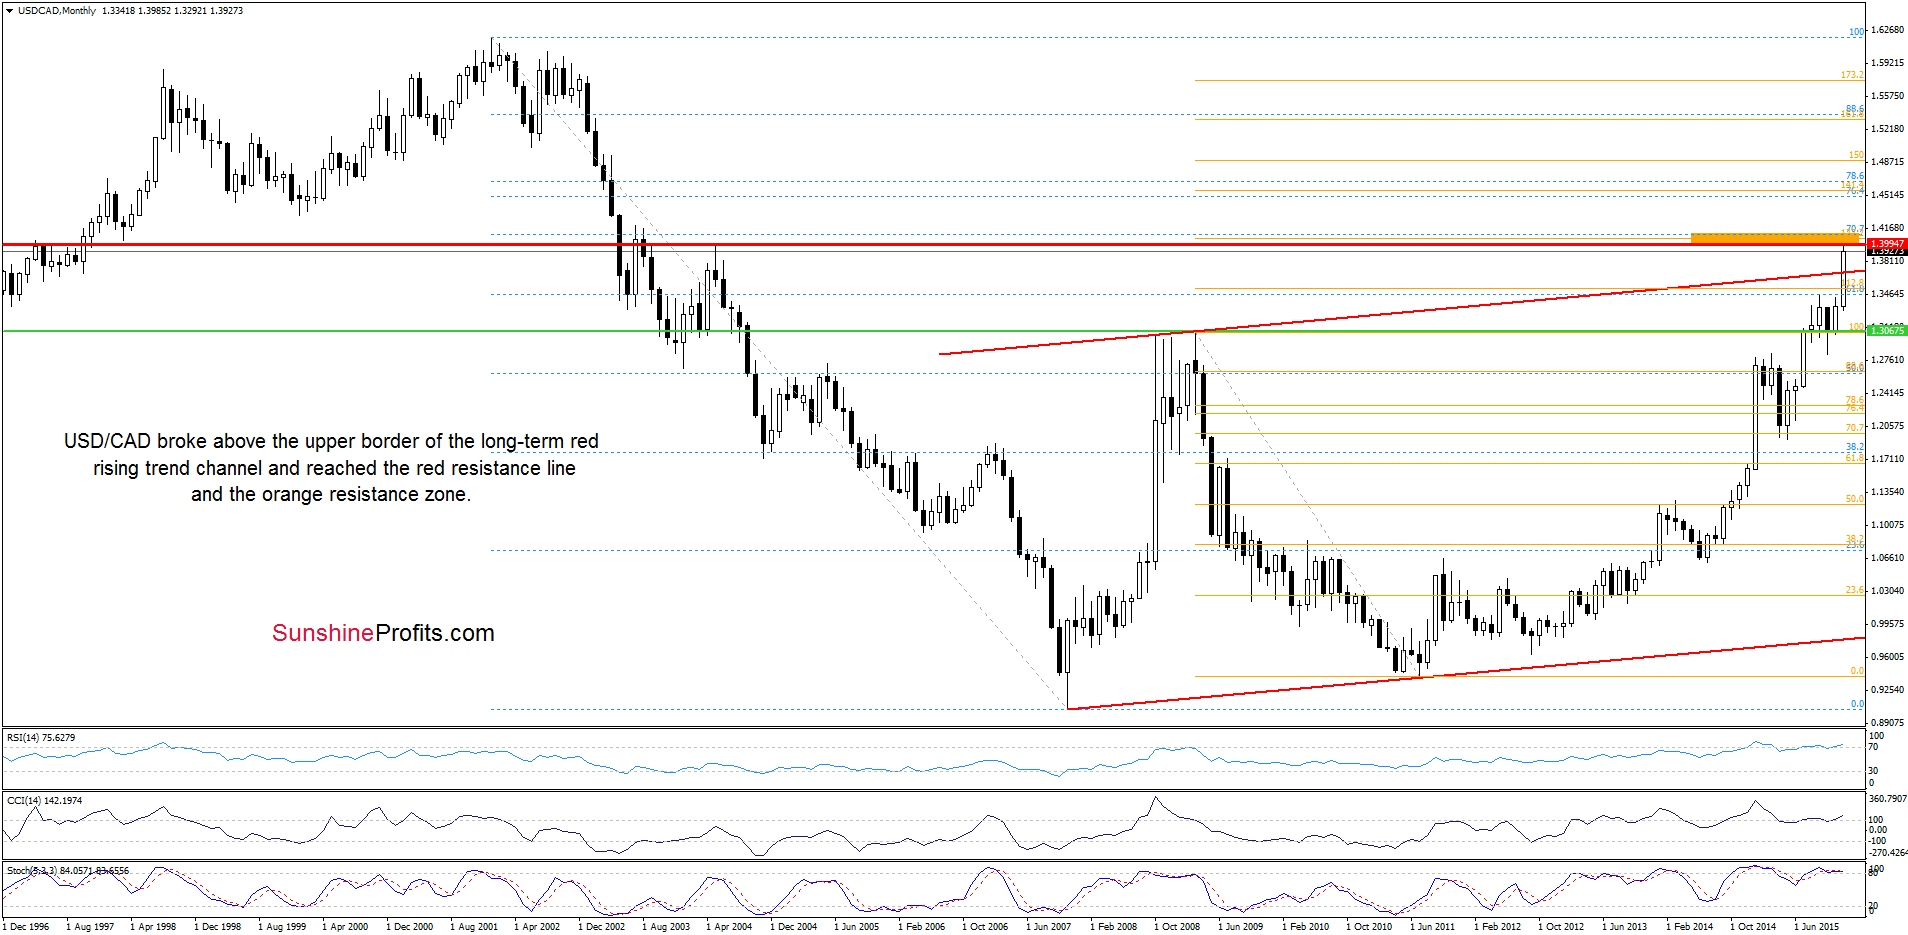
Quoting our last alert:
The first thing that catches the eye on the above chart is a breakout above the upper border of the red rising trend channel, which suggests further rally to around 1.3994, where the red horizontal resistance line (based on the May 2004 high) is.
As you see on the chart, the situation developed in line with the above scenario and the exchange rate approached the red line and the orange resistance zone created by the 27.2% Fibonacci extension and the 70.7% Fibonacci retracement based on the Jan 2002-Nov 2007 declines. Taking into account the current position of the daily and monthly indicators, we think that this solid resistance area will stop further rally and trigger a pullback in the coming week. Nevertheless, taking into account a breakout above the upper border of the red trend channel, we should also consider a pro growth scenario. If USD/CAD breaks above the orange zone, the next upside target for currency bulls would be around 1.4494-.4665, where the next resistance zone (created by the 76.4% and 78.6% Fibonacci retracements and the 141,4% Fibonacci extension) is.
Very short-term outlook: mixed
Short-term outlook: mixed
MT outlook: mixed
LT outlook: mixed
Trading position (short-term; our opinion): No positions are justified from the risk/reward perspective at the moment. We will keep you informed should anything change, or should we see a confirmation/invalidation of the above.
USD/CHF
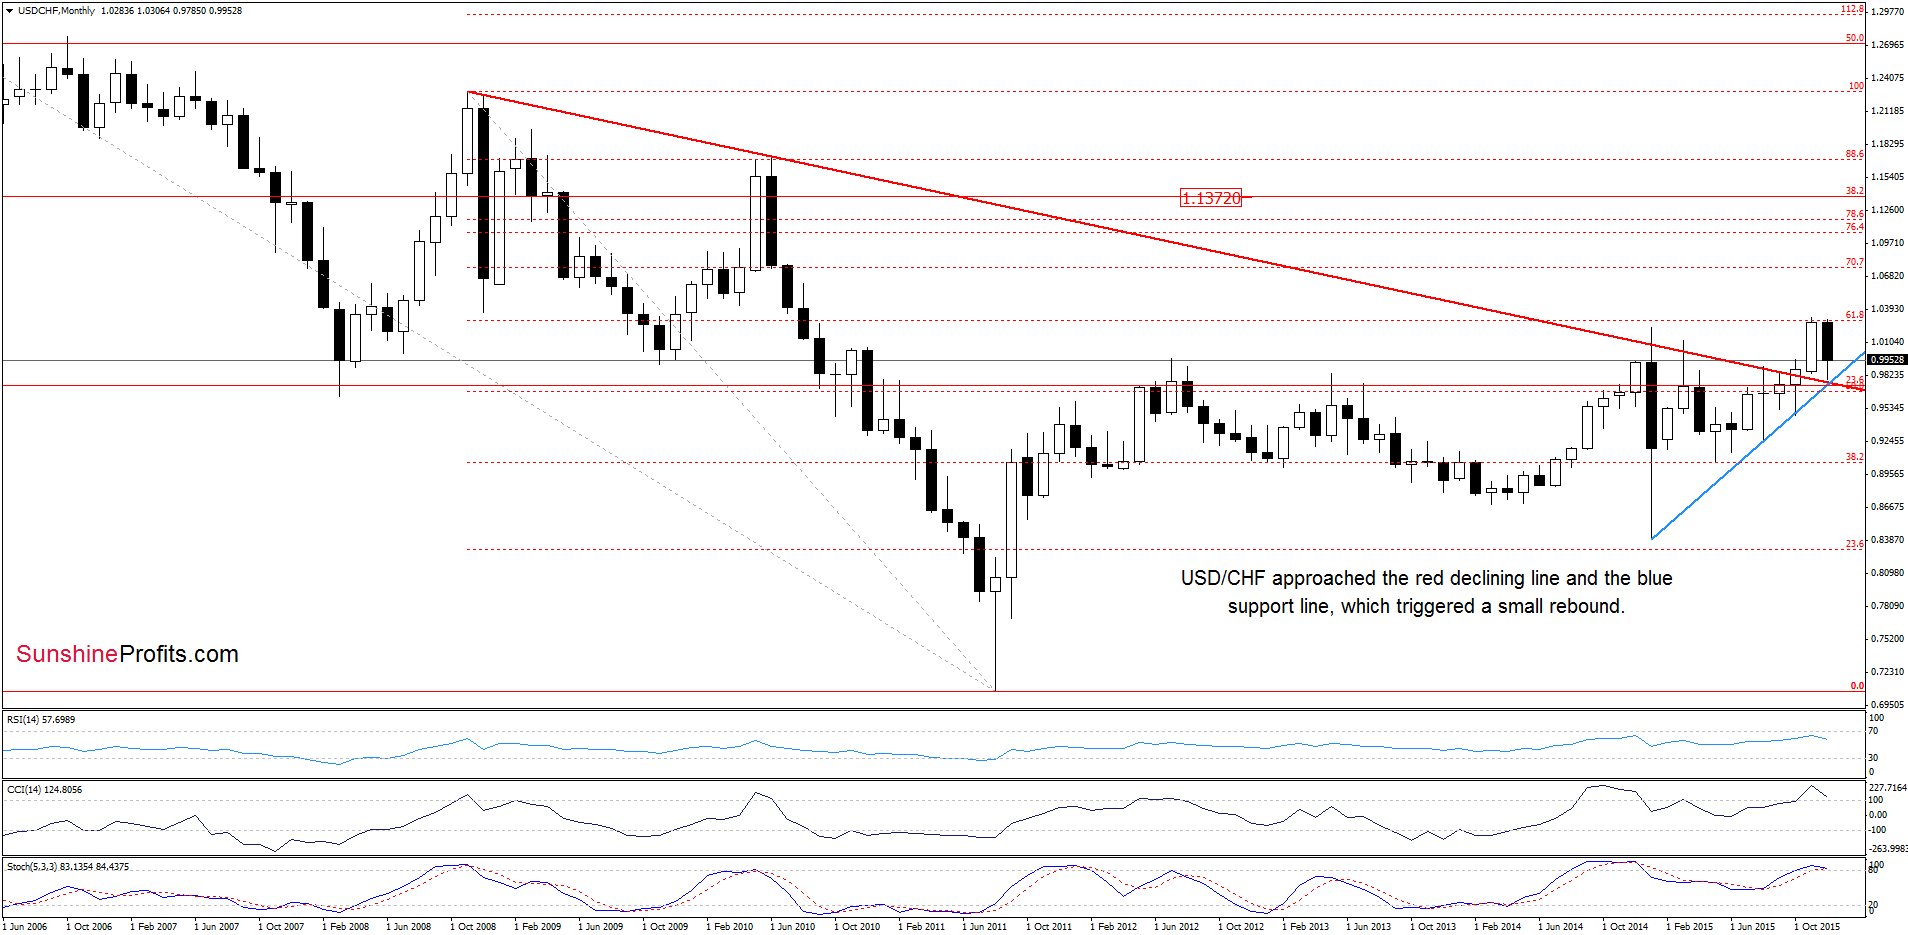
On the above chart, we see that the proximity to the previously-broken long-term red declining line and the blue support line based on the previous lows triggered a rebound.
What impact did it have on the daily chart? Let’s check.
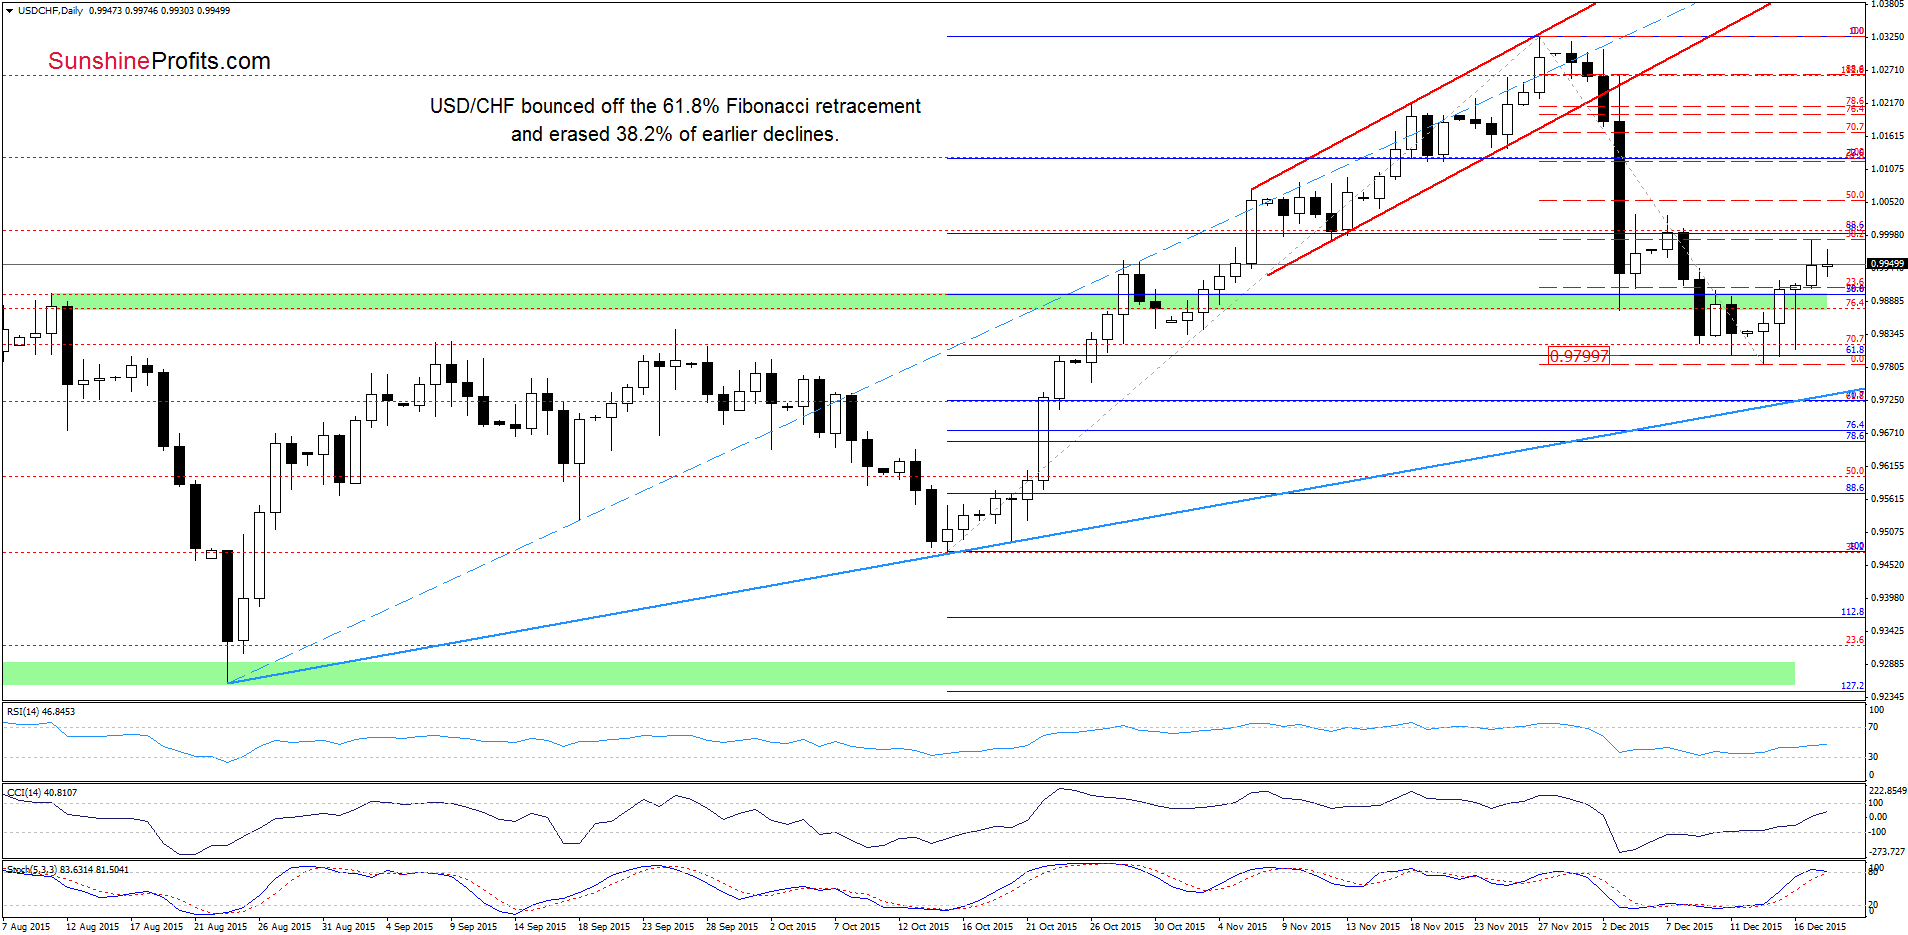
Quoting our last commentary on this currency pair:
(…) buy signals generated by the indicators remain in place, supporting another attempt to move higher.
From today’s point of view, we see that currency bulls pushed the pair higher (in line with our forecast), which resulted in an increase to the 38.2% Fibonacci retracement based on the entire Nov-Dec decline. At this point, it is worth noting that we saw similar price action in the previous week. Back then, unsuccessful attempt to move higher resulted in a drop to fresh Dec low. Therefore, if currency bulls do not manage to break higher, we’ll likely see another downswing in the coming week – especially if the Stochastic Oscillator generates a sell signal. On the other hand, a climb above the last week’s high should trigger an increase to at least the barrier of 1.0000.
Very short-term outlook: mixed
Short-term outlook: mixed
MT outlook: mixed
LT outlook: mixed
Trading position (short-term; our opinion): No positions are justified from the risk/reward perspective at the moment. We will keep you informed should anything change, or should we see a confirmation/invalidation of the above.
AUD/USD
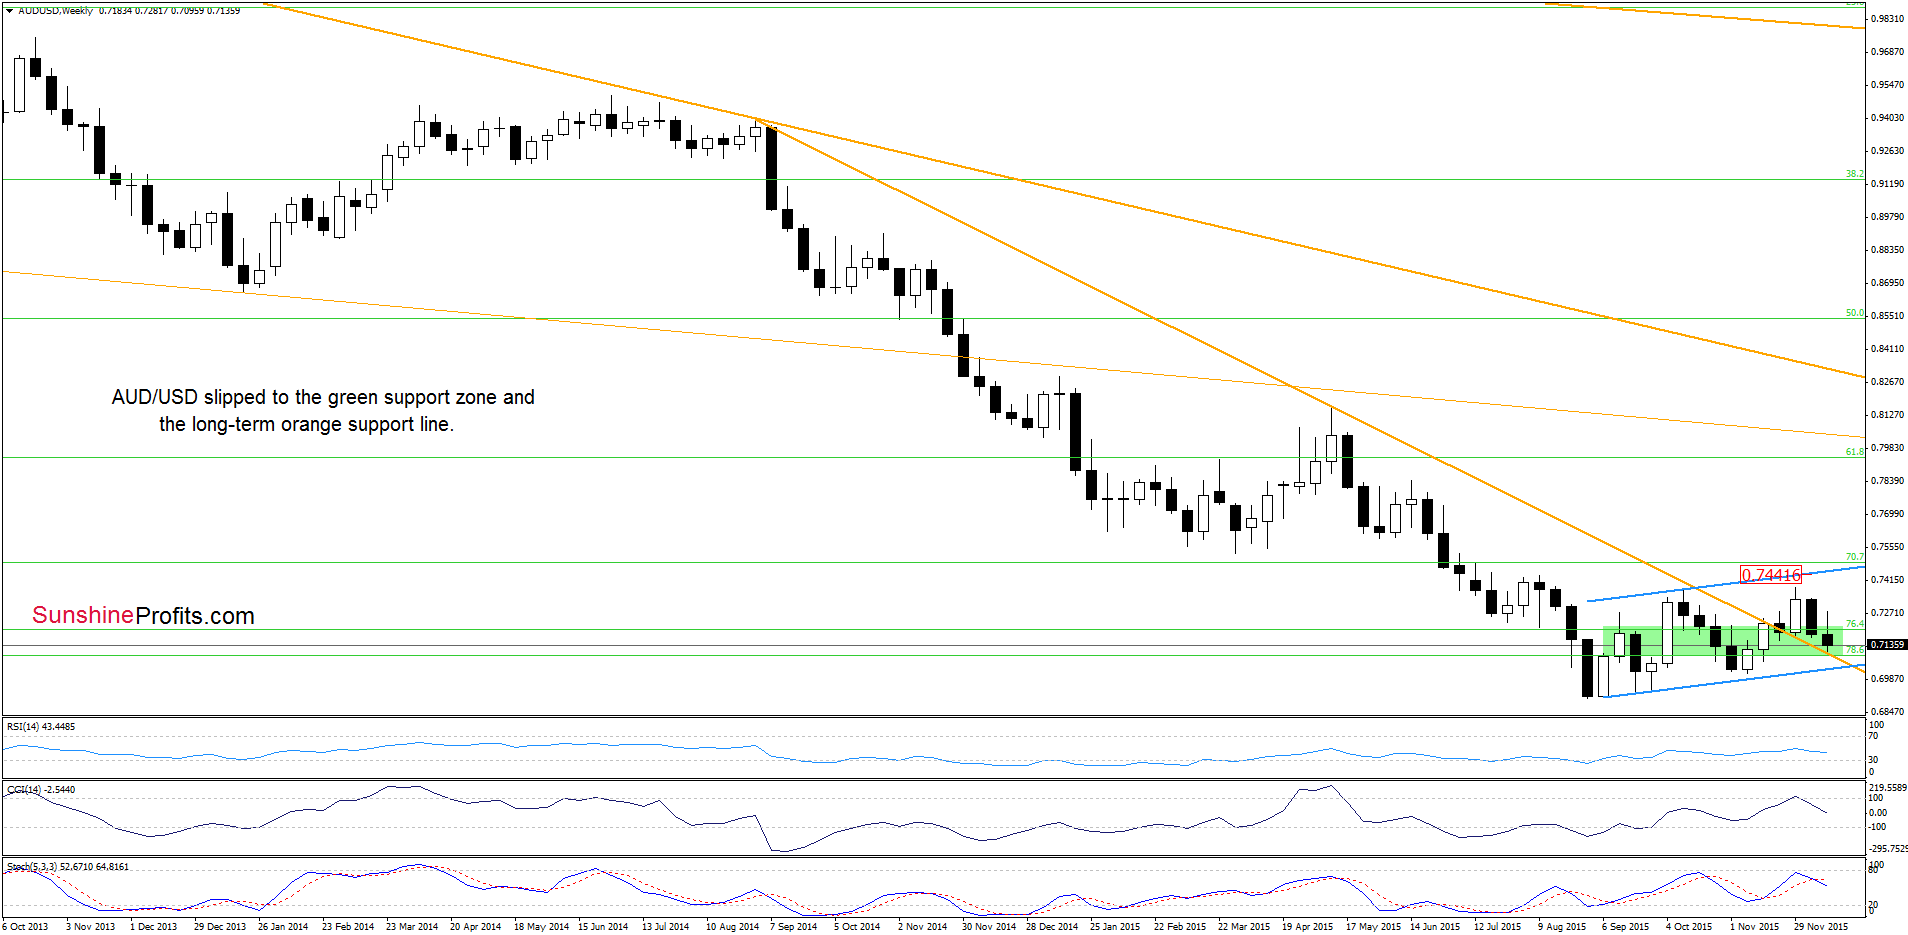
A week ago, we wrote the following:
(…) the exchange rate reversed and declined sharply to the green support line. If it is broken, we’ll see a re-test of the strength of the green support zone (marked on the daily chart) and the orange support line (marked on the weekly chart).
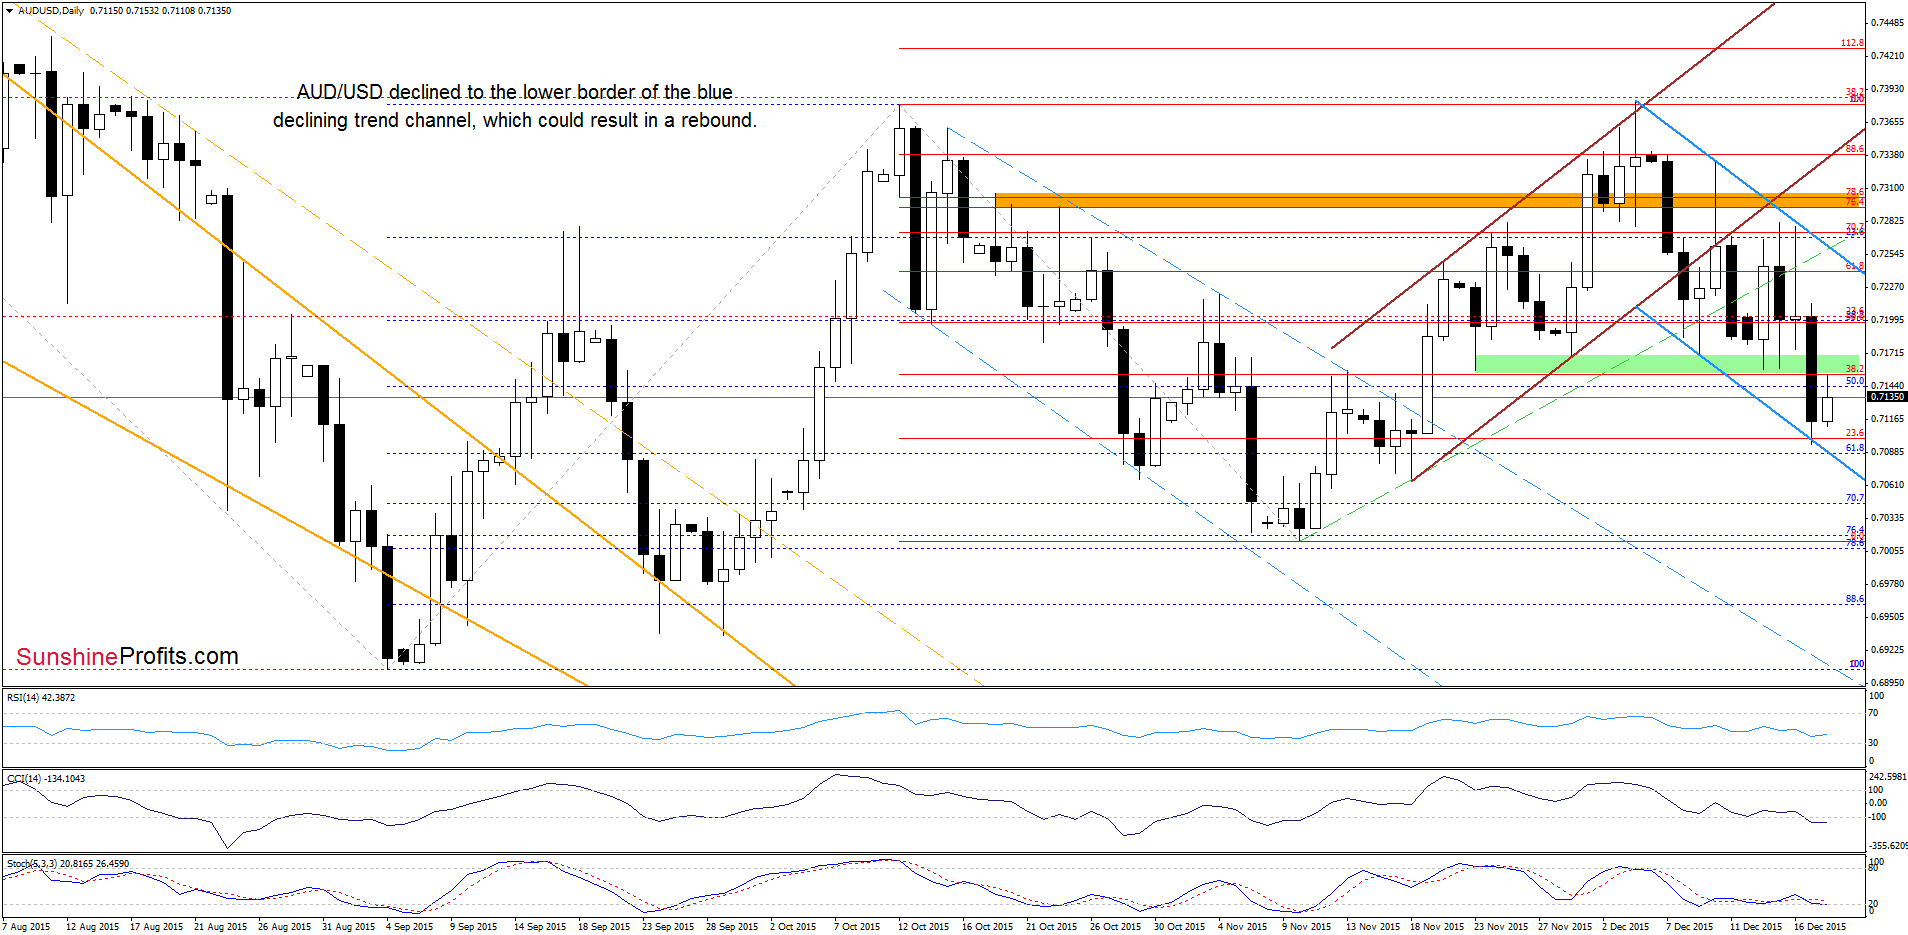
From today’s point of view, we see that currency bears pushed the pair not only to the green support zone seen on the daily chart, but also to the orange support line which suggests further improvement in the coming week. However, in our opinion, such price action will be more likely if AUD/USD comes back above the green zone marked on the daily chart. If we see such price action, the next upside target would be the upper line of the blue declining trend channel (currently around 0.7256).
Very short-term outlook: mixed
Short-term outlook: mixed
MT outlook: mixed
LT outlook: mixed
Trading position (short-term; our opinion): No positions are justified from the risk/reward perspective at the moment. We will keep you informed should anything change, or should we see a confirmation/invalidation of the above.
Thank you.
Nadia Simmons
Forex & Oil Trading Strategist
Przemyslaw Radomski, CFA
Founder, Editor-in-chief
Gold & Silver Trading Alerts
Forex Trading Alerts
Oil Investment Updates
Oil Trading Alerts

