

Earlier today, the euro was almost unchanged against the U.S. dollar as sentiment on the greenback remained supported by the Wednesday’s Federal Reserve’s decision. As a result EUR/USD is trading slightly above the key short-term support. Will it encourage currency bulls to act in the coming days?
In our opinion the following forex trading positions are justified - summary:
EUR/USD
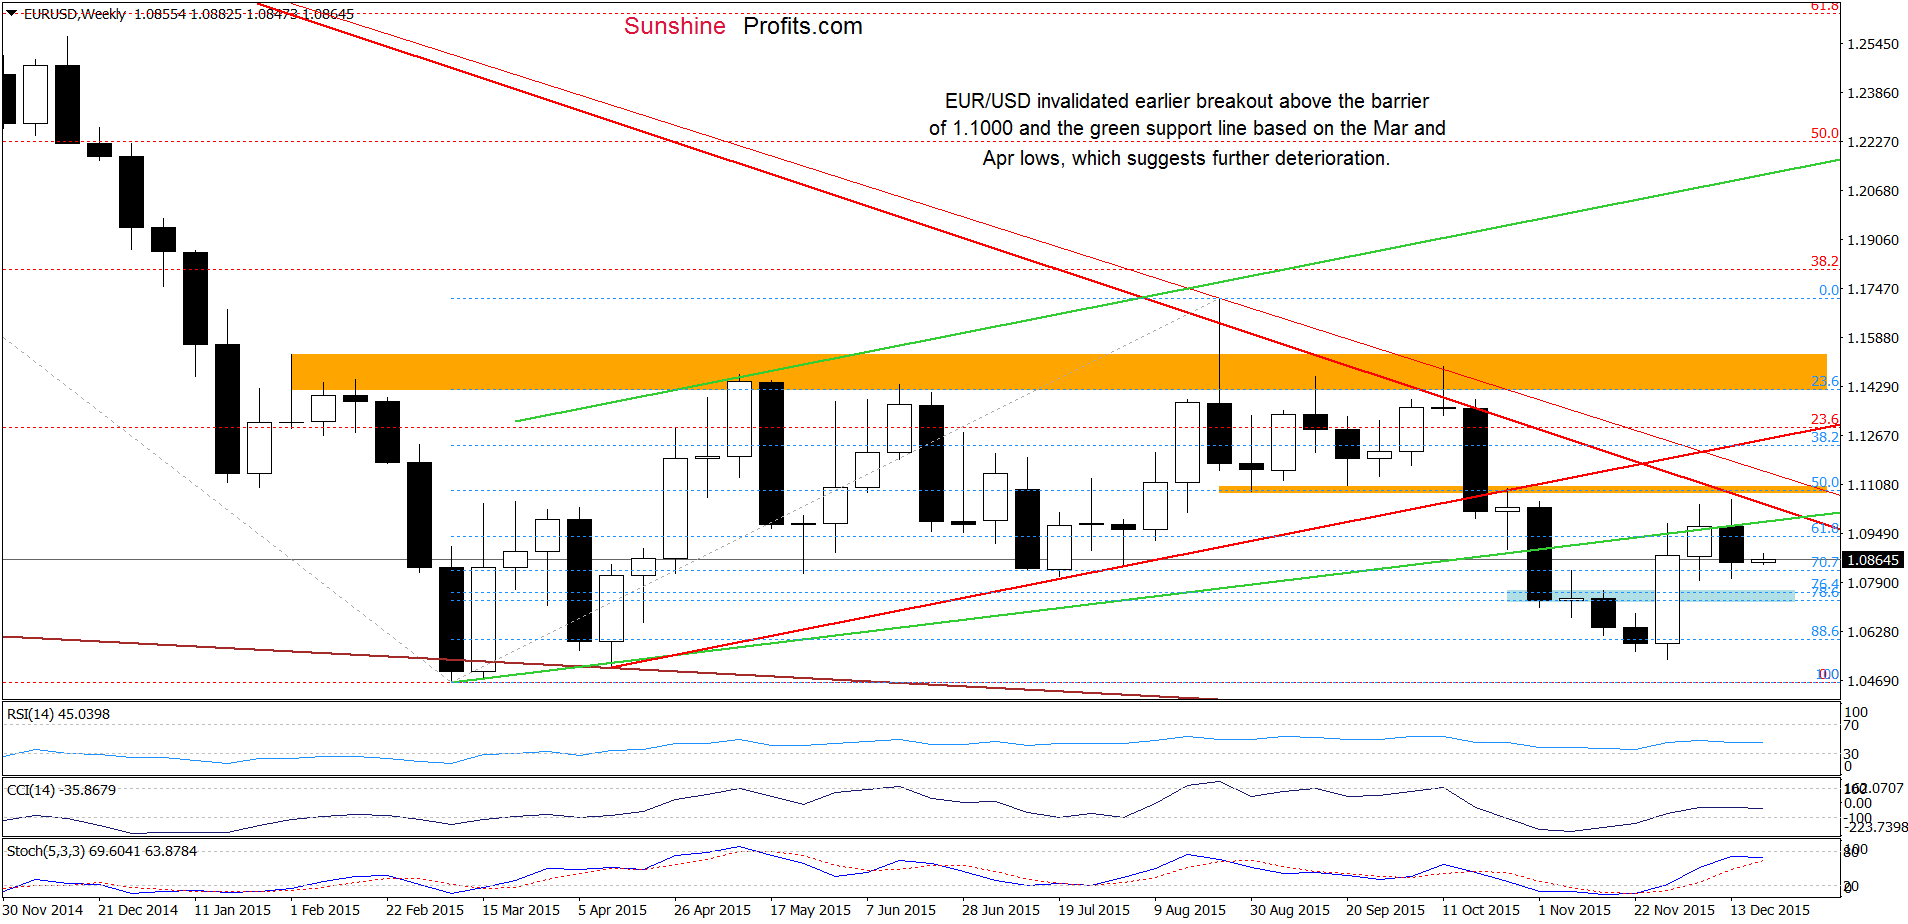
EUR/USD closed the previous week under the barrier of 1.1000 and the green support/resistance line based on the Mar and Apr lows which is a negative signal that suggests a test of the blue support zone in the coming week(s).
Are there any factors that could hinder the realization of the above scenario? Let’s examine the very short-term picture and find out.
Quoting our previous alert:
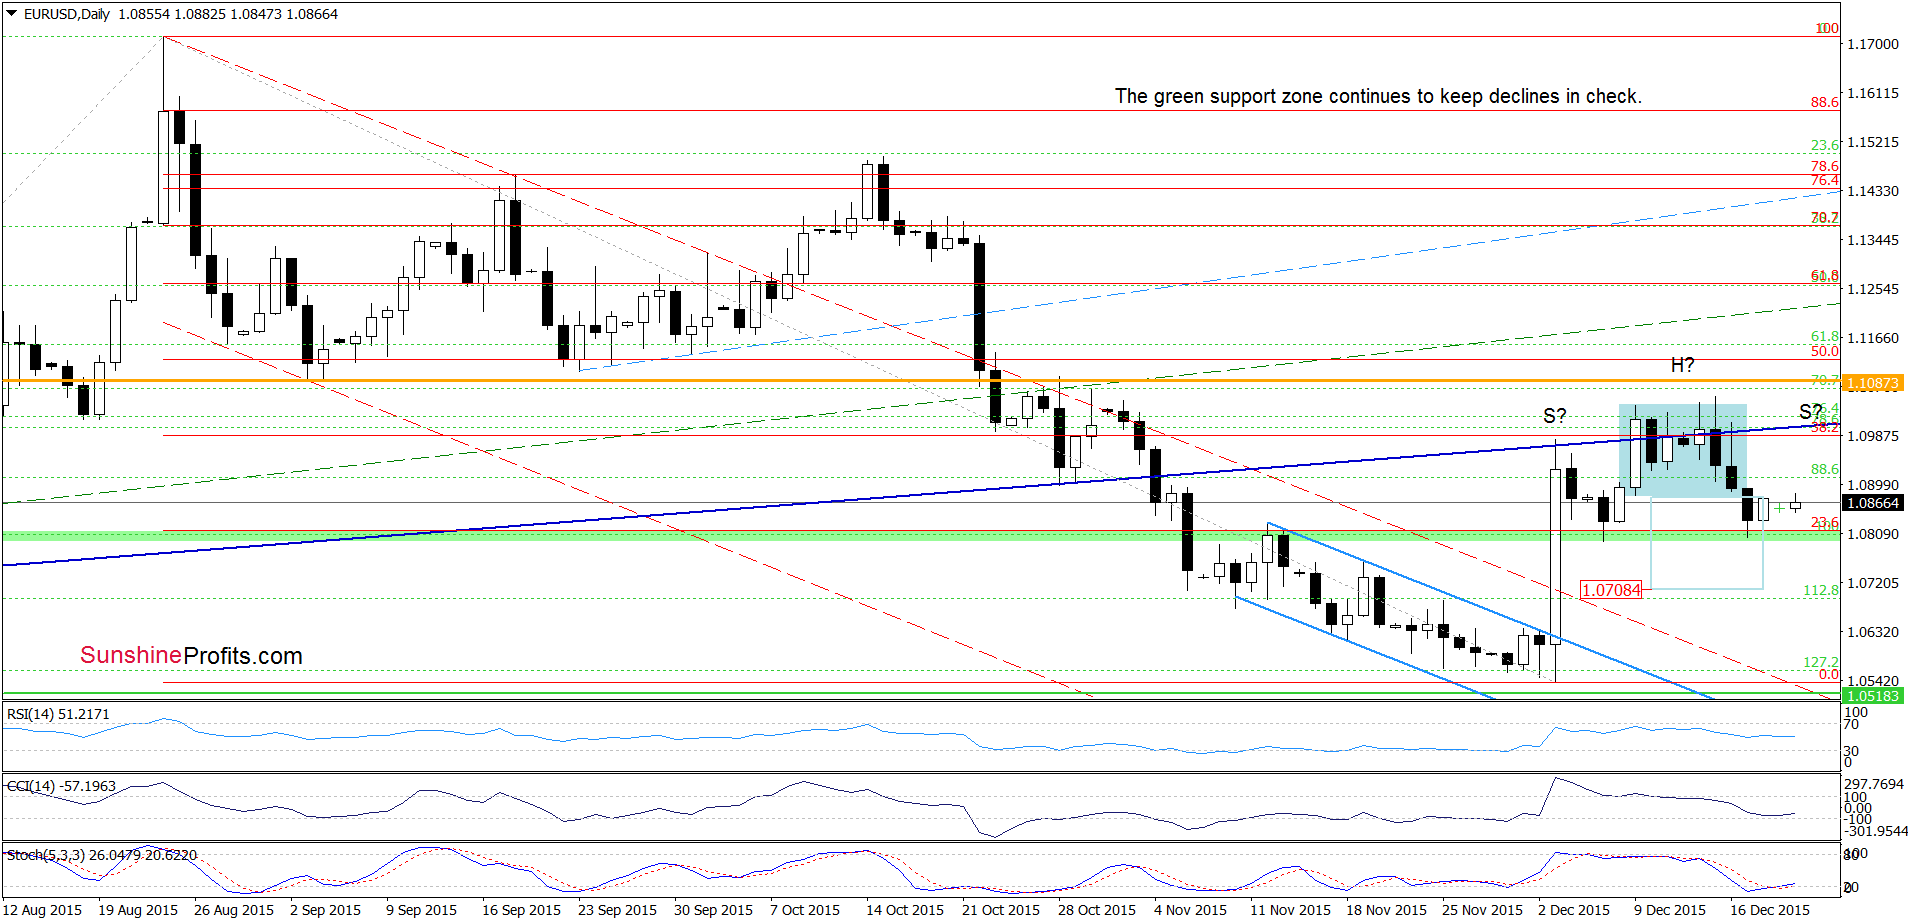
(…) EUR/USD is still trading above the last week’s low, which suggests that we may see a rebound from here – similarly to what we saw in the previous week.
As you see on the daily chart, the green support zone encouraged currency bulls to act, which resulted in a small rebound. Taking into account the fact that the green area continues to keep gains in check and combining it with the current position of the indicators (the CCI and Stochastic Oscillator are very close to generating buy signals), we think that further improvement is just around the corner. If we see such price action, the initial upside target would be around 1.1000, where the 38.2% Fibonacci retracement and the navy blue resistance line are. Please note that in this case, we may see a head and shoulders formation in the coming days (an upward move from current levels would be a potential right shoulder of the pattern).
Very short-term outlook: mixed
Short-term outlook: mixed
MT outlook: mixed
LT outlook: mixed
Trading position (short-term; our opinion): No positions are justified from the risk/reward perspective at the moment. However, if the pair drops under the green support zone we’ll consider re-opening short positions. We will keep you informed should anything change, or should we see a confirmation/invalidation of the above.
GBP/USD
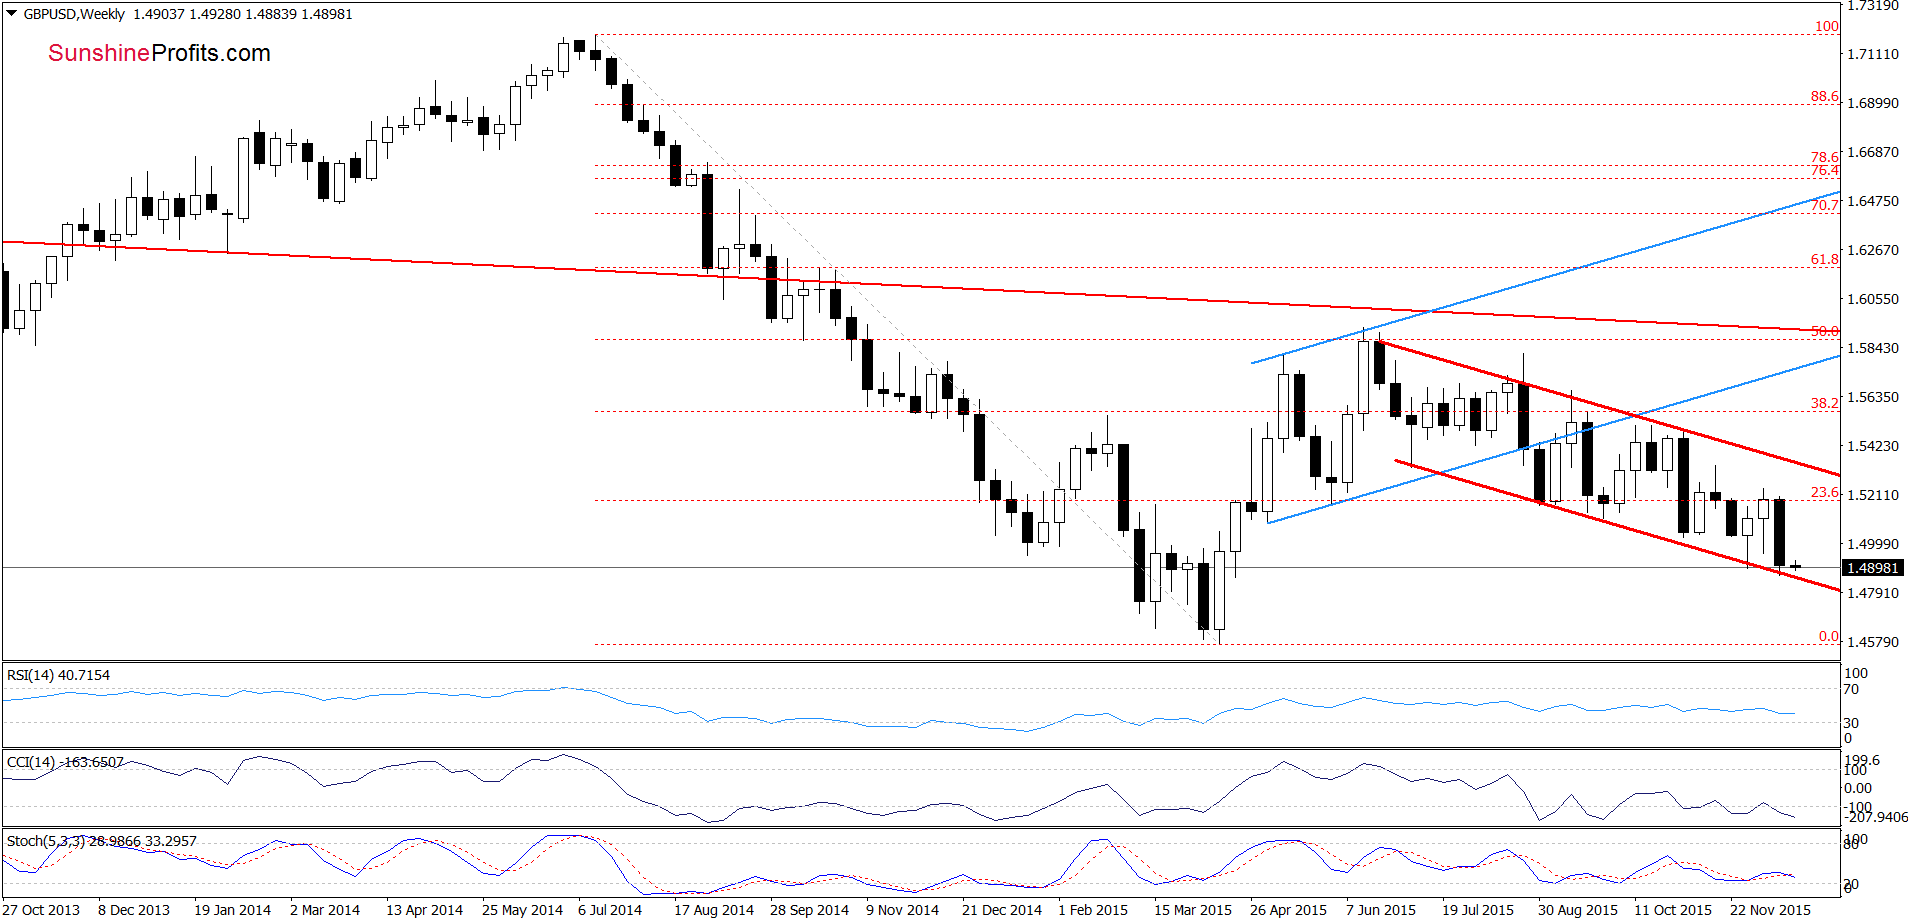
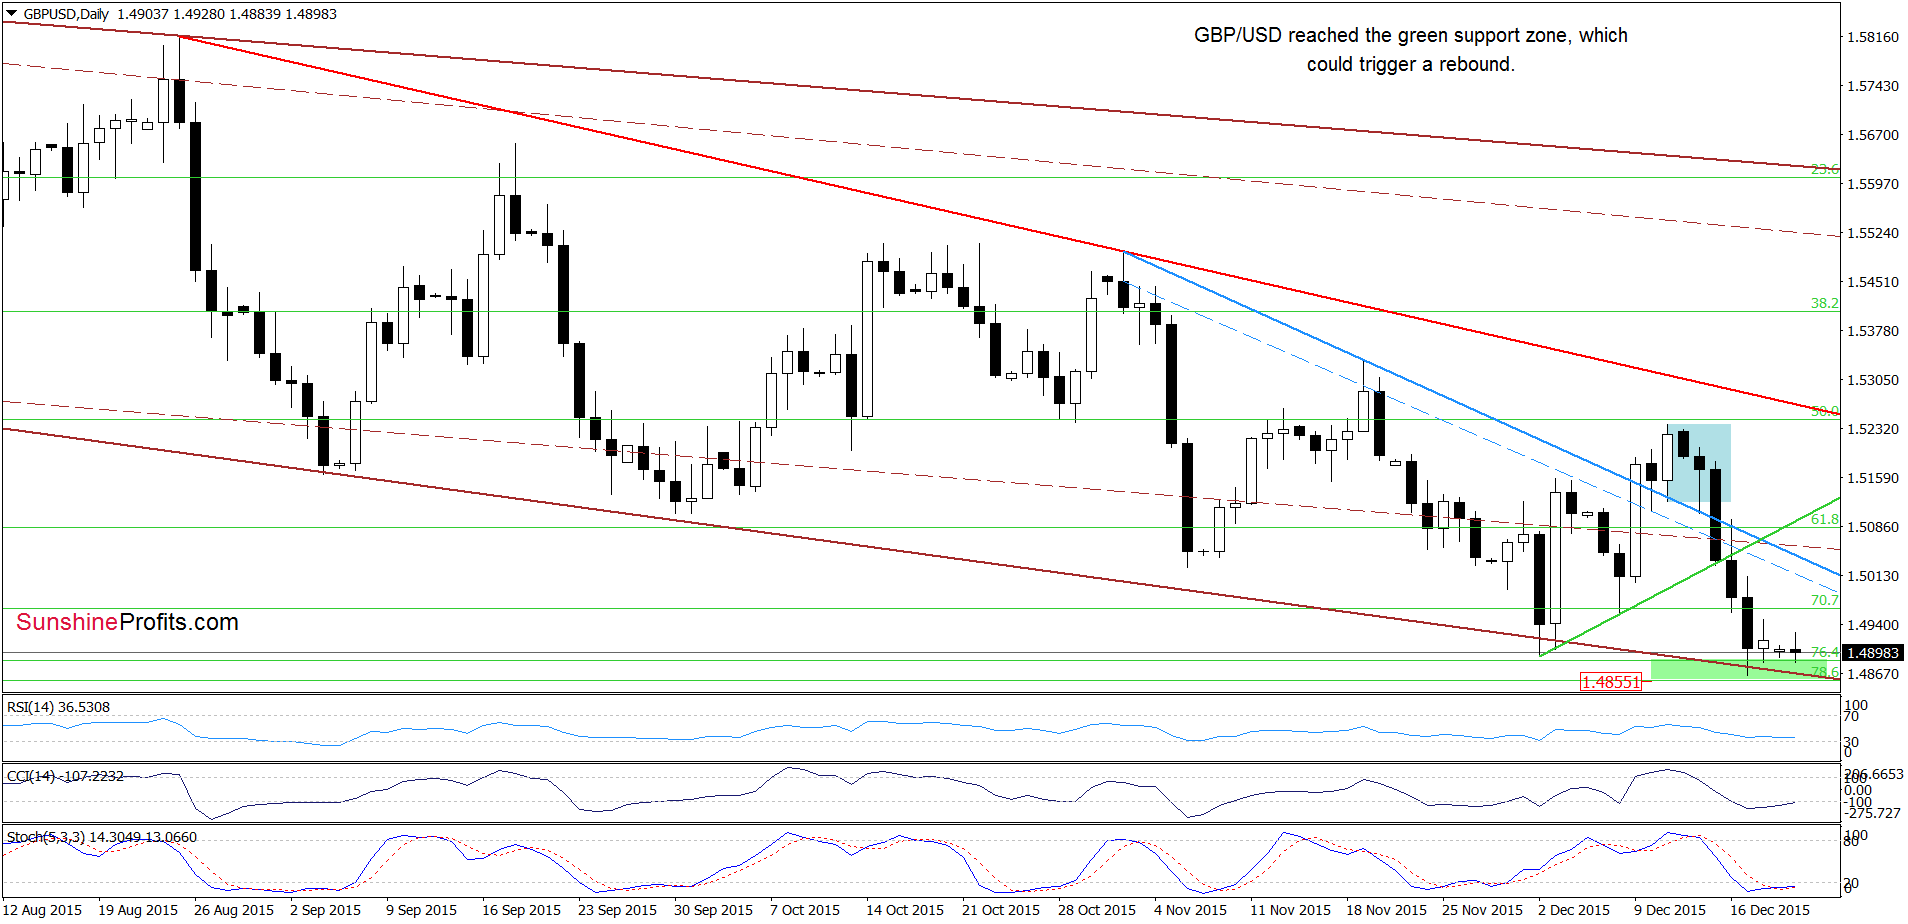
Looking at the chart, we see that GBP/USD is consolidating slightly above the green support zone and the lower border of the trend channel, which means that what we wrote on Friday is up-to-date also today:
(…) the pair also reached the lower border of the red declining trend channel (marked on the weekly chart), which suggests that we may see a rebound from here in the coming days – especially if daily indicators generate buy signals. If this is the case, and we see such price action, the initial upside target would be the blue resistance line (currently around 1.5061).
Very short-term outlook: mixed
Short-term outlook: mixed
MT outlook: mixed
LT outlook: mixed
Trading position (short-term; our opinion): No positions are justified from the risk/reward perspective at the moment. We will keep you informed should anything change, or should we see a confirmation/invalidation of the above.
USD/CAD
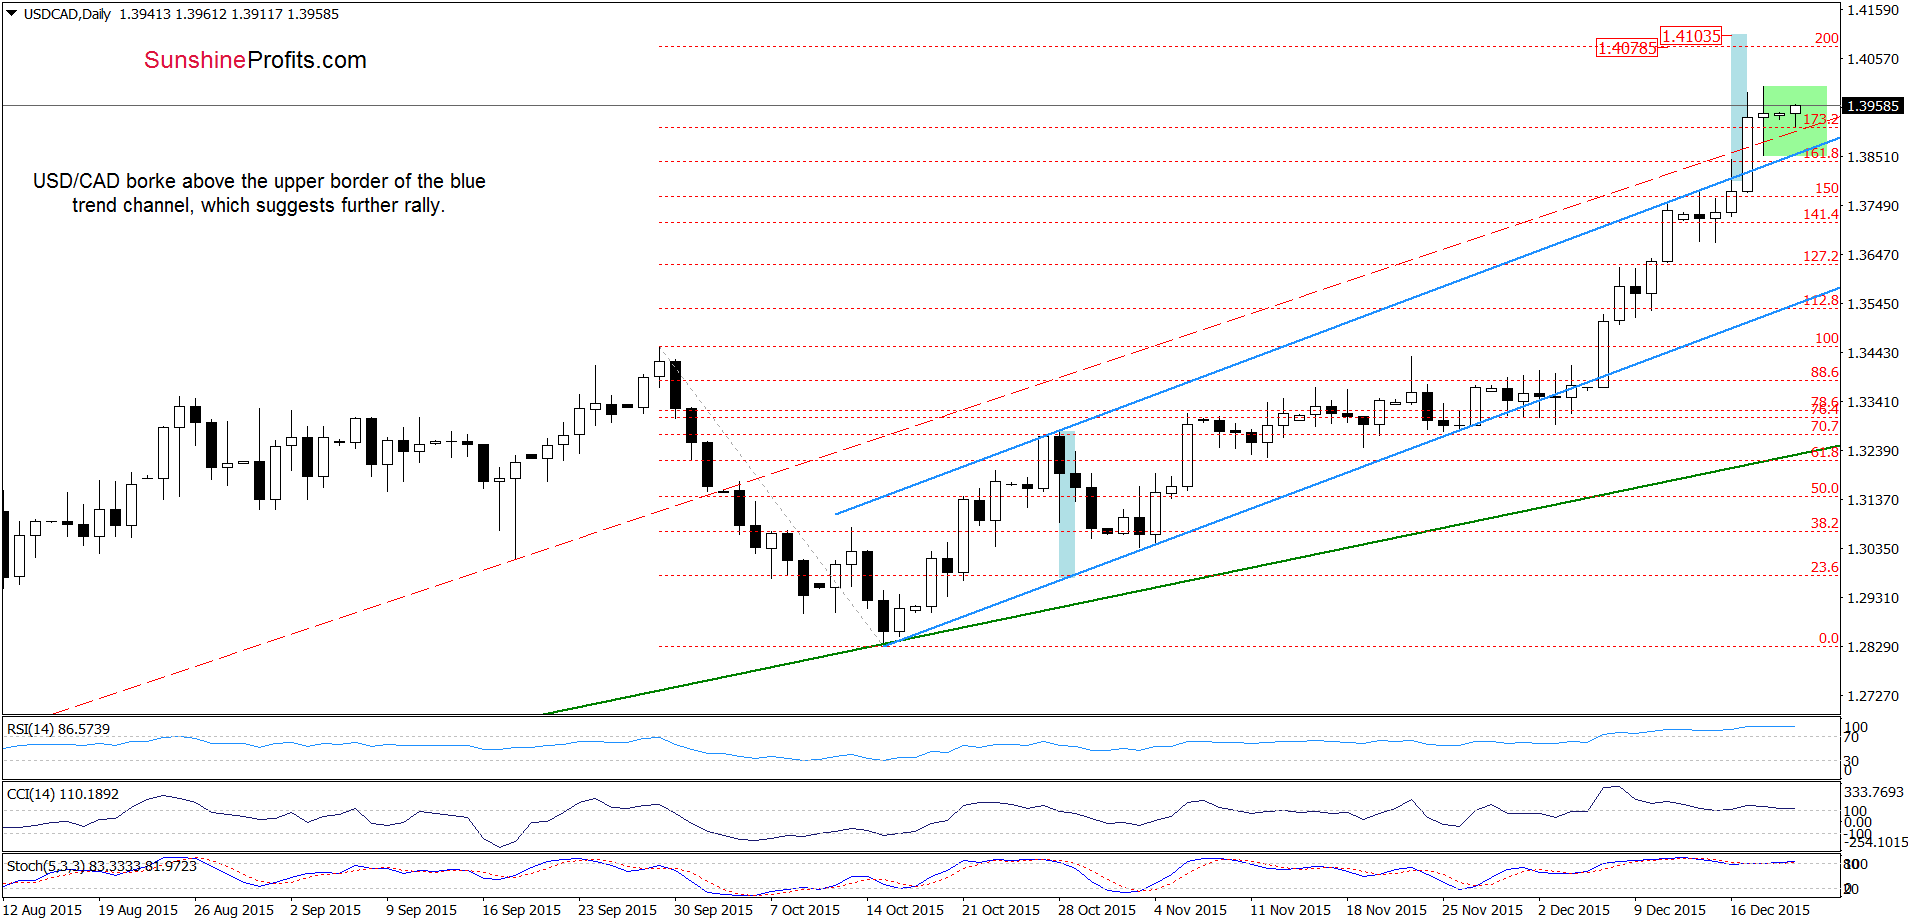
From today’s point of view, we see that USD/CAD is consolidating slightly above the previously-broken upper border of the blue trend channel, which means that our last commentary on this currency pair is still valid:
This is a bullish signal, which suggests an increase to around 1.4078 (the 200% Fibonacci extension). At this point, it is worth noting that around 1.4103 the size of the upward move will correspond to the height of the trend channel.
But will we see further improvement? Let’s examine the long-term chart and look for more clues about future moves.
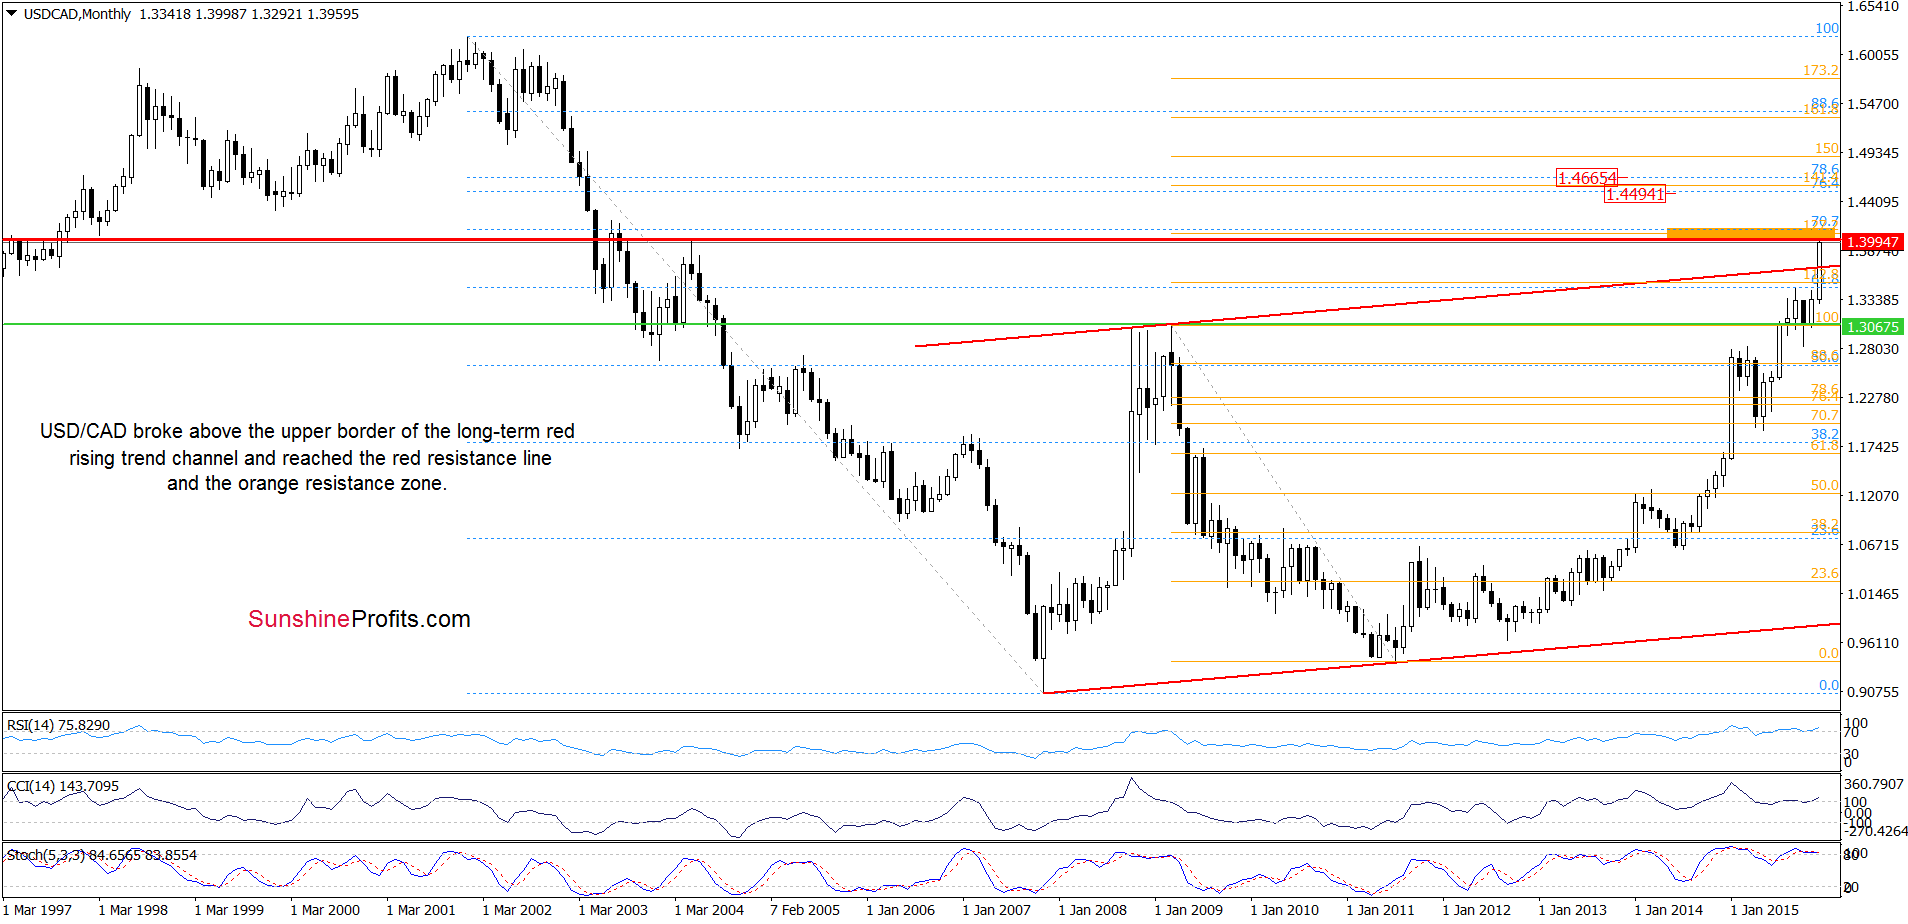
(…) the exchange rate approached the red line and the orange resistance zone created by the 27.2% Fibonacci extension and the 70.7% Fibonacci retracement based on the Jan 2002-Nov 2007 declines. Taking into account the current position of the daily and monthly indicators, we think that this solid resistance area will stop further rally and trigger a pullback in the coming week. Nevertheless, taking into account a breakout above the upper border of the red trend channel, we should also consider a pro growth scenario. If USD/CAD breaks above the orange zone, the next upside target for currency bulls would be around 1.4494-.4665, where the next resistance zone (created by the 76.4% and 78.6% Fibonacci retracements and the 141,4% Fibonacci extension) is.
Very short-term outlook: mixed
Short-term outlook: mixed
MT outlook: mixed
LT outlook: mixed
Trading position (short-term; our opinion): No positions are justified from the risk/reward perspective at the moment. We will keep you informed should anything change, or should we see a confirmation/invalidation of the above.
Thank you.
Nadia Simmons
Forex & Oil Trading Strategist
Przemyslaw Radomski, CFA
Founder, Editor-in-chief
Gold & Silver Trading Alerts
Forex Trading Alerts
Oil Investment Updates
Oil Trading Alerts

