

Yesterday, Greece presented a signed copy of an emergency bailout to its creditors, agreeing to a strict package of reforms and spending cuts worth around €13 billion. In exchange for the adoption of the austerity measures, the country could receive approximately €50 billion in short-term funding needed to stave off bankruptcy. This move brought Greece one step closer to a deal with its European creditors, rising optimism among investors and fueling demand for riskier assets. As a result, the USD Index reversed and declined, hitting a weekly low of 95.56. What impact did this drop have on the short-term picture of our six currency pairs?
In our opinion the following forex trading positions are justified - summary:
EUR/USD
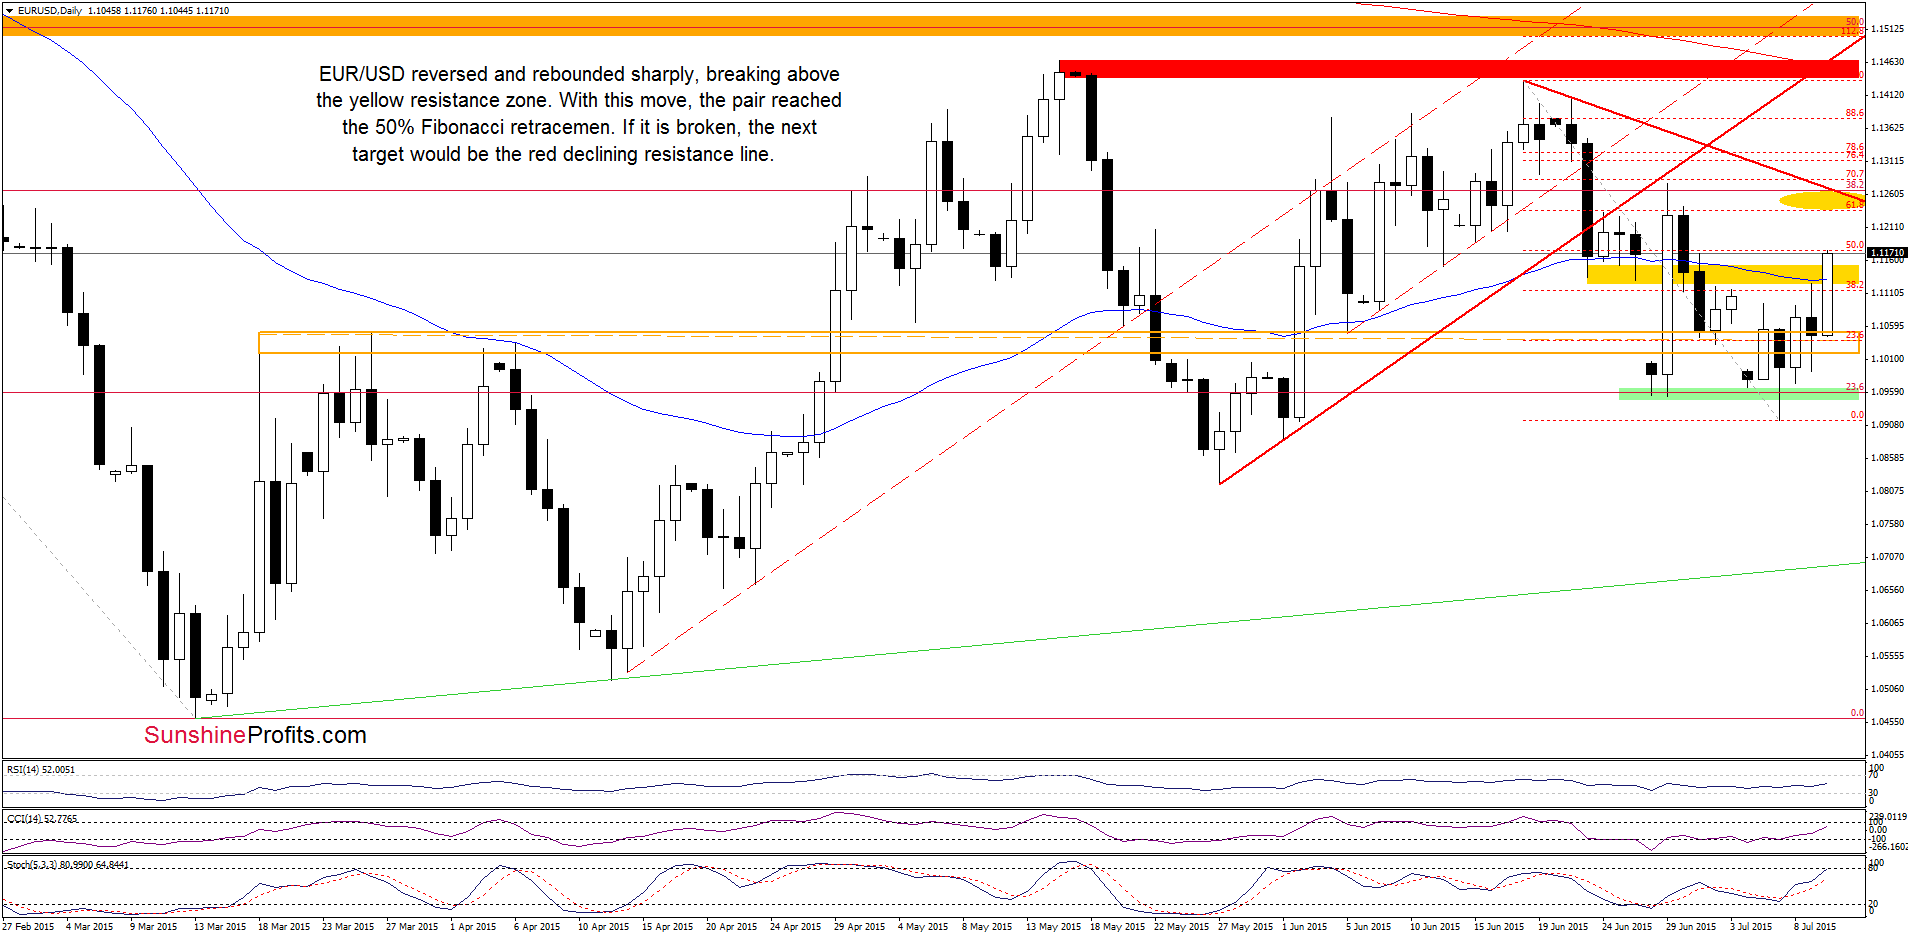
Earlier today, EUR/USD reversed and rebounded sharply, breaking above the yellow resistance zone. With this move, the exchange rate reached the 50% Fibonacci retracement level (based on the Jun-Jul decline) and the Jul high. Taking into account buy signals generated by the indicators, it seems that currency bulls will try to push the pair higher. If this is the case and the above-mentioned resistance levels are broken, the next upside target would be around 1.1237-1.1270, where the 61.8% Fibonacci retracement and the red declining resistance line are.
Will we see further improvement? Let’s take a closer look at the weekly chart and find out what can we infer from it.
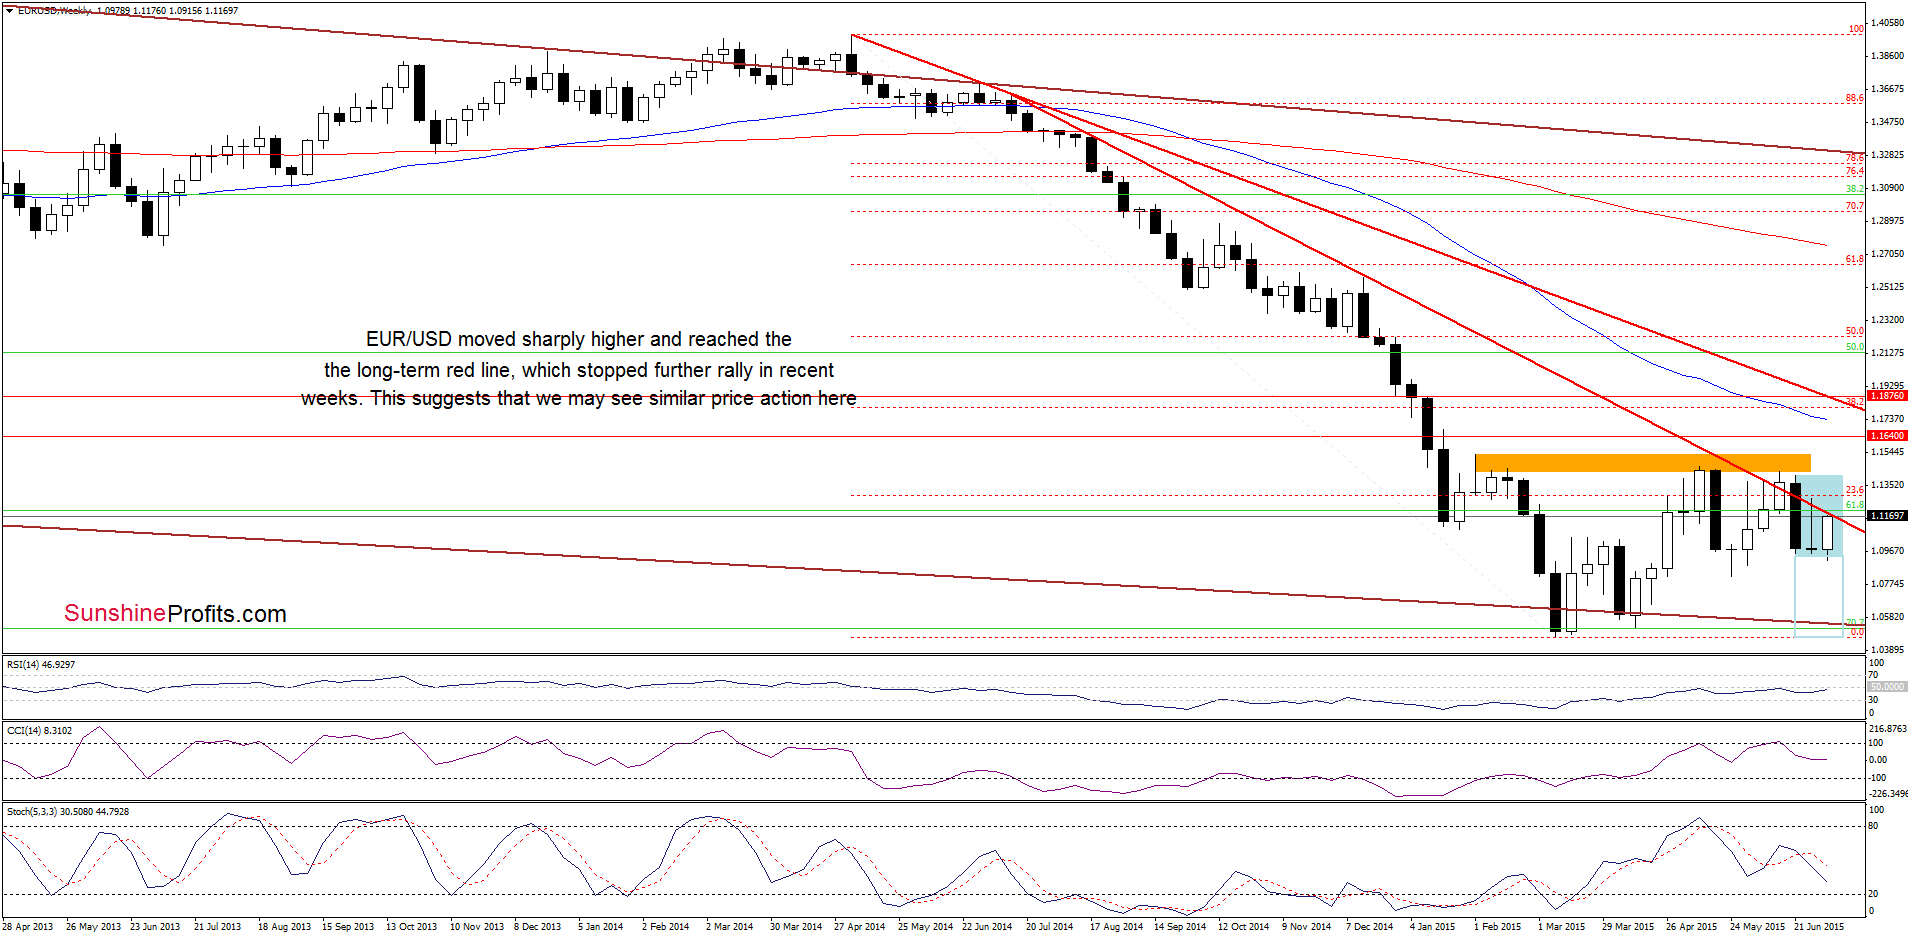
From this perspective we see that although EUR/USD moved sharply higher, the exchange rate is still trading in the consolidation under the previously-broken long-term red declining line and the 23.6% Fibonacci retracement. Therefore, in our opinion, as long as there is no successful breakout above this resistance zone, further rally is not likely to be seen and another pullback should not surprise us.
Very short-term outlook: mixed
Short-term outlook: mixed
MT outlook: mixed
LT outlook: mixed
Trading position (short-term; our opinion): No positions are justified from the risk/reward perspective at the moment. We will keep you informed should anything change, or should we see a confirmation/invalidation of the above.
GBP/USD
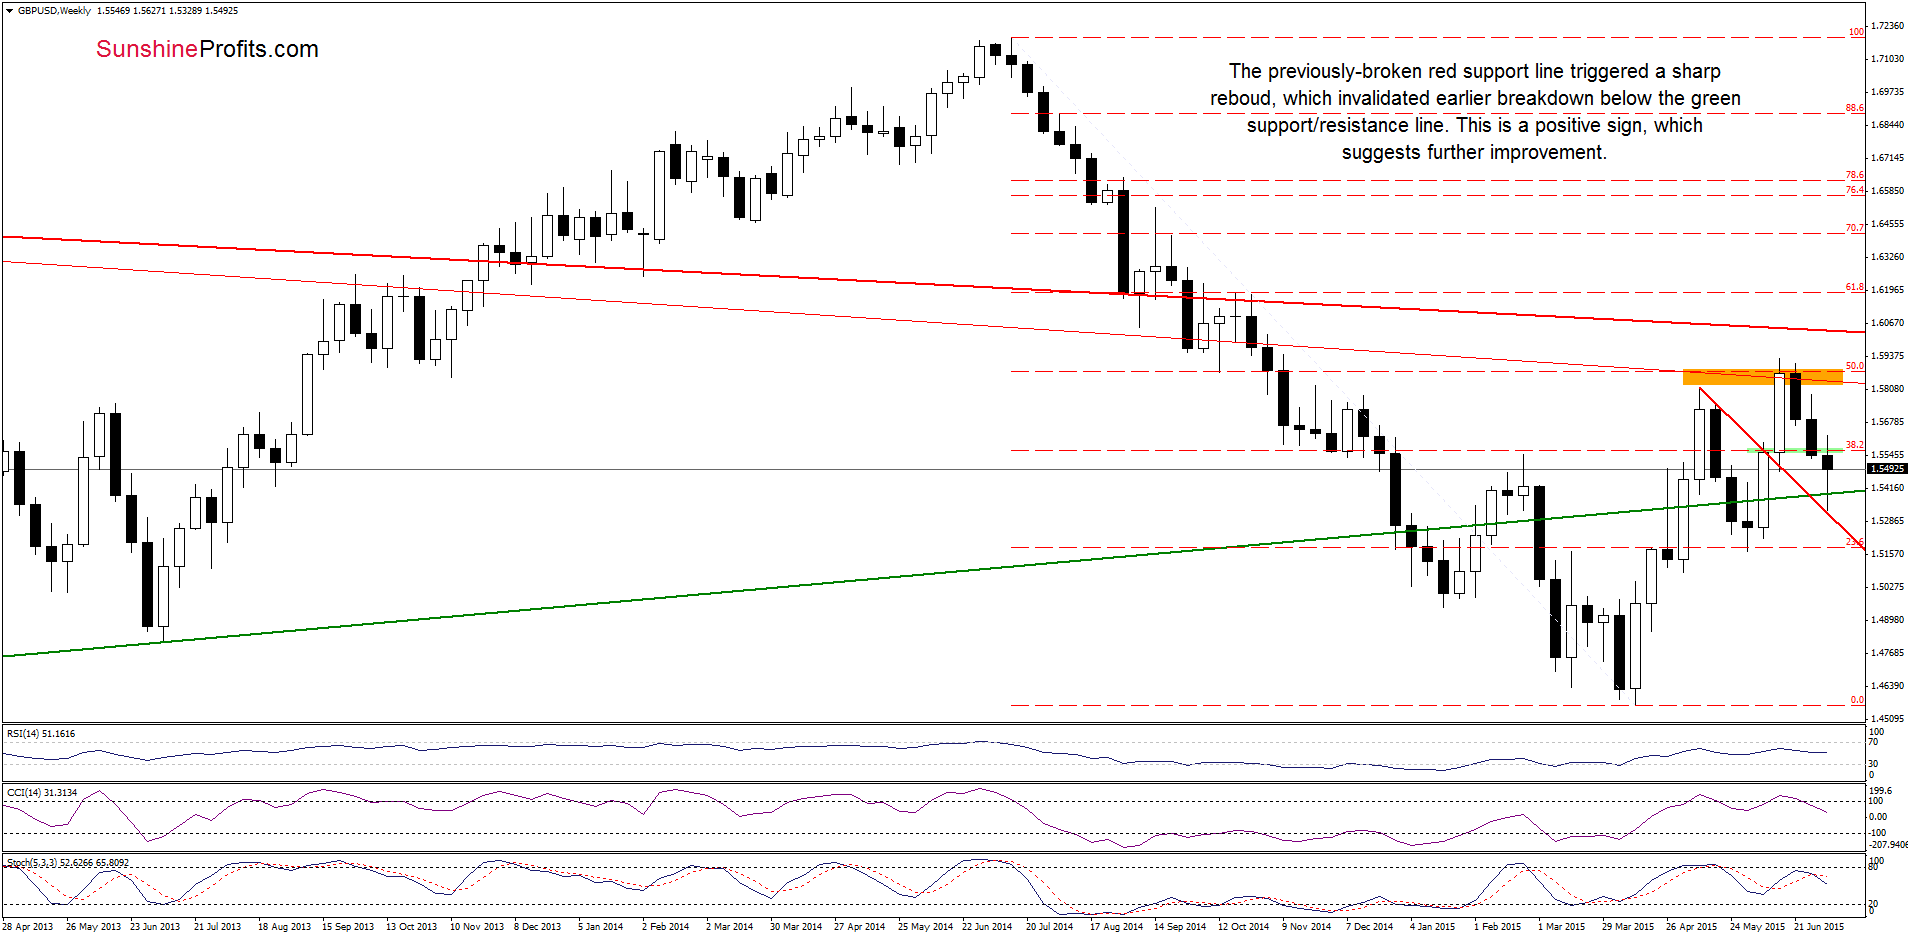
On the weekly chart, we see that the previously-broken red support line triggered a sharp rebound, which resulted in an invalidation of the breakdown below the long-term green support/resistance line.
How did this move affect the very short-term picture? Let’s take a closer look at the daily chart and find out.
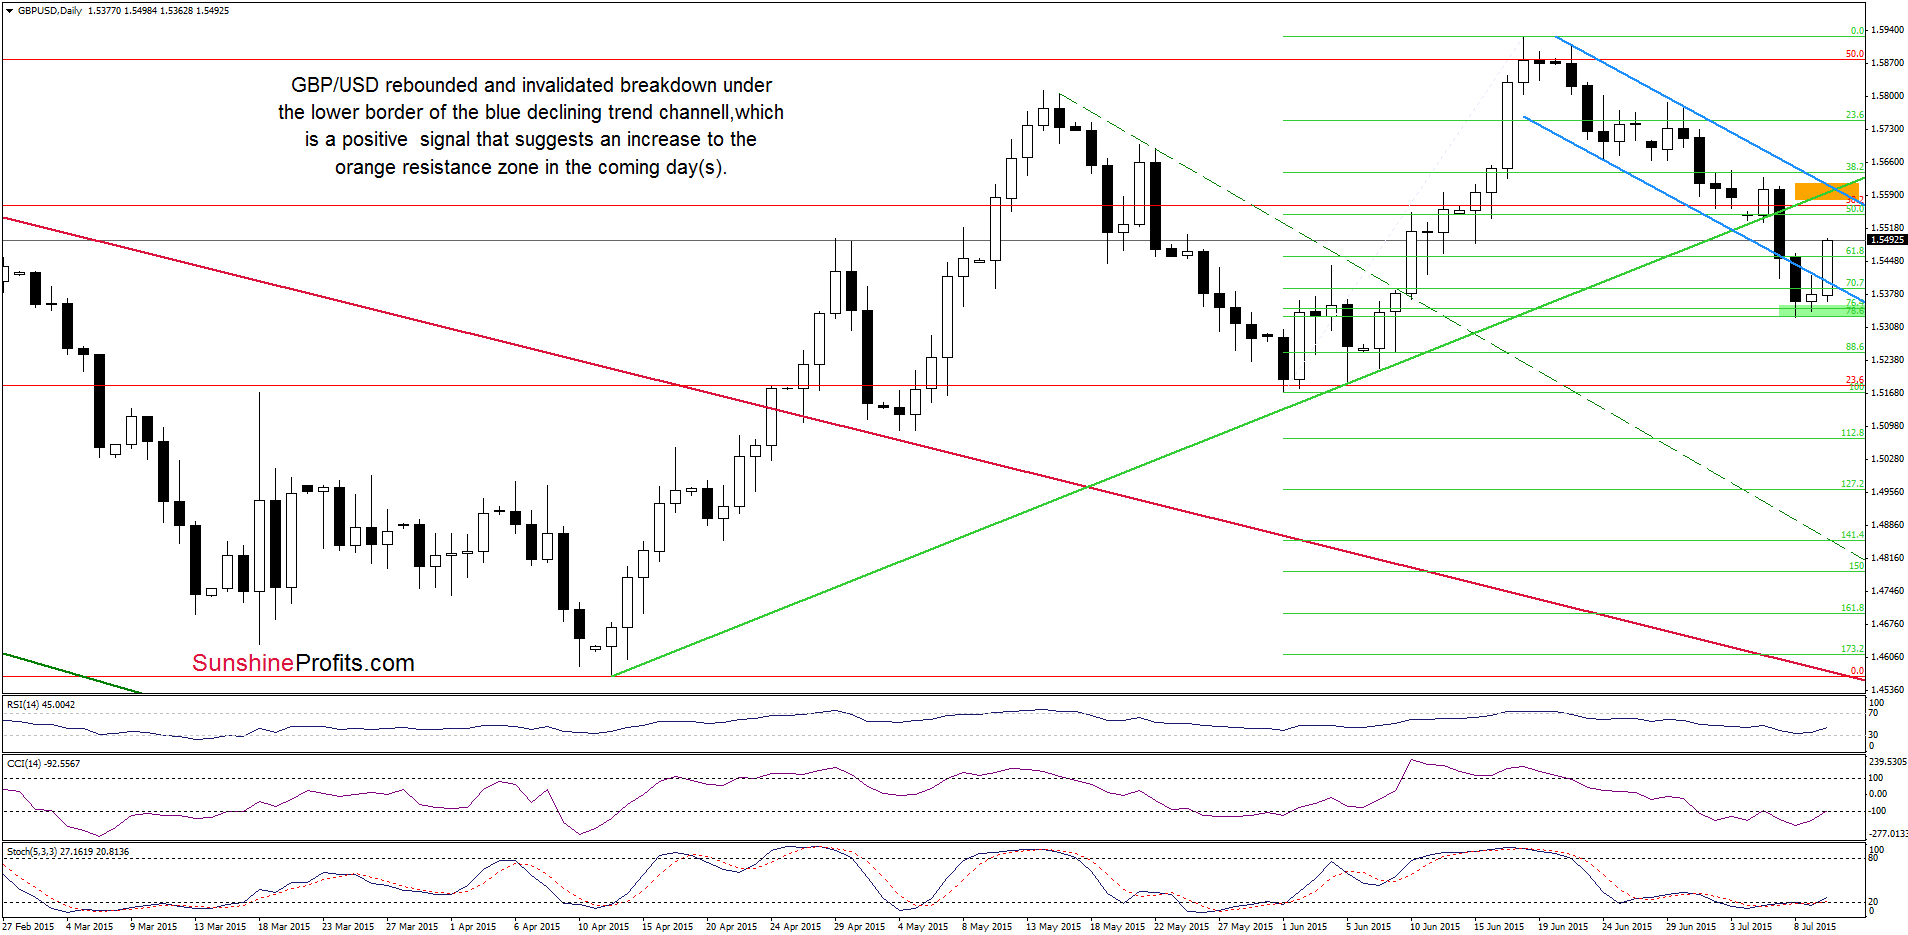
Looking at the daily chart, we see that the green support zone (created by the 76.4% and 78.6% Fibonacci retracement levels) triggered a sharp rebound earlier today. With this upswing, the exchange rate invalidated earlier breakdown under the lower border of the blue declining trend channel, which is a positive signal that suggests further improvement. How high could the pair go? In our opinion, the initial upside target would be around 1.5593-1.5613, where the medium-term green line (which serves as resistance now) and the upper line of the trend channel are.
Very short-term outlook: bullish
Short-term outlook: mixed
MT outlook: mixed
LT outlook: mixed
Trading position (short-term; our opinion): No positions are justified from the risk/reward perspective at the moment. We will keep you informed should anything change, or should we see a confirmation/invalidation of the above.
USD/JPY
In our last commentary on this currency pair, we wrote the following:
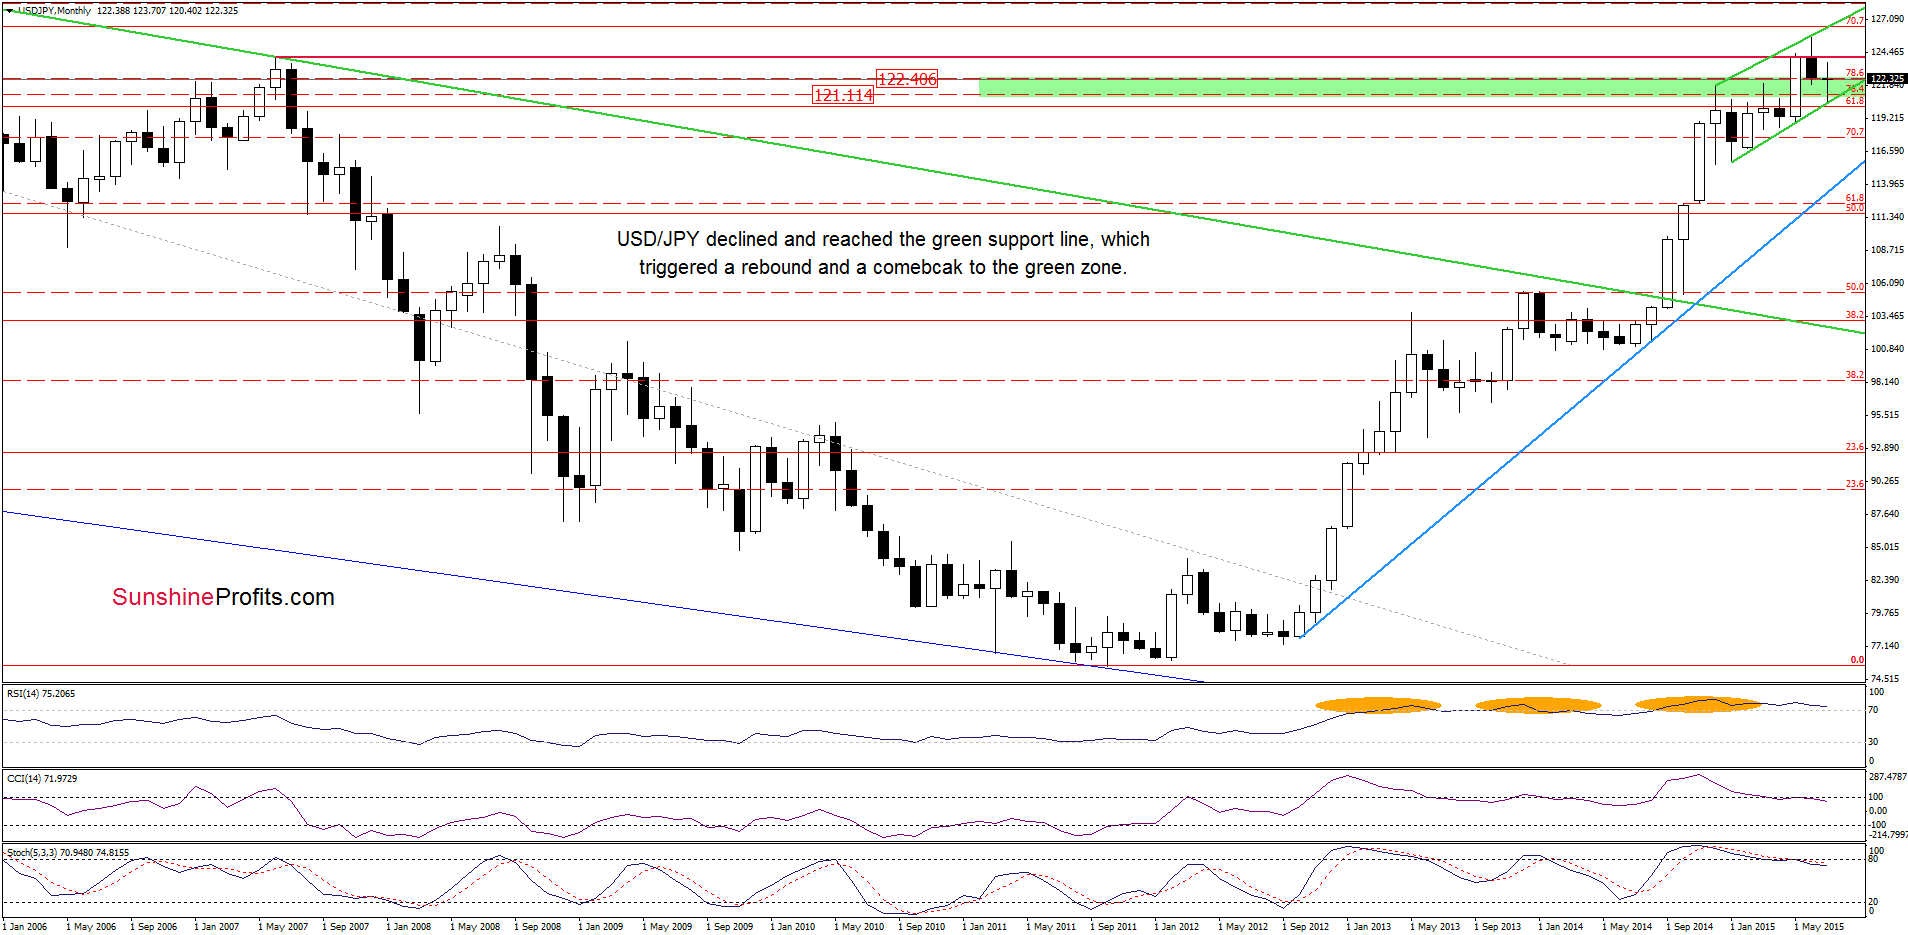
(…) the lower border of the green support zone (121.11) and the medium-term green support line (around 120.31) (…) could pause (or even stop) further deterioration
From today’s point of view we see that the situation developed in line with the above scenario and USD/JPY reversed and rebounded after a drop to our downside target.
What impact did this move have on the very short-term chart? Let’s check.
On Wednesday, we wrote:
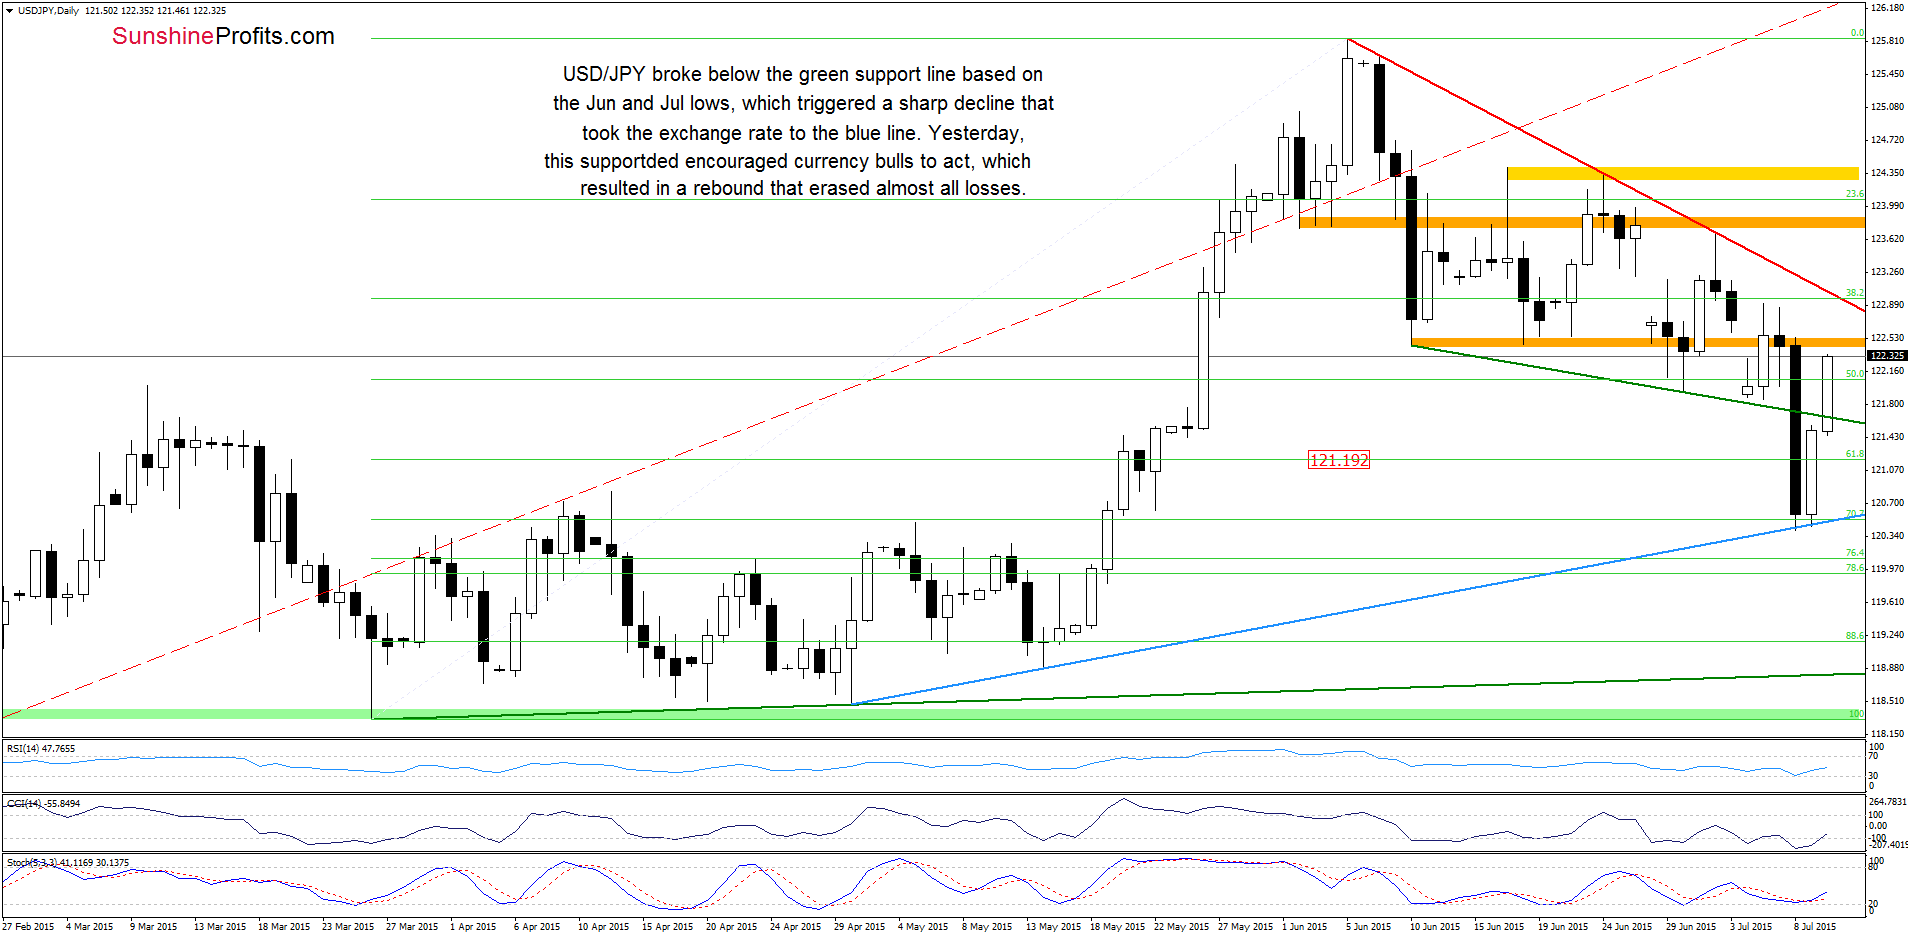
(…) the pair slipped to the green support line based on the Jun and Jul lows. (…) if it is broken, the next downside target would be around 121.19, where the 61.8% Fibonacci retracement (based on the entire Mar-May rally) is.
As you see on the daily chart, currency bears not only took USD/JPY to our downside target, but also managed to push it to the medium-term blue support line, which triggered a sharp rebound yesterday. Earlier today, the exchange rate extended rally and invalidated the breakdown under the green support line based on the Jun and Jul lows. Taking this fact into account, and combining it with buy signals generated by the daily indicators, we think that currency bulls will try to push the pair higher. If this is the case, and the exchange rate breaks above the orange resistance zone, the next target would be the red declining resistance line, which stopped the rally in the previous week.
Very short-term outlook: mixed with bullish bias
Short-term outlook: mixed
MT outlook: mixed
LT outlook: bullish
Trading position (short-term; our opinion): No positions are justified from the risk/reward perspective at the moment. We will keep you informed should anything change, or should we see a confirmation/invalidation of the above.
USD/CAD
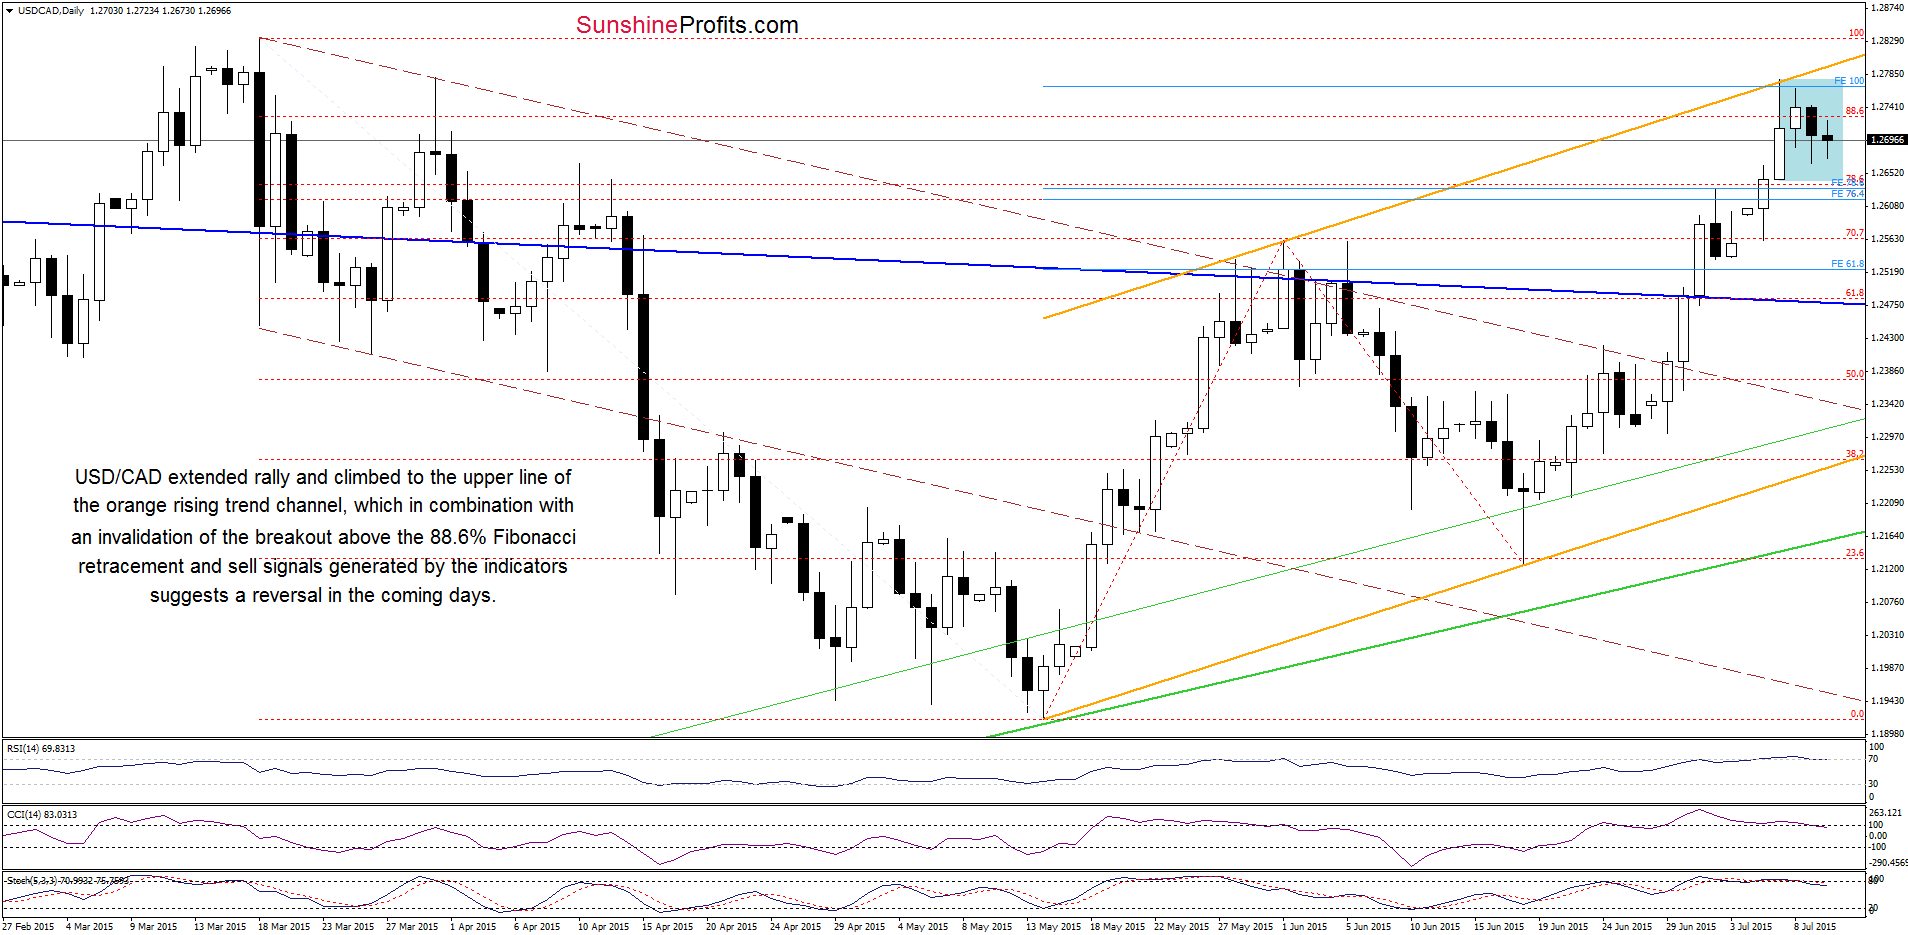
In the recent days, USD/CAD extended rally and climbed to the upper line of the orange rising trend channel. Despite this improvement, the exchange rate is trading in a consolidation (marked with blue), which suggests that a breakout above the upper line of the formation (or a breakdown below the lower border) will indicate the direction of future moves. Where the pair head next? Taking into account the orange resistance line, sell signals generated by the indicators and an invalidation of the breakout above the 88.6% Fibonacci retracement level, we think that reversal and lower values of the exchange rate are just around the corner.
Are there any other factors that could encourage currency bears to act? Let’s examine the weekly chart and find out.
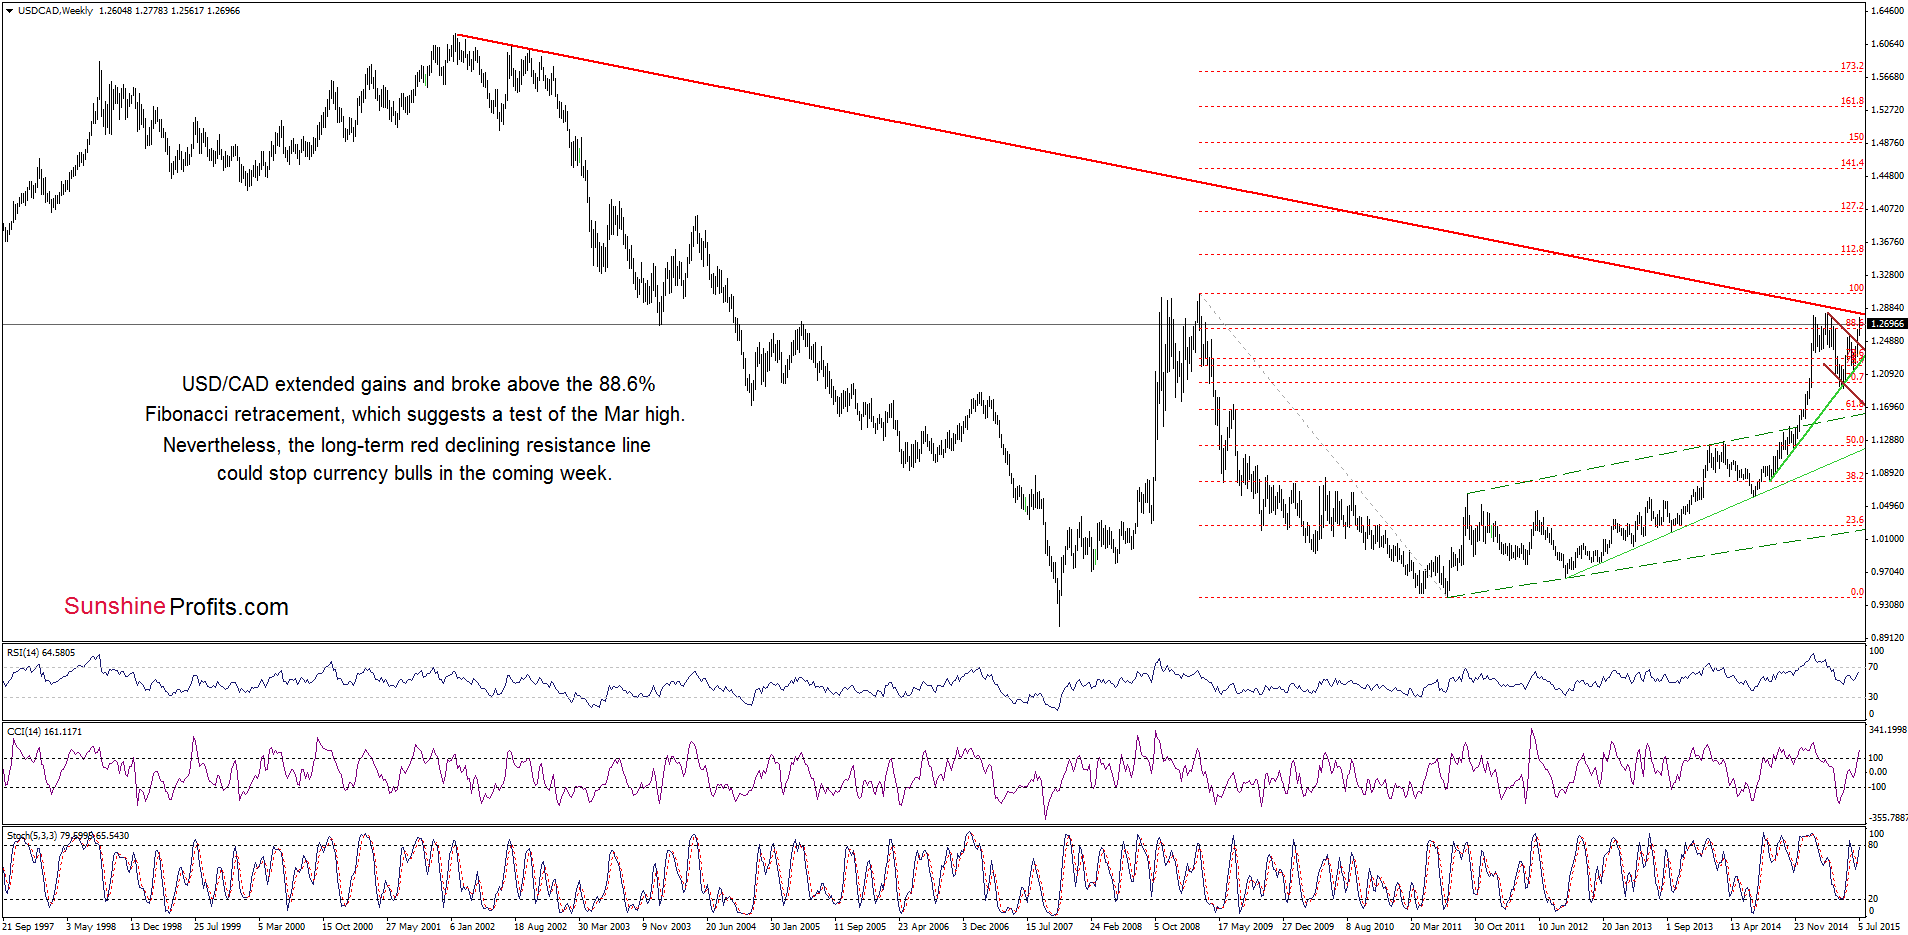
From this perspective, we see that although USD/CAD extended gains and broke above the 88.6% Fibonacci retracement (based on the Mar 2009-Jul 2011 decline), the exchange rate re-approached the long-term red declining resistance line. As a reminder, the proximity to this solid resistance encouraged currency bears to act in Mar, which resulted in a correction of earlier rally. Taking this fact into account, and combining it with the very short-term picture, we think that similar drop in the coming weeks should not surprise us. If this is the case, and USD/CAD reverses the initial downside target would be the previously-broken upper border of the brown declining trend channel (currently around 1.2440).
Very short-term outlook: mixed with bearish bias
Short-term outlook: mixed with bearish bias
MT outlook: mixed with bearish bias
LT outlook: mixed
Trading position (short-term; our opinion): No positions are justified from the risk/reward perspective at the moment. We will keep you informed should anything change, or should we see a confirmation/invalidation of the above.
USD/CHF
Quoting our yesterday’s alert:
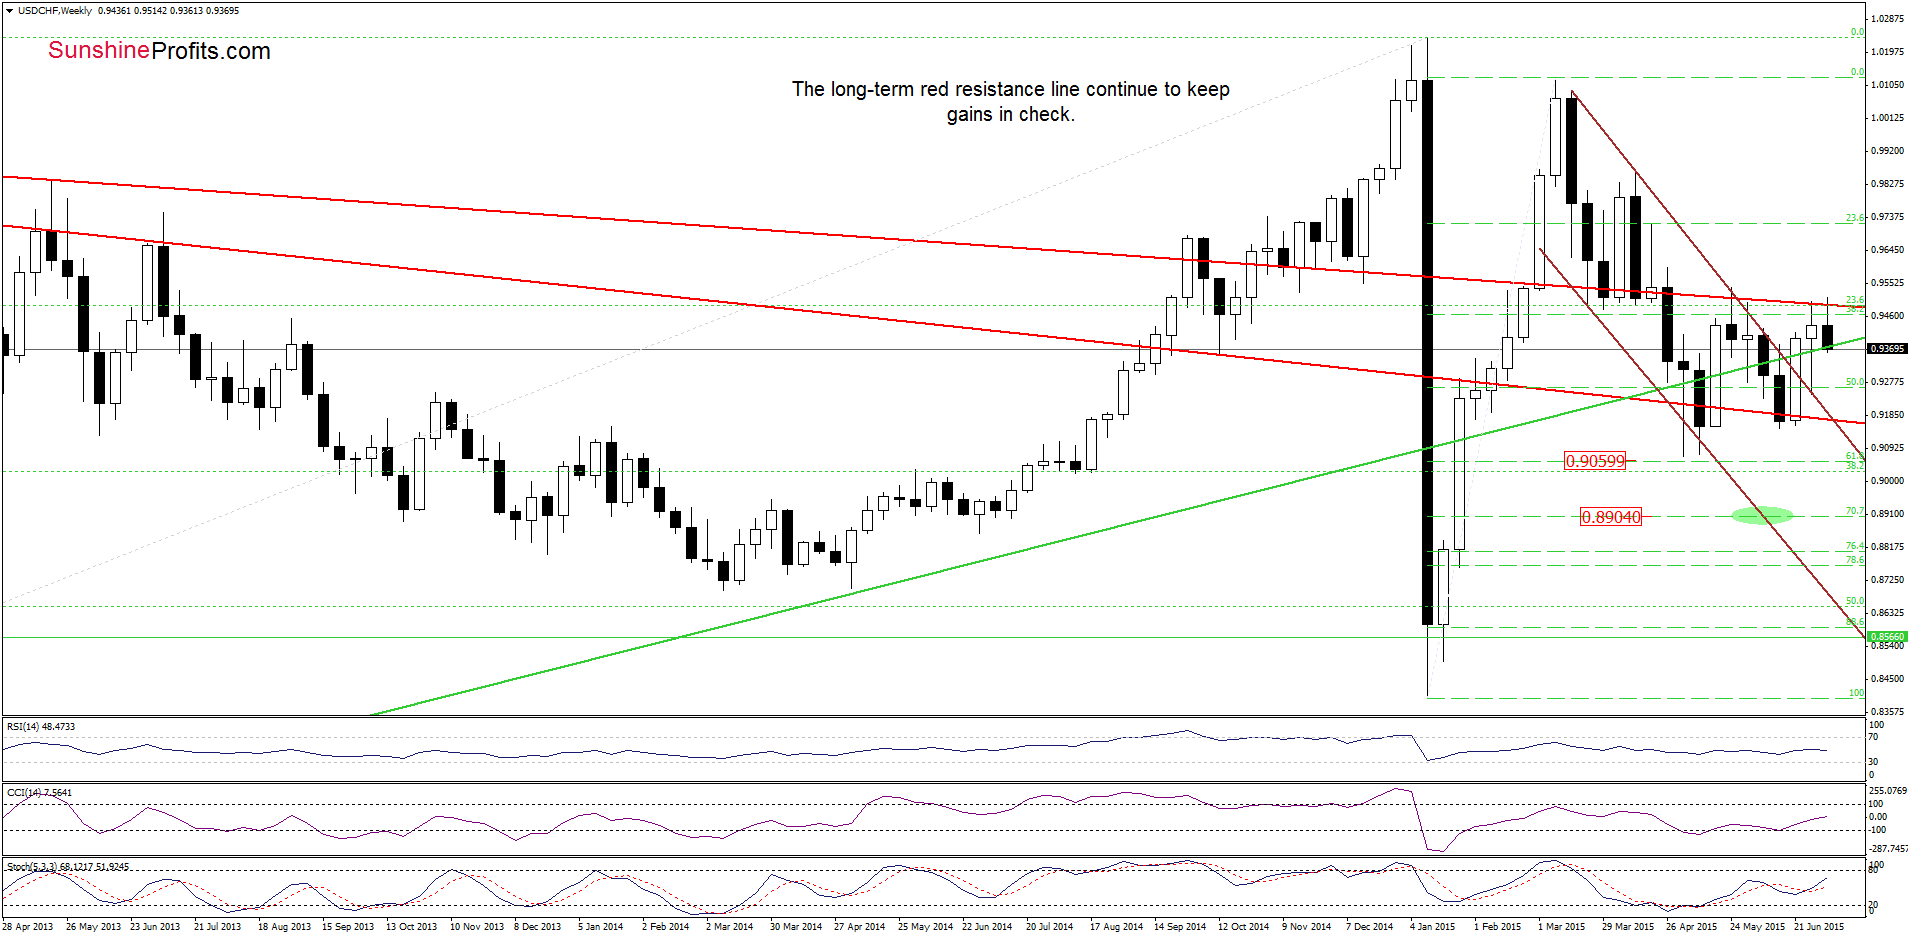
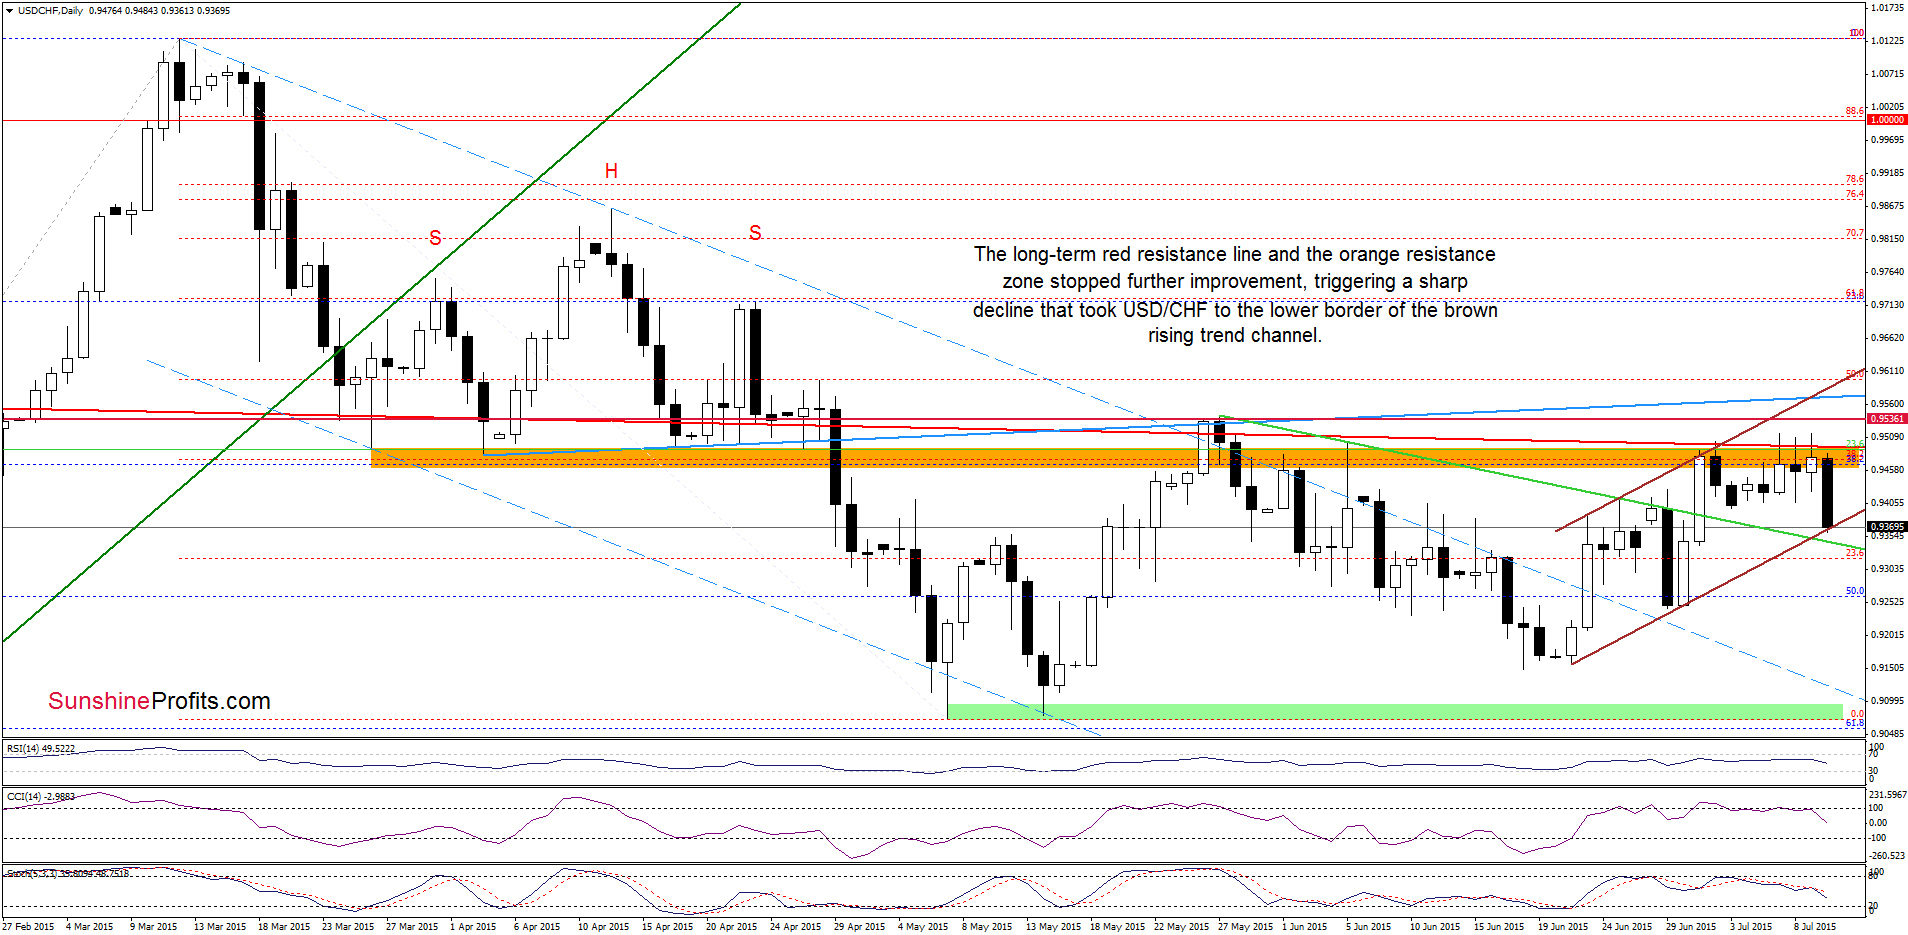
(…) the exchange rate climbed above the orange resistance zone and the long term red line once again, but we saw similar price actions in the recent days (although currency bulls tried to push USD/CHF above these levels, their all attempts failed). Therefore, in our opinion, this move will be more reliable if we see a daily close above this solid resistance area.
Looking at the above charts, we see that currency bulls failed once again and USD/CHF closed yesterday’s session under the resistance area, invalidating earlier small breakout above the long-term red line. This negative signal encouraged currency bears to act, which translated in a sharp decline earlier today. With this downward move, USD/CHF reached the lower border of the rising trend channel and the long-term green support line (marked on the weekly chart). Although the pair could rebound from here, it seems that sell signals generated by the indicators in combination with the long-term picture below will encourage currency bears to push the pair lower. Please note that if the pair drops under the lower border of the trend channel, we may see a decline to the Jun 29 low of 0.9243 or even to the Jun low, where the size of the downward move will correspond to the height of the formation.
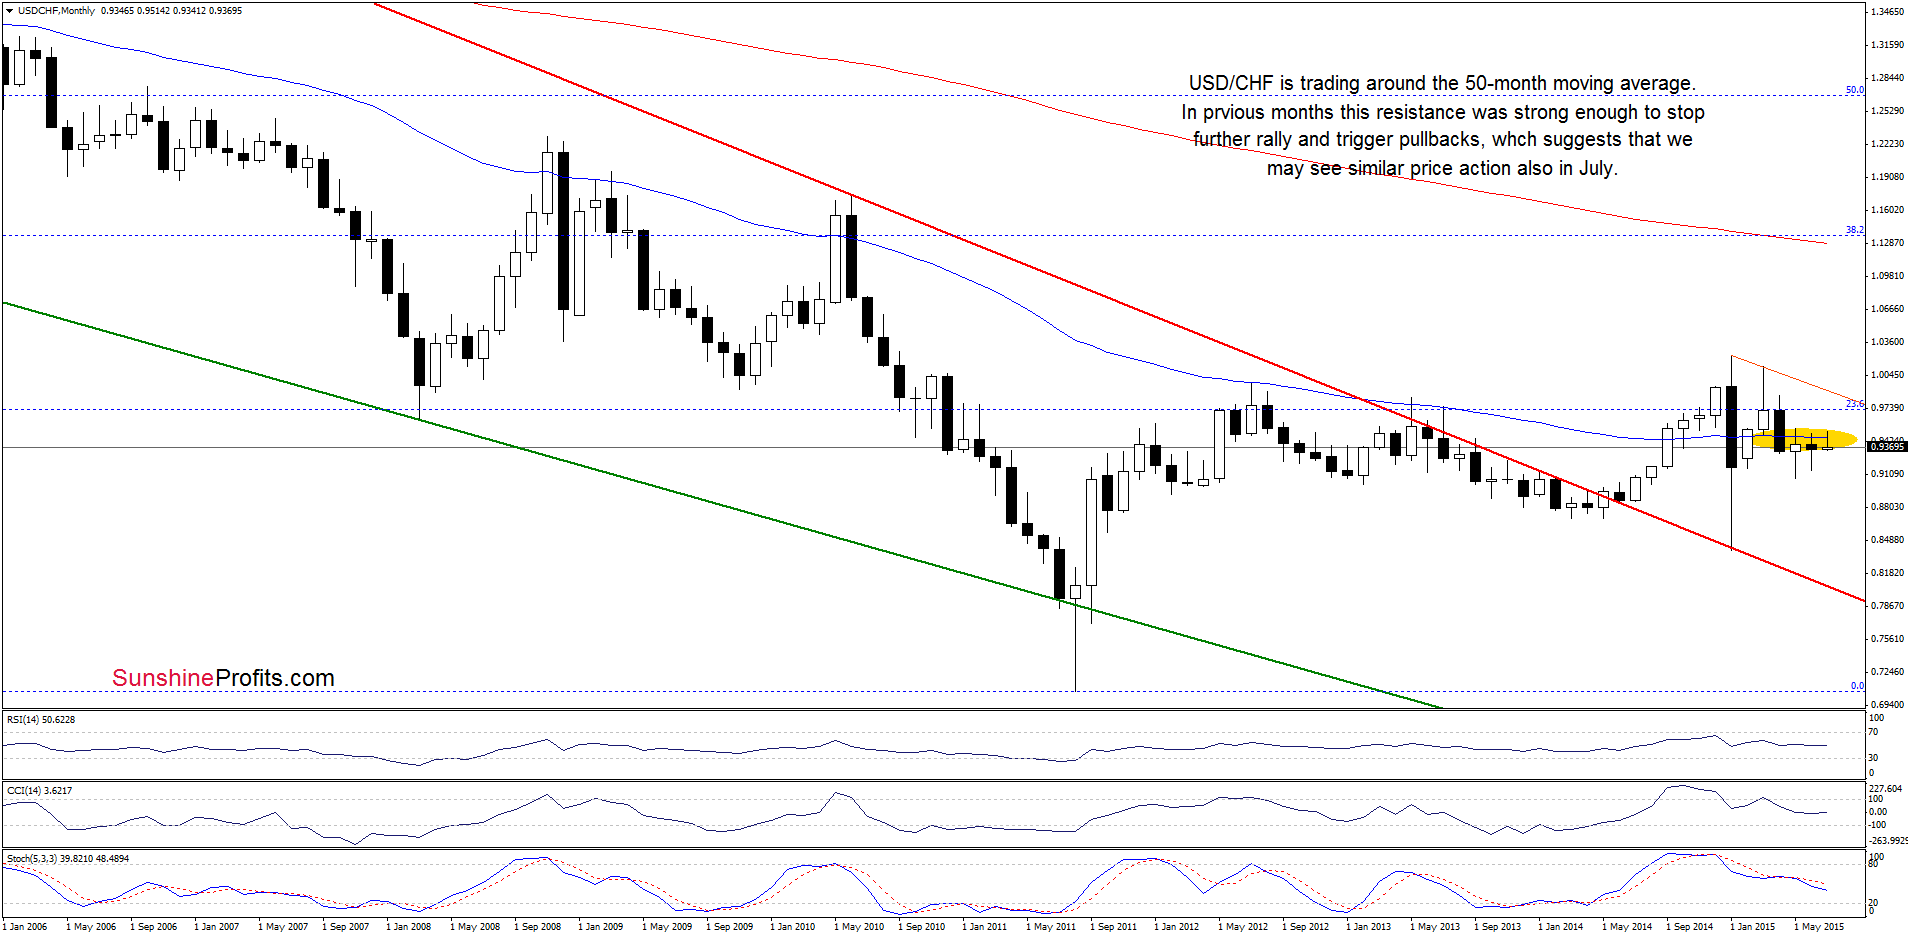
Yesterday, we wrote:
(…) USD/CHF is trading around the 50-month moving average, which was strong enough to stop further rally and trigger pullbacks in the previous months. Therefore, it seems to us that even if the exchange rate extends gains further rally will be more likely if we see a monthly close above this solid resistance.
Very short-term outlook: mixed
Short-term outlook: mixed
MT outlook: mixed
LT outlook: mixed
Trading position (short-term; our opinion): No positions are justified from the risk/reward perspective at the moment. We will keep you informed should anything change, or should we see a confirmation/invalidation of the above.
AUD/USD
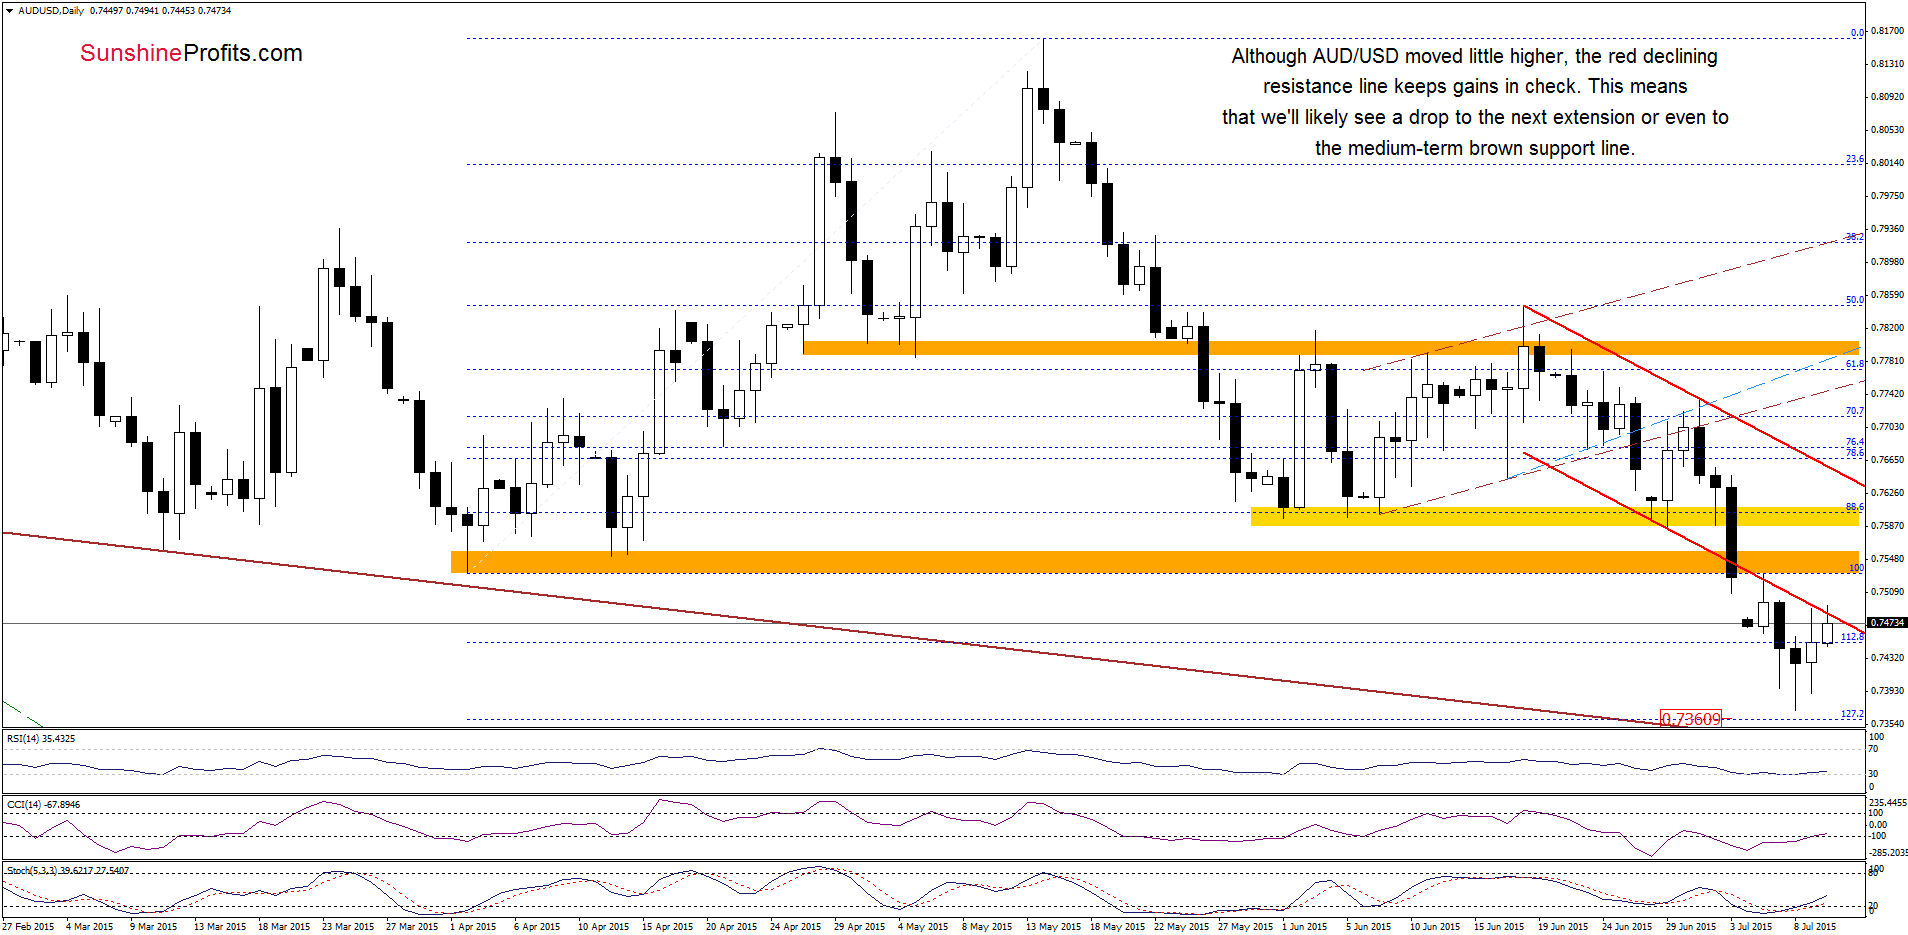
On the daily chart, we see that although AUD/USD moved little higher and invalidated earlier breakdown below the 112.8% Fibonacci extension, the pair remains under the previously-broken red declining resistance line (the lower border of the declining trend channel), which suggests that as long as there is no invalidation of the breakdown another pullback is likely. If this is the case, and the pair moves lower from here, it would be a bearish signal, which will likely result in a test of the recent low or even trigger a decline to the 127.2% extension in the coming day(s).
What could happen if these levels are broken? We think that the best answer to this question will be the quote from our Wednesday’s alert.
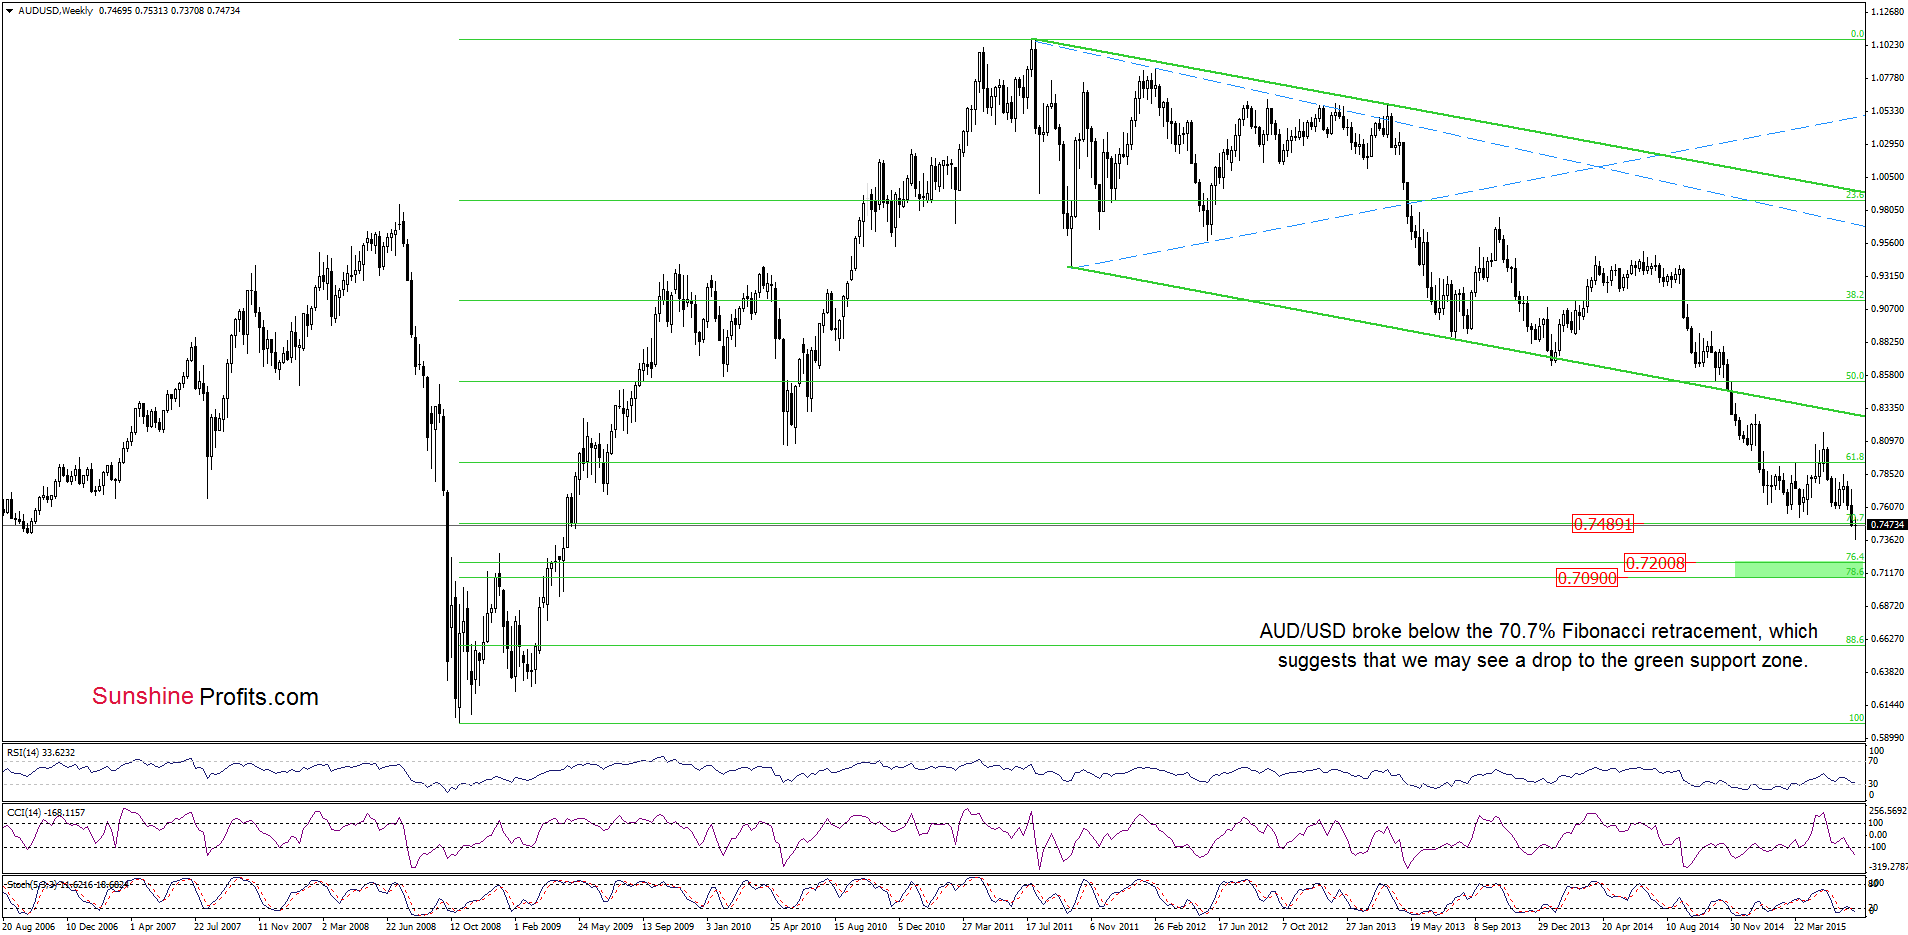
(…) AUD/USD broke below the 70.7% Fibonacci retracement, which suggests that if currency bulls fail around 0.7336-0.7360, we may see a decline even to the green support zone based on the 76.4% and 78.6% Fibonacci retracement levels (around 0.7097-0.7200) in the coming week(s).
Very short-term outlook: mixed with bearish bias
Short-term outlook: mixed
MT outlook: mixed
LT outlook: mixed
Trading position (short-term; our opinion): No positions are justified from the risk/reward perspective at the moment. We will keep you informed should anything change, or should we see a confirmation/invalidation of the above.
Thank you.
Nadia Simmons
Forex & Oil Trading Strategist
Forex Trading Alerts
Oil Investment Updates
Oil Trading Alerts

