

Yesterday, Greece requested a new three-year bailout from its euro zone creditors and pledged some economic overhauls, which supported the common currency and pushed it to the short-term resistance area. Did this upswing change anything in the overall picture of the exchange rate?
In our opinion the following forex trading positions are justified - summary:
EUR/USD
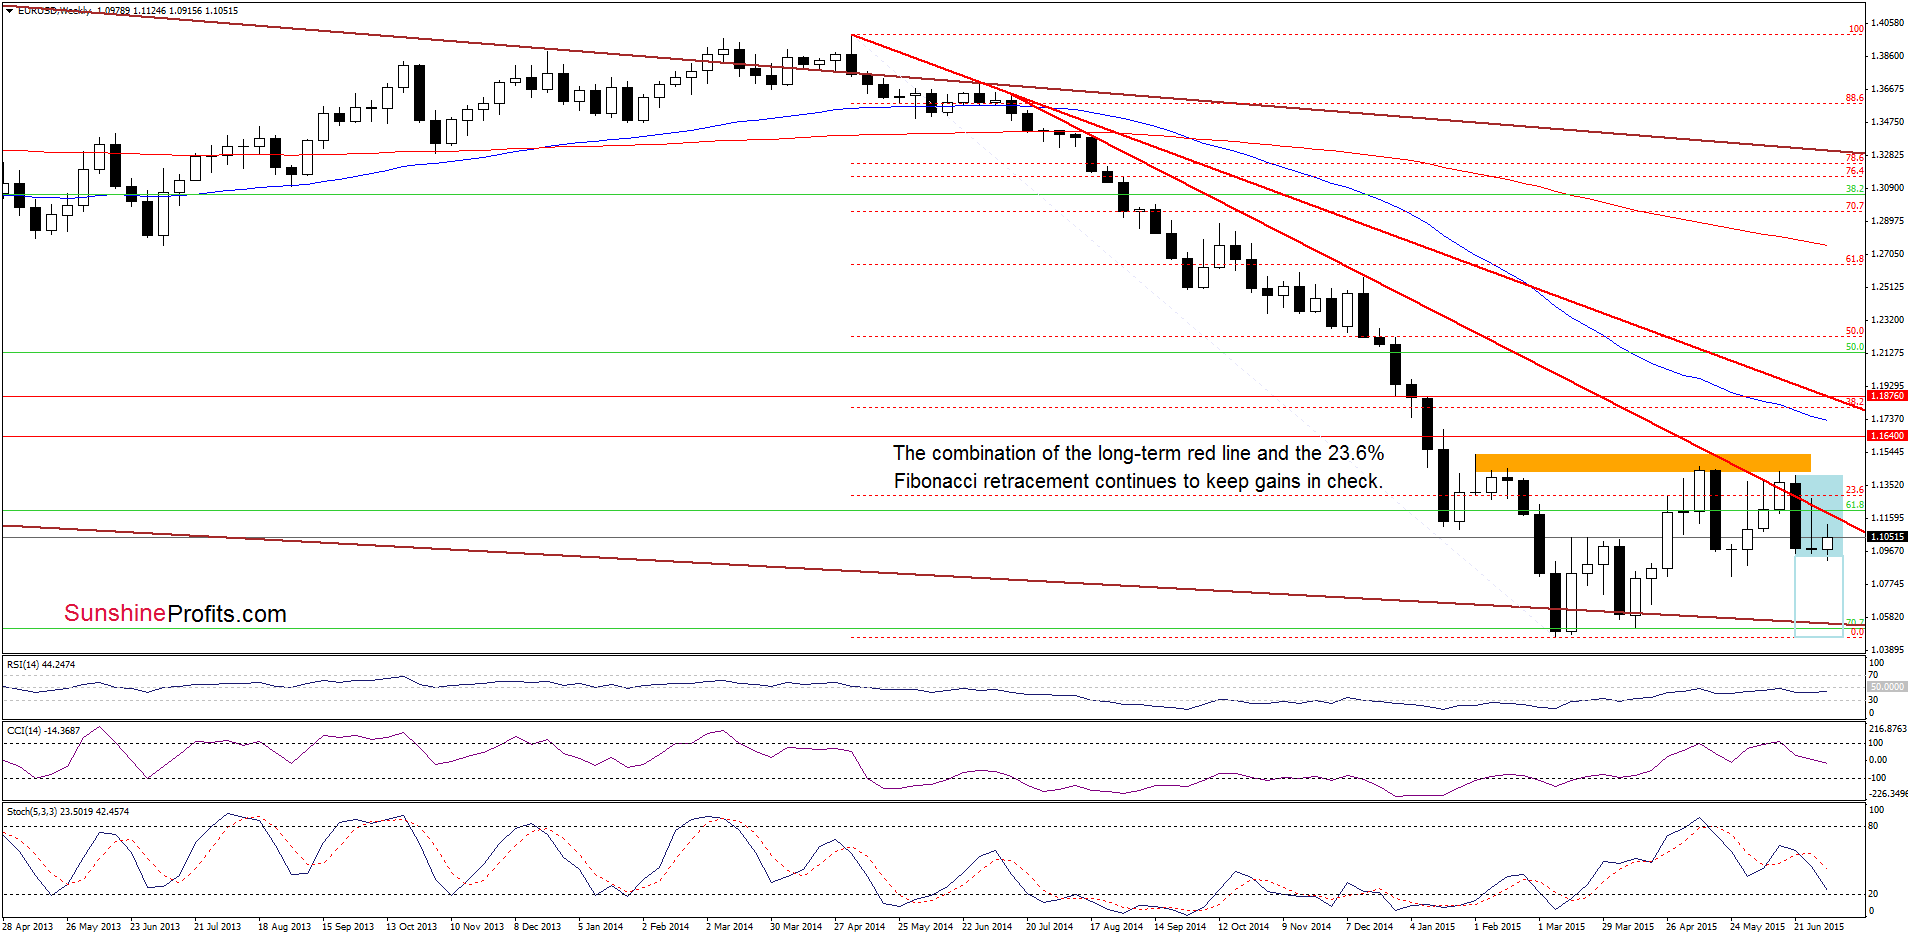
The situation in the medium term hasn’t changed much as EUR/USD is trading in the consolidation under the solid resistance - the previously-broken long-term red declining line and the 23.6% Fibonacci retracement. Therefore, we believe that as long as there is no successful breakout above them further rally is not likely to be seen and another pullback should not surprise us.
Having said that, let’s take a closer look at the daily chart.
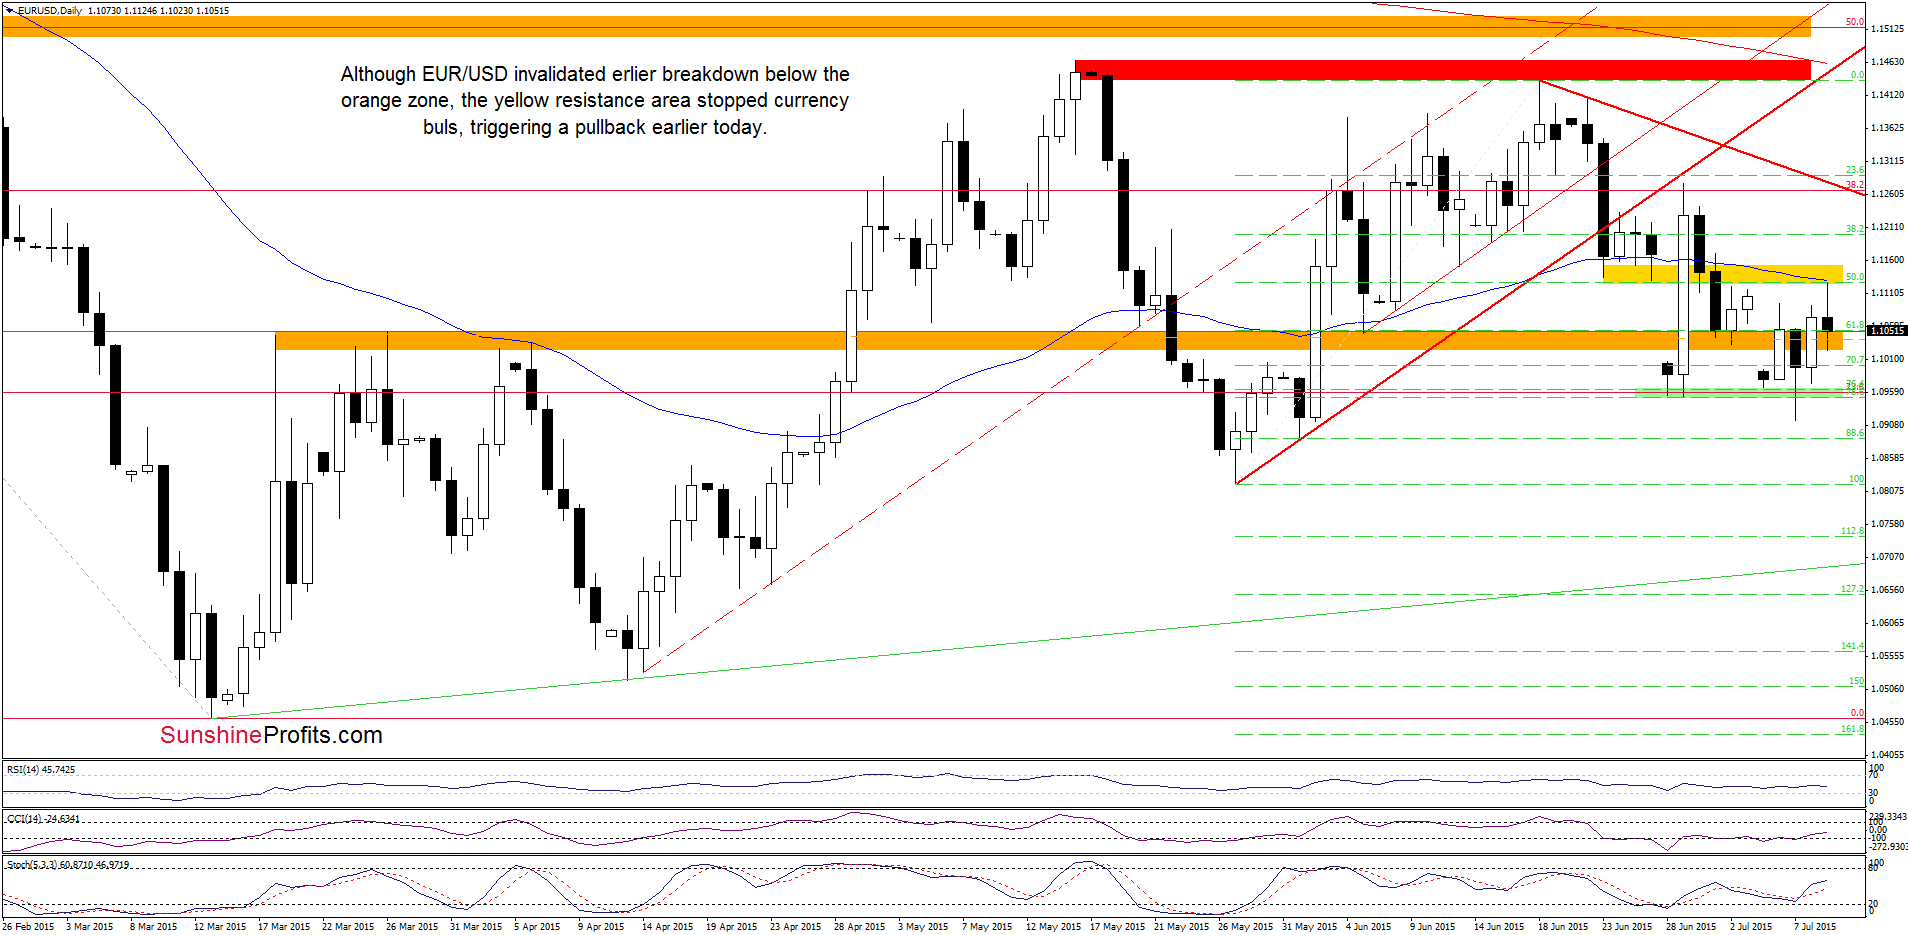
From this perspective, we see that EUR/USD moved higher and broke above the orange resistance zone yesterday. This positive sign triggered further improvement and resulted in a climb to the yellow resistance area. Despite this increase, currency bulls didn’t manage to push the pair higher (similarly to what we saw in the previous week), which translated to another pullback. Taking this fact into account, it seems that as long as there is no breakout above this zone (or a daily close under the green support area) bigger upward (or downward) move is not likely to be seen and short-lived moves in both directions should not surprise us.
Very short-term outlook: mixed
Short-term outlook: mixed
MT outlook: mixed
LT outlook: mixed
Trading position (short-term; our opinion): No positions are justified from the risk/reward perspective at the moment. We will keep you informed should anything change, or should we see a confirmation/invalidation of the above.
GBP/USD
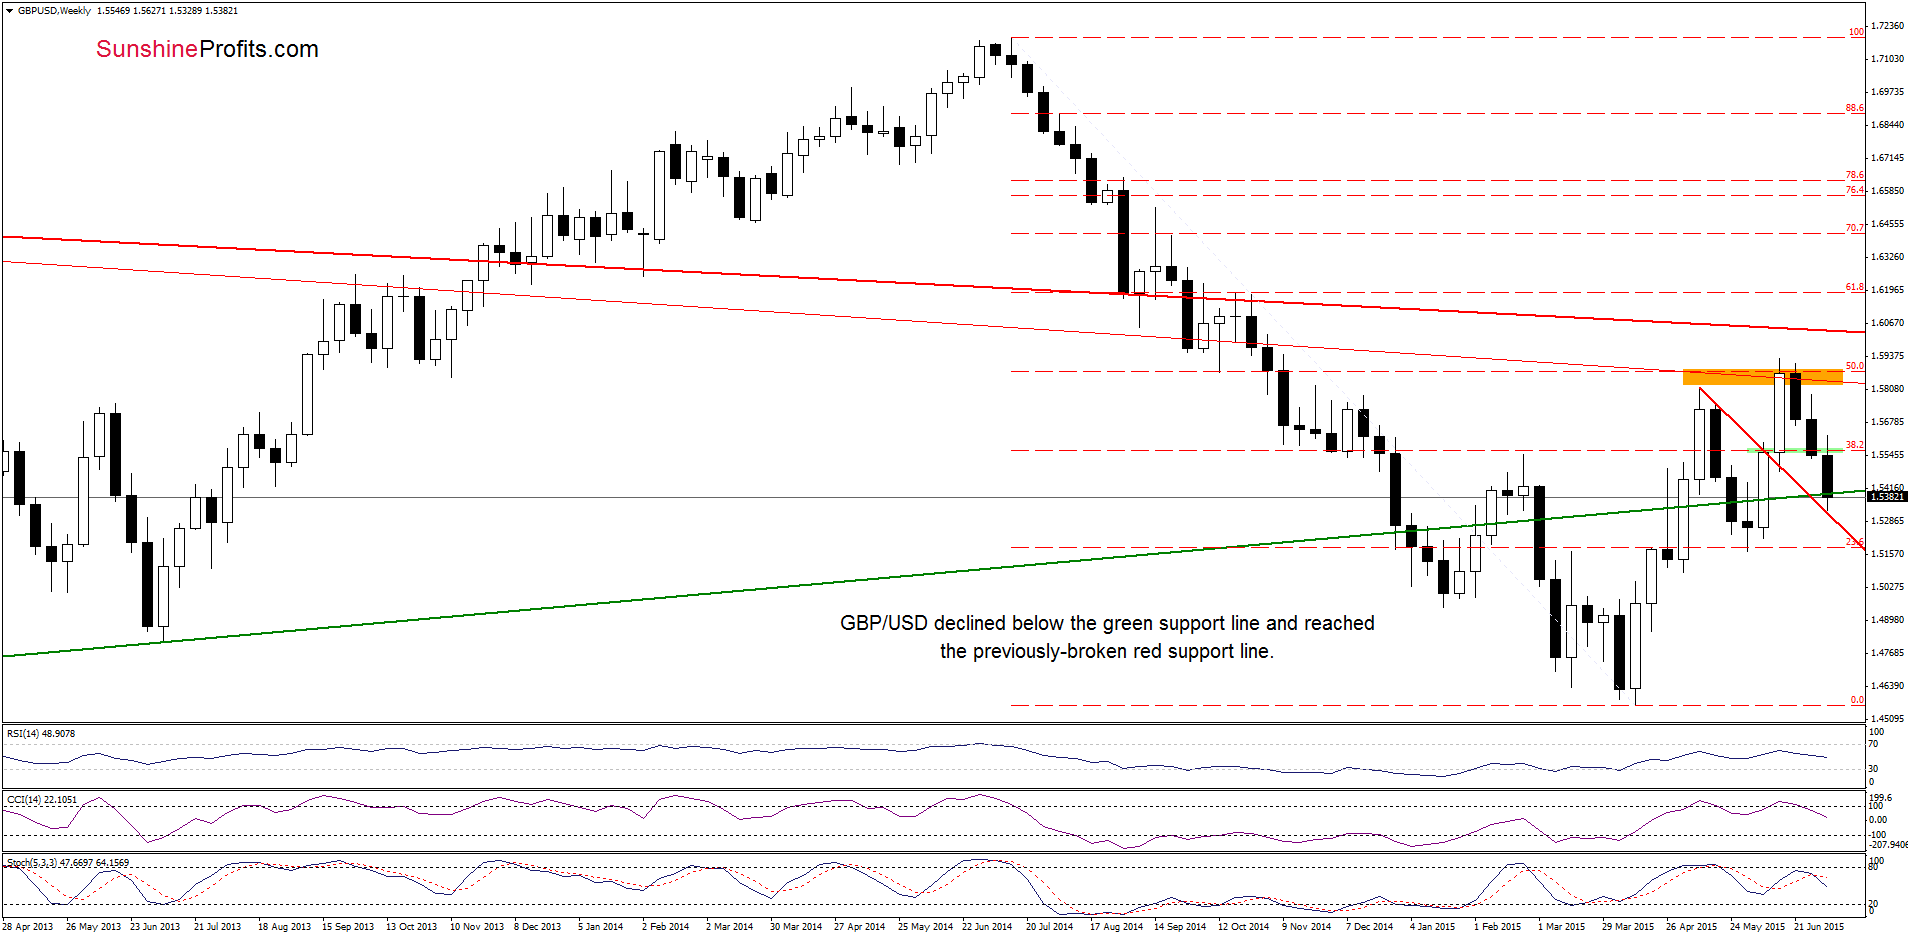
On the weekly chart, we see that GBP/USD extended losses and declined below the long-term green support line, reaching the previously-broken red line. Although this support triggered a rebound, we think that as long as there is no invalidation of the breakdown under the green line further improvement is questionable.
How did this move affect the very short-term picture? Let’s take a closer look at the daily chart and find out.
Quoting our last commentary on this currency pair:
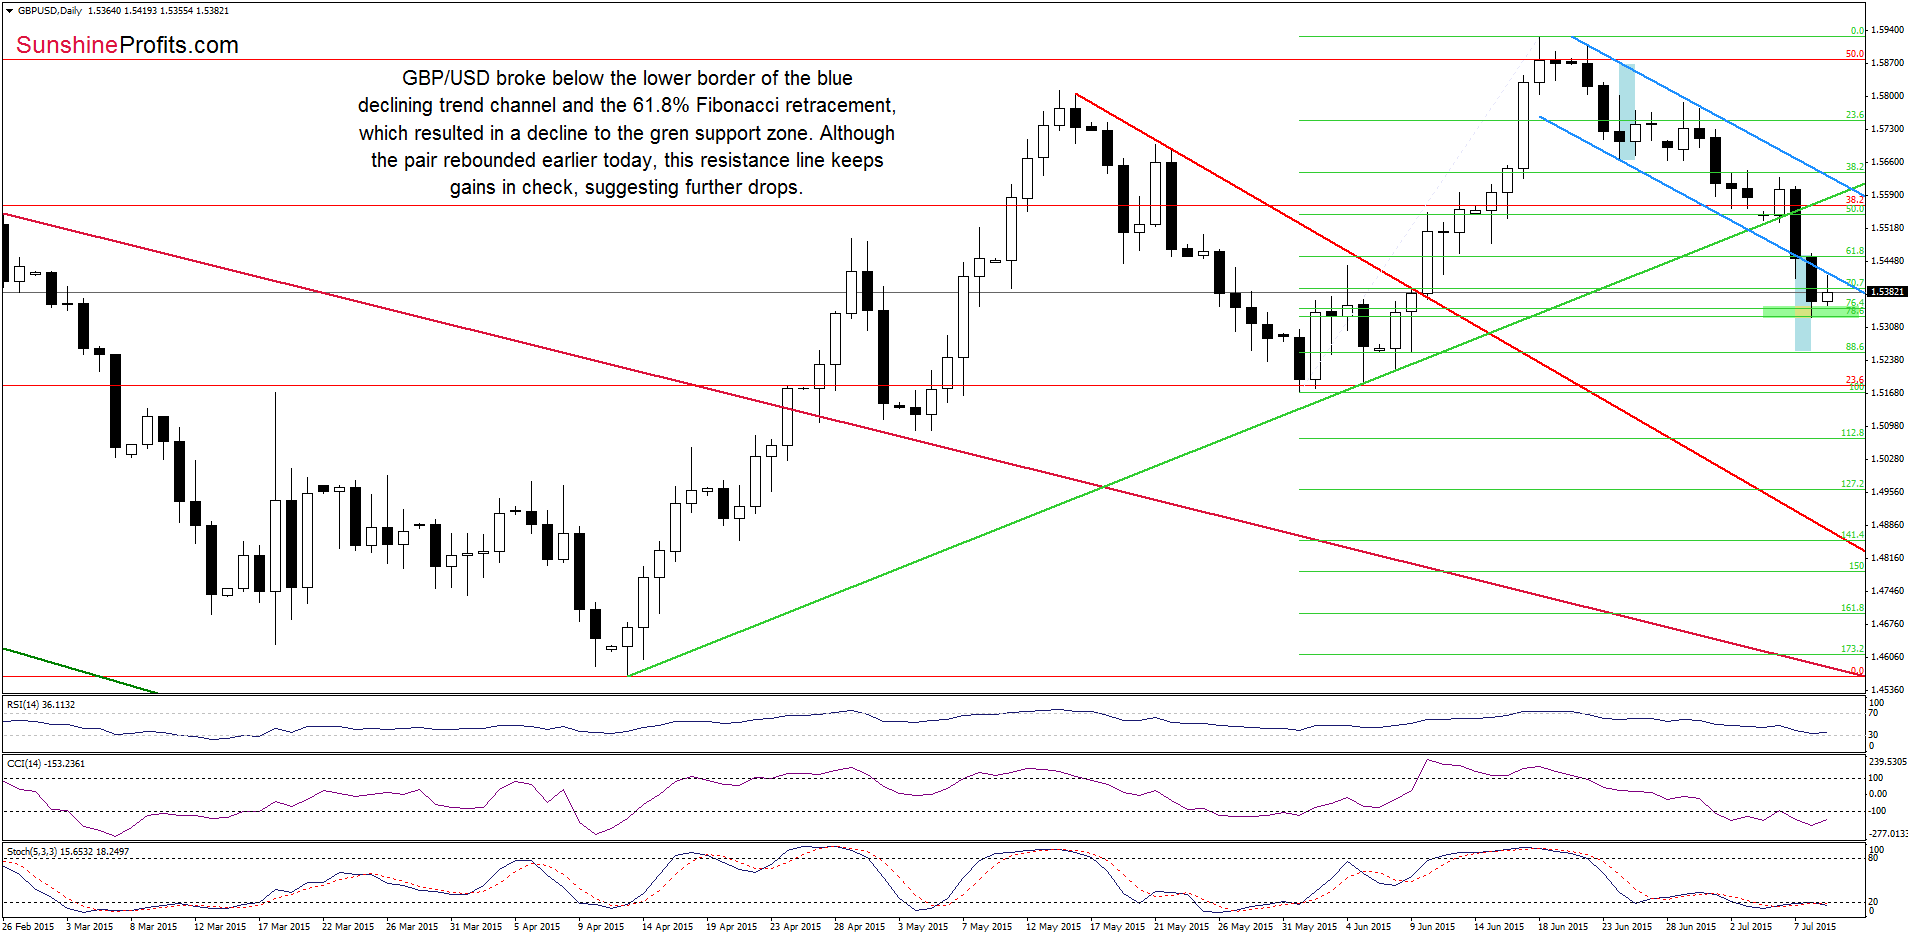
(…) the exchange rate broke below the medium-term green support line, which triggered a drop below the lower border of the blue declining trend channel and the 61.8% Fibonacci retracement (based on the June rally). Taking these negative signals into account, we think that further deterioration is more likely than not.
Looking at the daily chart, we see that the situation developed in line with the above scenario and GBP/USD extended losses yesterday. With this downswing the pair reached the green support zone (created by the 76.4% and 78.6% Fibonacci retracement levels), which triggered a rebound earlier today. Despite this move, the blue resistance line continues to keep gains in check, which suggests that this upswing could be nothing more than a verification of earlier breakdown. If this is the case, and GBP/USD moves lower from here, it would be a bearish signal, which will likely translate to lower values of the exchange rate. How low could the pair go? Taking into account a breakdown below the lower border of the declining trend channel, we could see a decline even to around 1.5258, where the size of the downward move will correspond to the height of the channel and where the 88.6% Fibonacci retracement is.
Very short-term outlook: mixed with bearish bias
Short-term outlook: mixed
MT outlook: mixed
LT outlook: mixed
Trading position (short-term; our opinion): No positions are justified from the risk/reward perspective at the moment. We will keep you informed should anything change, or should we see a confirmation/invalidation of the above.
USD/CHF

Earlier today, the exchange rate climbed above the orange resistance zone and the long term red line once again, but we saw similar price actions in the recent days (although currency bulls tried to push USD/CHF above these levels, their all attempts failed). Therefore, in our opinion, this move will be more reliable if we see a daily close above this solid resistance area. If this is the case, and USD/CHF moves higher, we could see an increase to 0.9542 (the May high) or even to 0.9566, where the blue resistance line and the upper border of the rising brown trend channel are.
Finishing today’s commentary on this currency pair, we would like to draw your attention to the long-term chart.
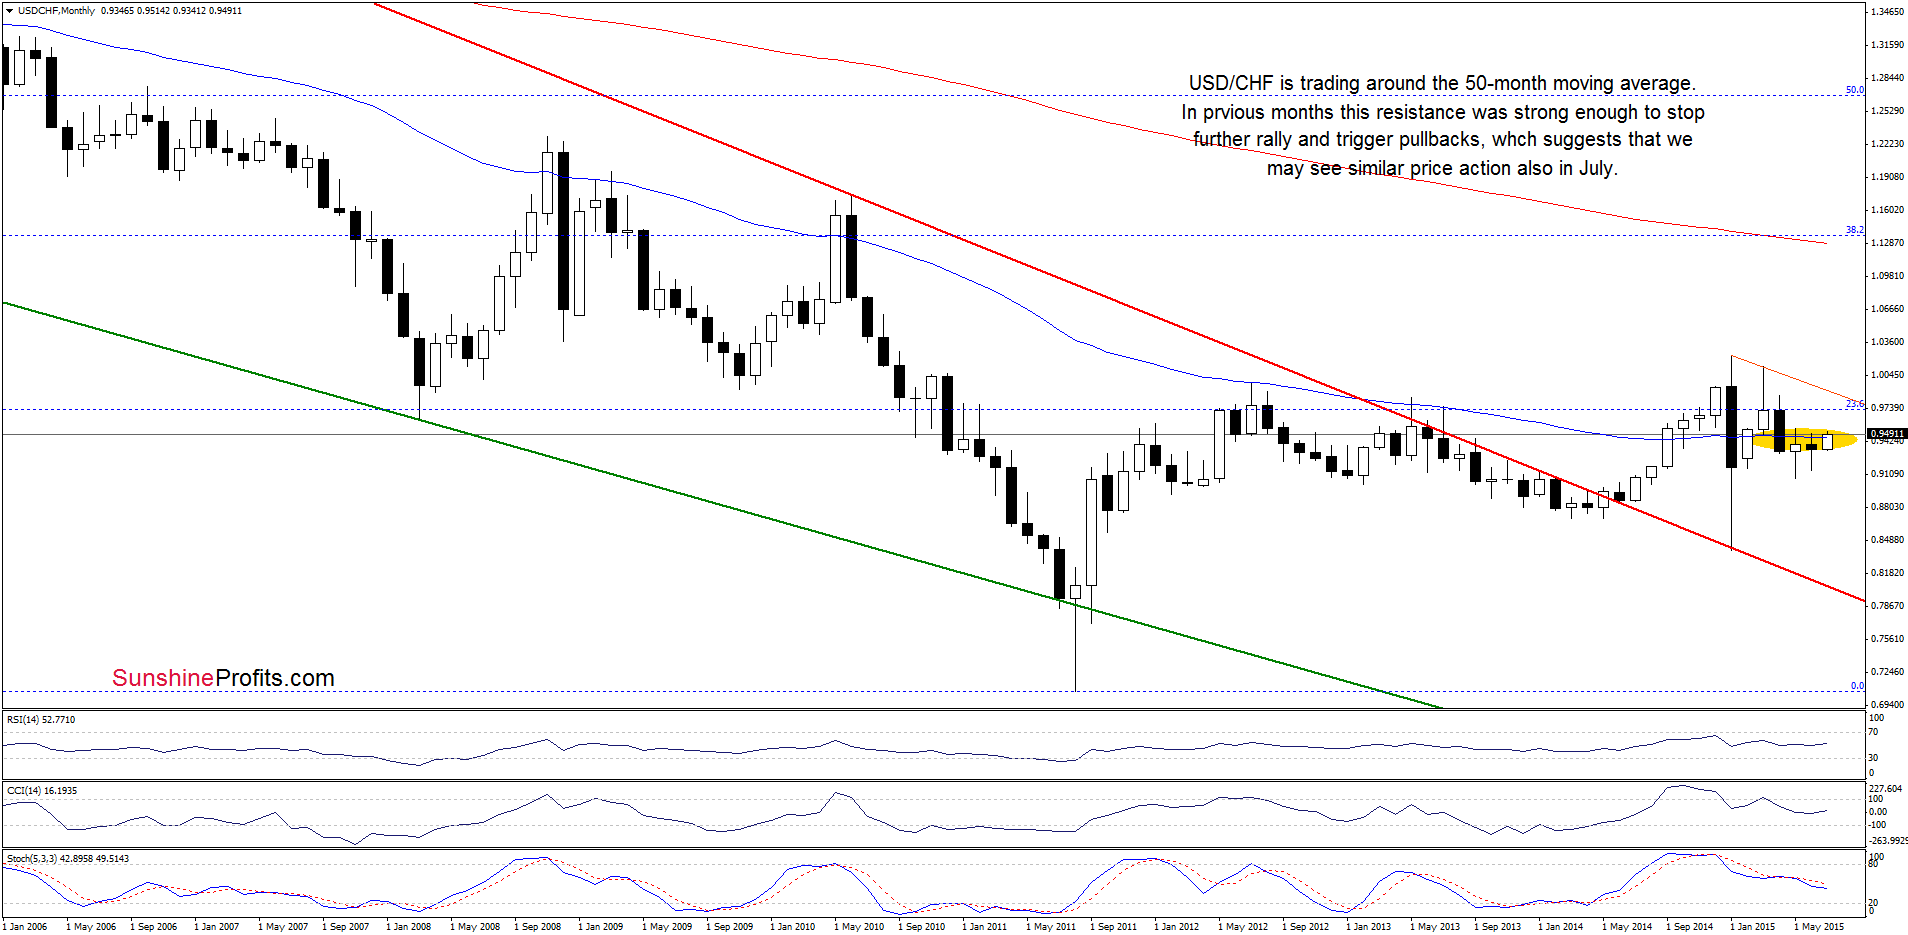
As you see on the above chart, USD/CHF is trading around the 50-month moving average, which was strong enough to stop further rally and trigger pullbacks in the previous months. Therefore, it seems to us that even if the exchange rate extends gains further rally will be more likely if we see a monthly close above this solid resistance.
Very short-term outlook: mixed
Short-term outlook: mixed
MT outlook: mixed
LT outlook: mixed
Trading position (short-term; our opinion): No positions are justified from the risk/reward perspective at the moment. We will keep you informed should anything change, or should we see a confirmation/invalidation of the above.
Thank you.
Nadia Simmons
Forex & Oil Trading Strategist
Forex Trading Alerts
Oil Investment Updates
Oil Trading Alerts

