

Yesterday, the U.S. Bureau of Economic Analysis showed that the trade deficit increased to $41.87 billion in May, beating analysts’ expectations. This positive report in combination with the uncertainty around the Greece’s future in the euro zone pushed the USD Index to a five-week high of 97.40. As a result, AUD/USD moved sharply lower, breaking below another short-term support. Will we see the exchange rate below 0.7370 in the coming days?
In our opinion the following forex trading positions are justified - summary:
EUR/USD
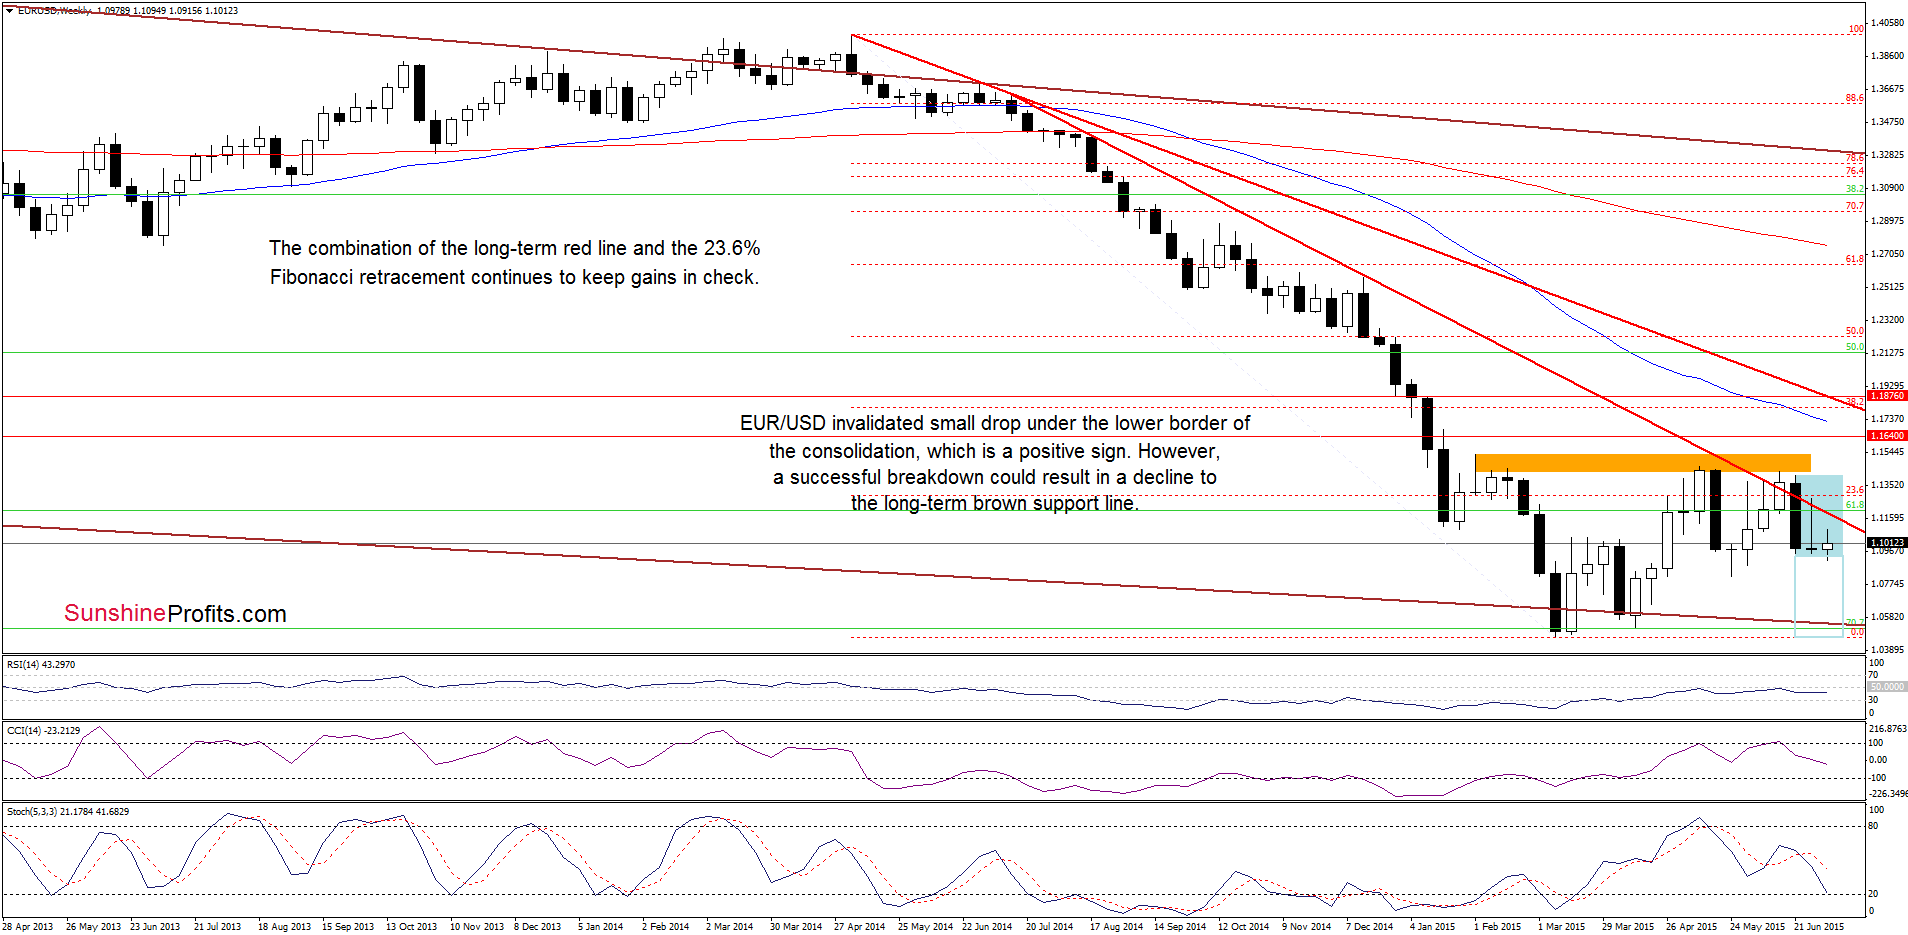
EUR/USD invalidated yesterday’s small drop under the lower border of the consolidation. Although this is a positive sign, which suggests further improvement, we should keep in mind that the exchange rate remains under the solid resistance - the previously-broken long-term red declining line and the 23.6% Fibonacci retracement. Therefore, we believe that as long as there is no successful breakout above them further rally is not likely to be seen and another pullback should not surprise us. Please note that if the pair breaks under the lower border of the formation (and we see a daily/weekly close below it), we may see a decline even to the long-term brown support line (currently around 1.0530) in the following days.
Having said that, let’s take a closer look at the daily chart.
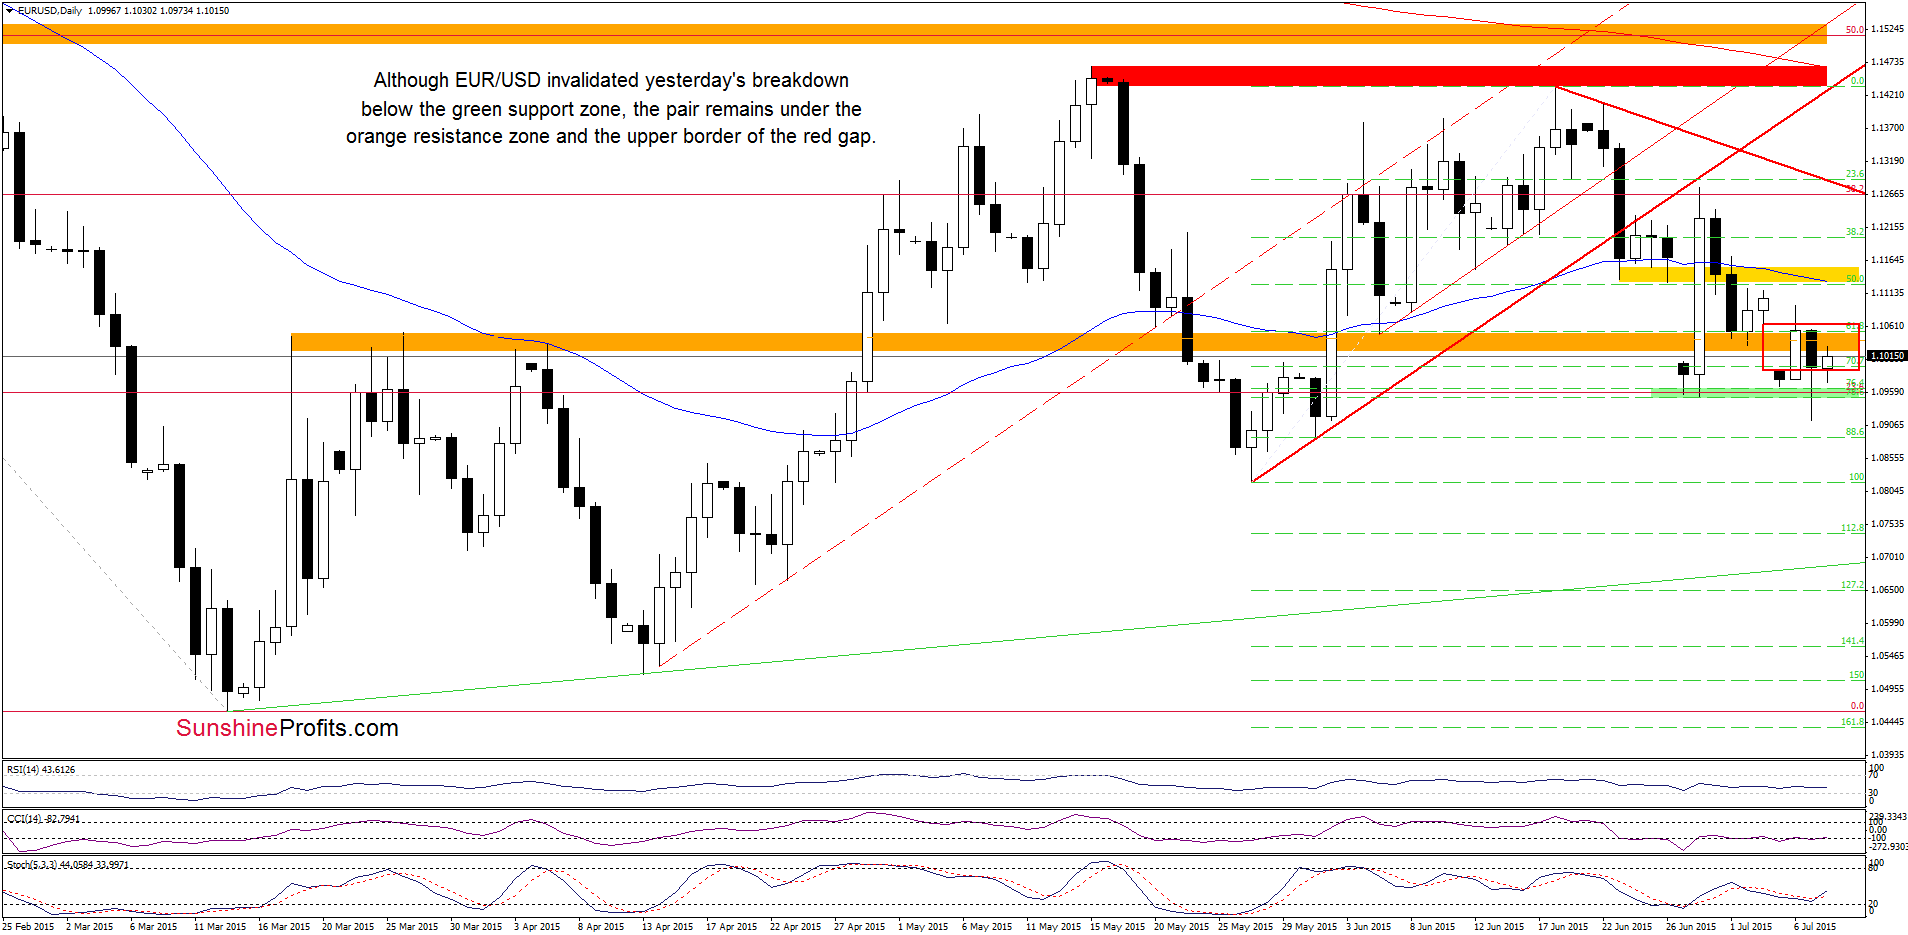
As you see on the daily chart, currency bears pushed EUR/USD under the green support zone created by the last week’s lows. Despite this drop, the exchange rate rebounded, invalidating earlier breakdown. Although this is a positive signal that suggests further improvement, EUR/USD is trading under the orange resistance zone and the upper border of the red gap, which keep gains in check. At this point, it is worth noting that currency bulls tried to close the gap, but they failed which resulted in yesterday’s decline. This suggests that as long as there is no daily close above it, further improvement is questionable.
Very short-term outlook: mixed with bearish bias
Short-term outlook: mixed
MT outlook: mixed
LT outlook: mixed
Trading position (short-term; our opinion): No positions are justified from the risk/reward perspective at the moment. We will keep you informed should anything change, or should we see a confirmation/invalidation of the above.
USD/JPY
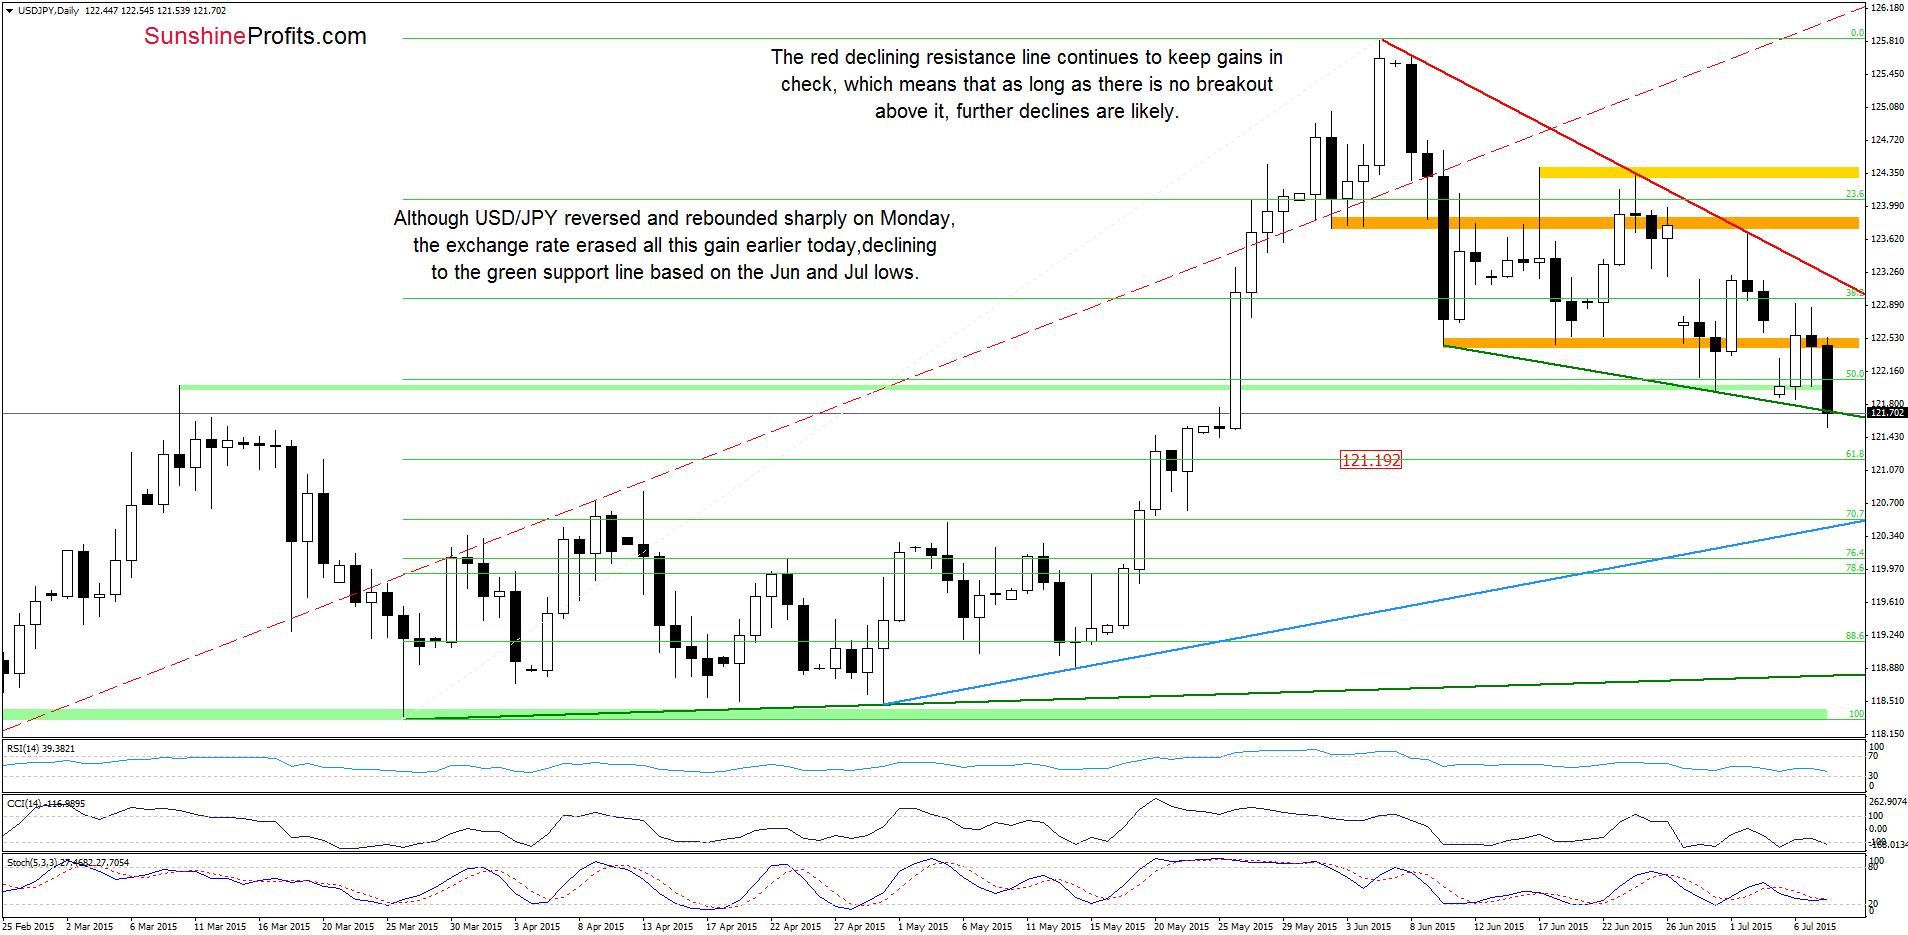
Looking at the daily chart we see that although USD/JPY rebounded on Monday, the exchange rate reversed and invalidated earlier breakout above the orange resistance zone. This negative signal encouraged currency bears to act and resulted in a sharp decline earlier today. With this downward move, the pair slipped to the green support line based on the Jun and Jul lows. If it withstands the selling pressure, we’ll likely see another attempt to come back above the orange area. However, if it is broken, the next downside target would be around 121.19, where the 61.8% Fibonacci retracement (based on the entire Mar-May rally) is.
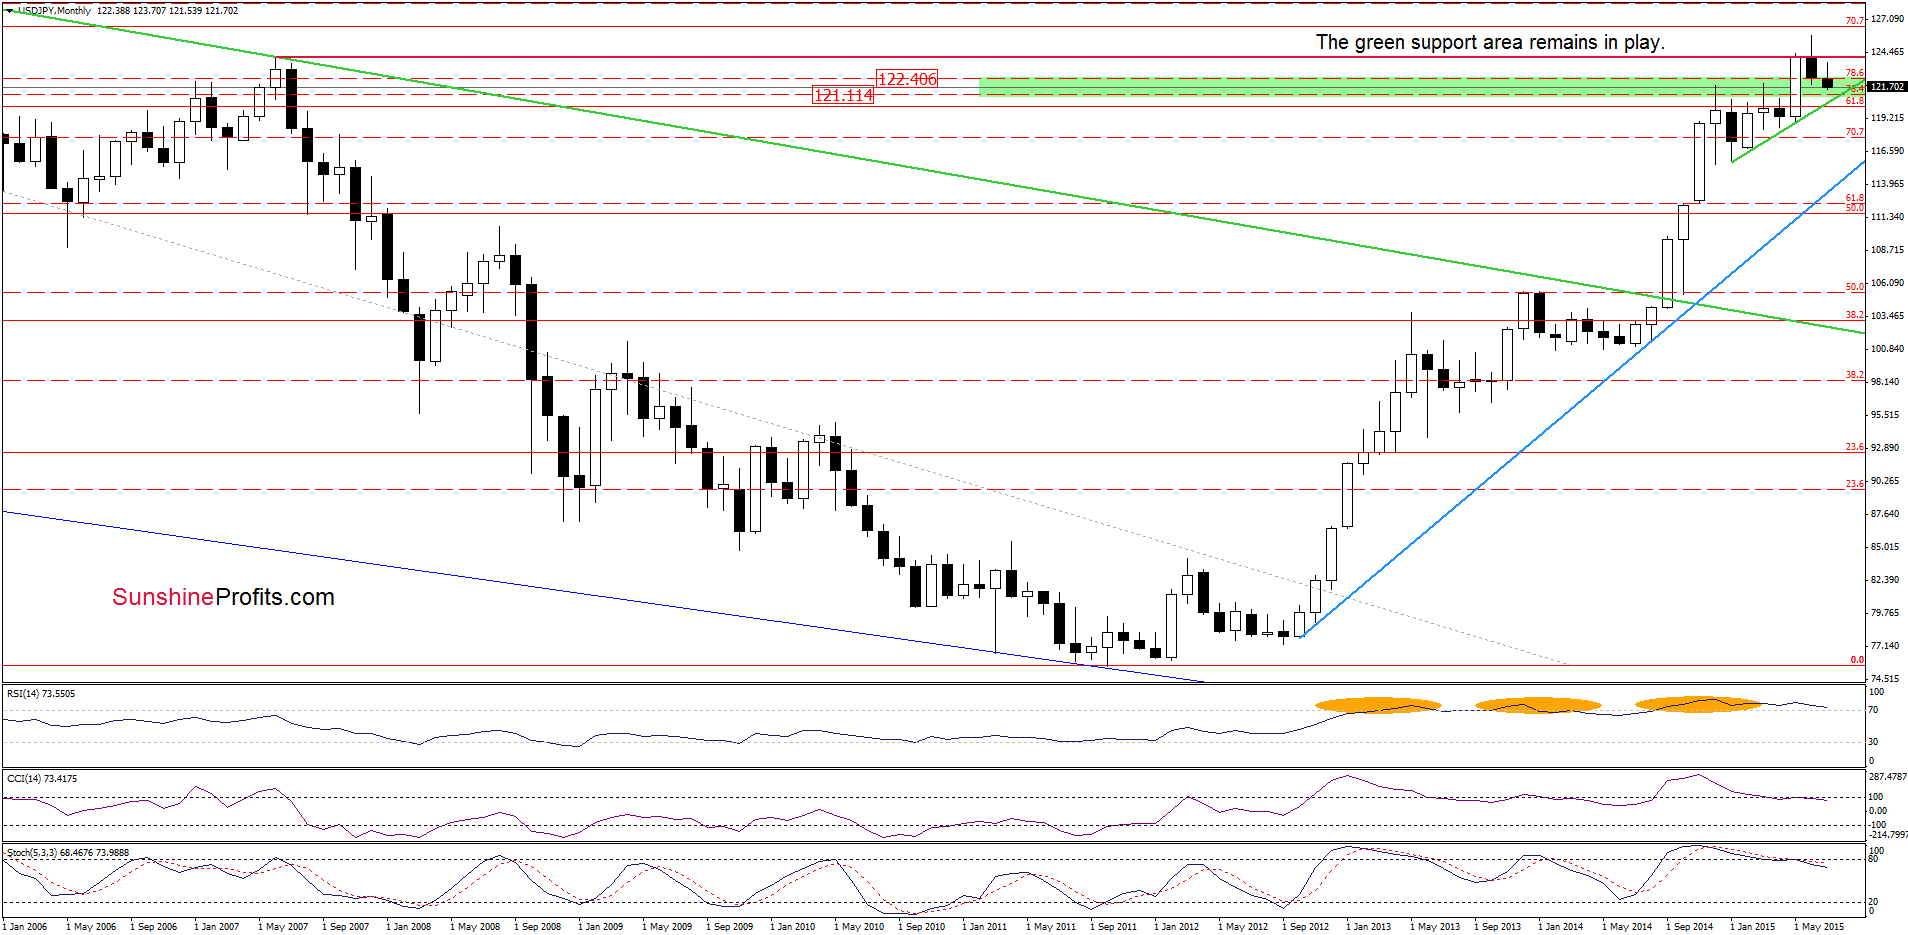
Please note that the current position of the daily indicators suggests that the space for declines seems limited. Therefore, it is worth noting that slightly below the Fibonacci retracement is also the lower border of the green support zone (121.11) and the medium-term green support line (around 120.31), which together could pause (or even stop) further deterioration (both marked on the weekly chart).
Very short-term outlook: mixed
Short-term outlook: mixed
MT outlook: mixed
LT outlook: bullish
Trading position (short-term; our opinion): No positions are justified from the risk/reward perspective at the moment. We will keep you informed should anything change, or should we see a confirmation/invalidation of the above.
AUD/USD
In our Monday’s Forex Trading Alert we wrote the following:
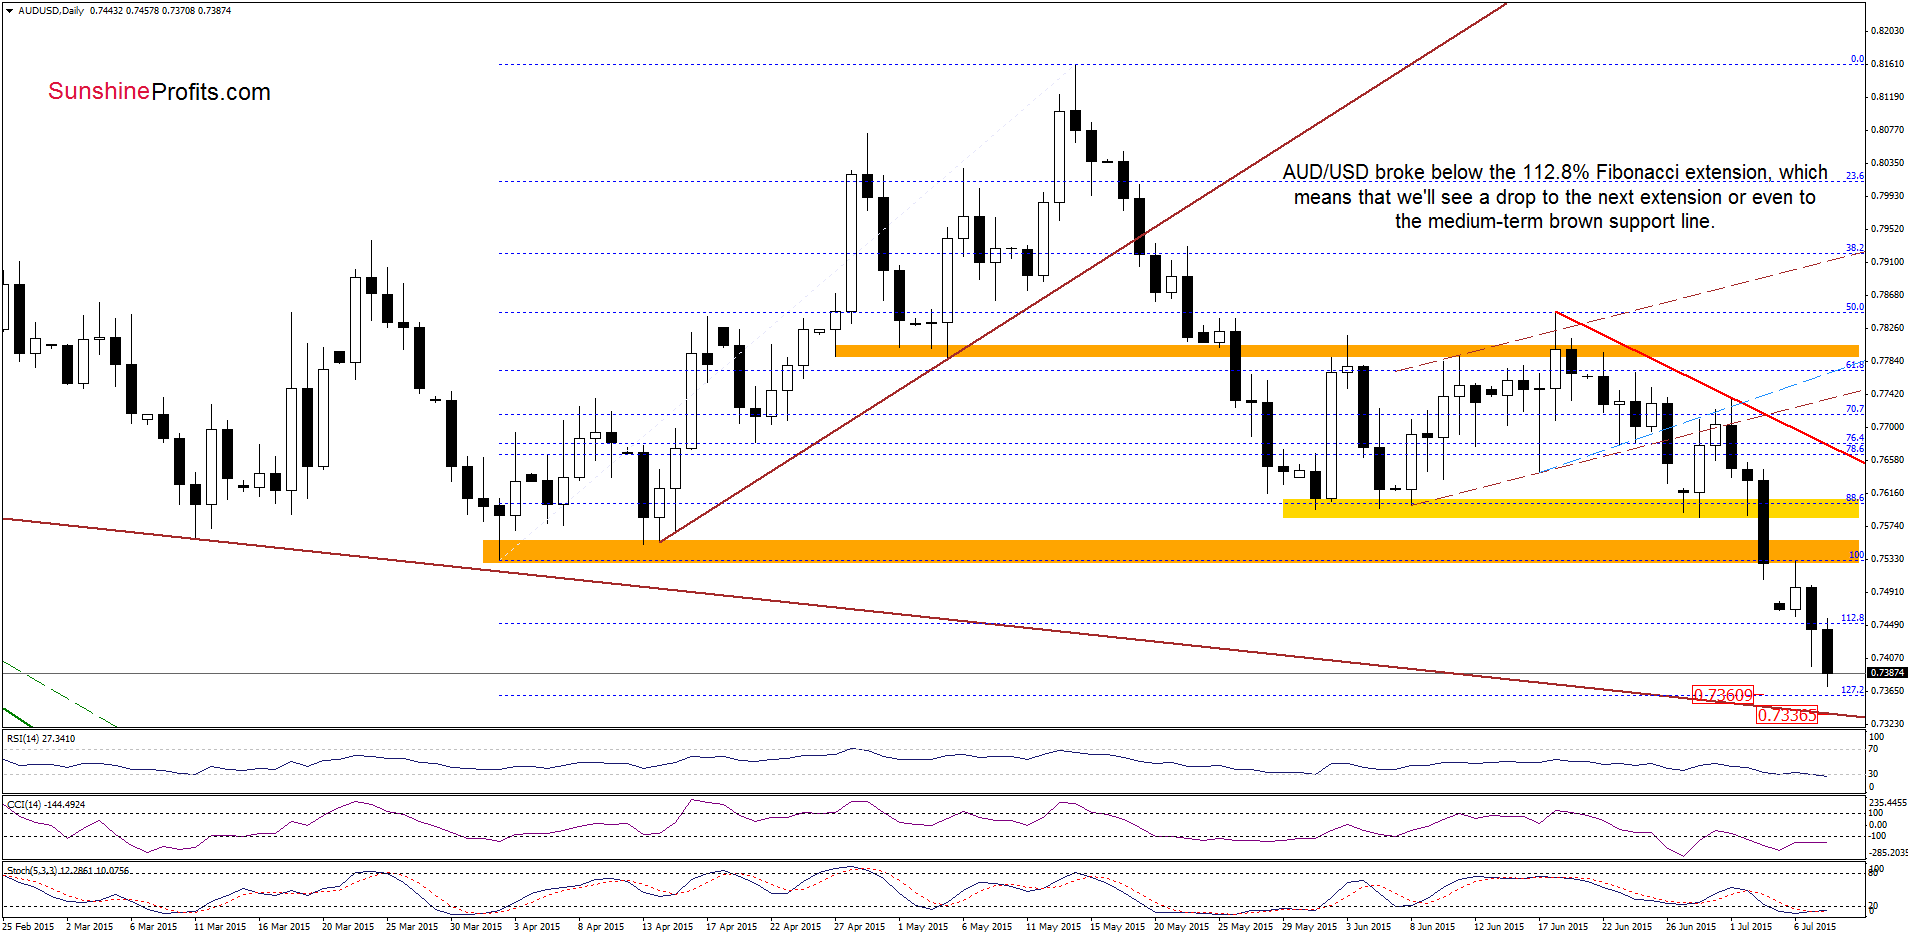
(…) AUD/USD declined below the 70.7% Fibonacci retracement, approaching the 112.8% Fibonacci extension. Although the exchange rate rebounded earlier today, invalidating earlier breakdown under Fibonacci retracement (…), the pair remains under the previously-broken green zone, which serves as the nearest resistance at the moment. Therefore, in our opinion, as long as there is no comeback above it, higher values of AUD/USD are not likely to be seen and another downswing should not surprise us. Please note that if the support level based on the 112.8% Fibonacci extension is broken, the next target for currency bears would be around 0.7345-0.7360, where the 127.2% extension and the long-term brown support line are.
From today’s point of view we see that currency bears pushed AUD/USD lower as we had expected. With this downward move, the exchange rate declined under the 112.8% Fibonacci extension, which means that we’ll see a test of the 127.2% extension or even the long-term brown support line (currently around 0.7336) in the coming day(s).
What could happen if these levels are broken? Let’s take a look at the weekly chart and find out.
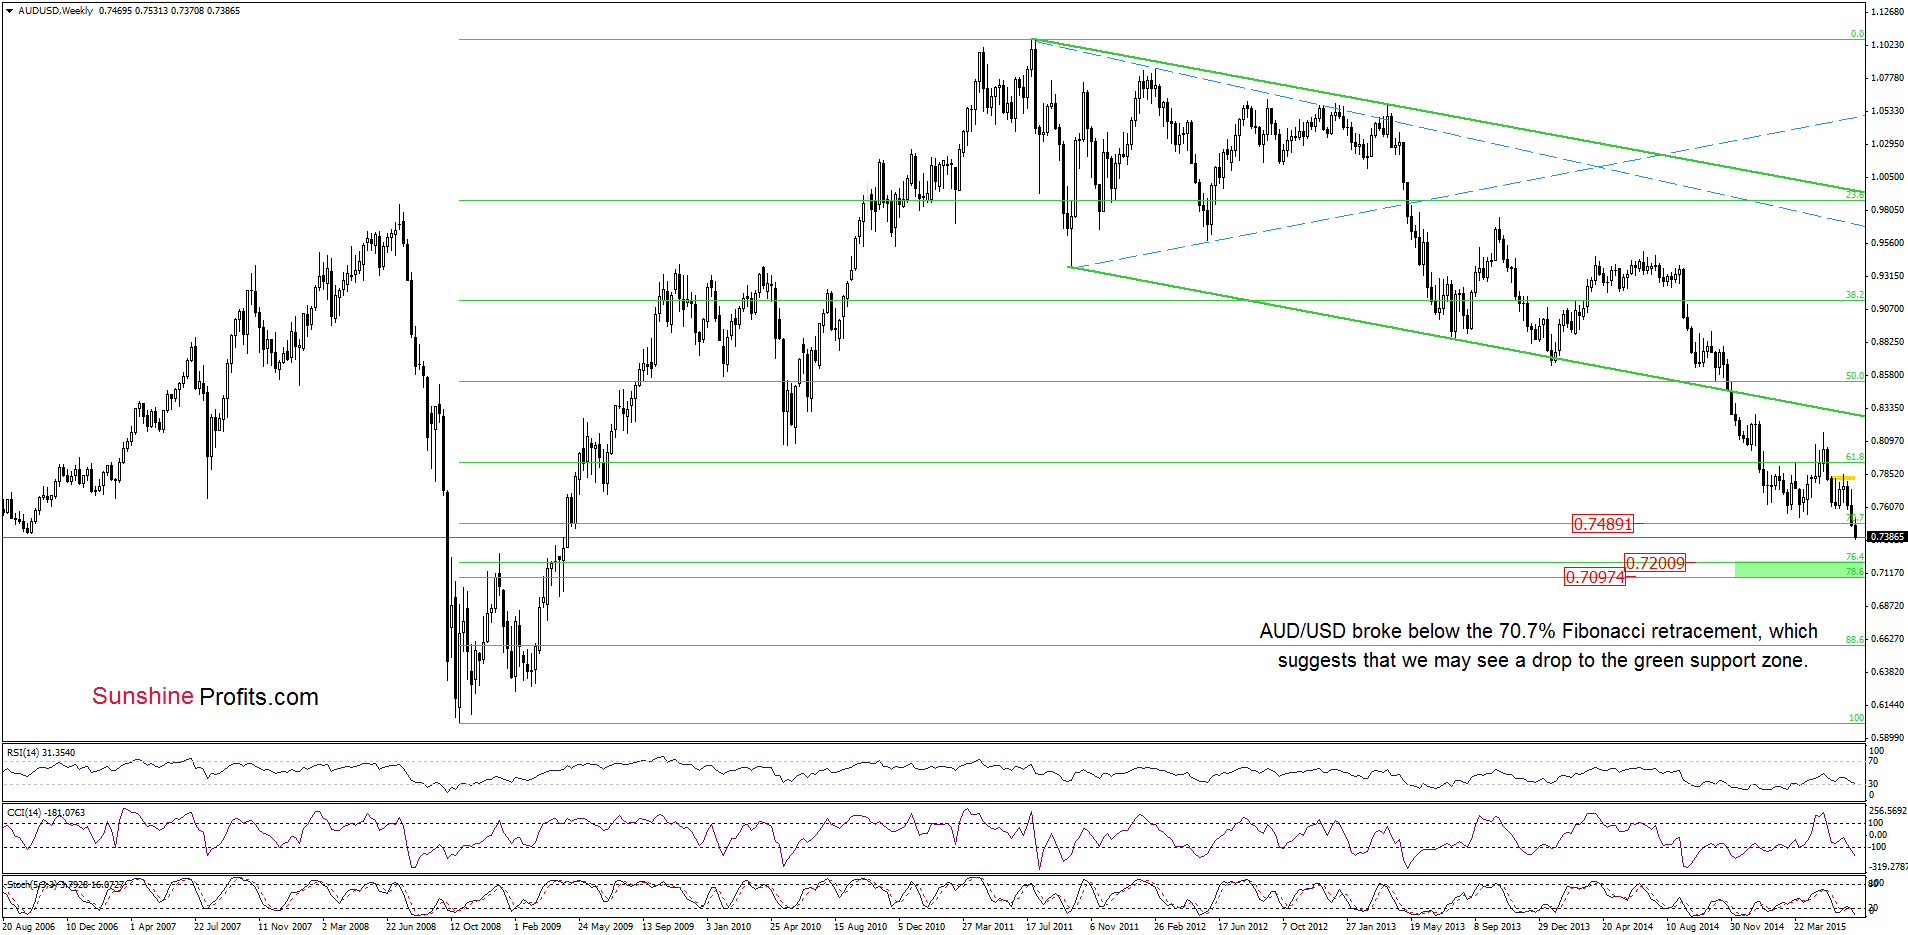
On the above chart, we see that AUD/USD broke below the 70.7% Fibonacci retracement, which suggests that if currency bulls fail around 0.7336-0.7360, we may see a decline even to the green support zone based on the 76.4% and 78.6% Fibonacci retracement levels (around 0.7097-0.7200) in the coming week(s).
Very short-term outlook: bearish
Short-term outlook: mixed
MT outlook: mixed
LT outlook: mixed
Trading position (short-term; our opinion): No positions are justified from the risk/reward perspective at the moment. We will keep you informed should anything change, or should we see a confirmation/invalidation of the above.
Thank you.
Nadia Simmons
Forex & Oil Trading Strategist
Forex Trading Alerts
Oil Investment Updates
Oil Trading Alerts

