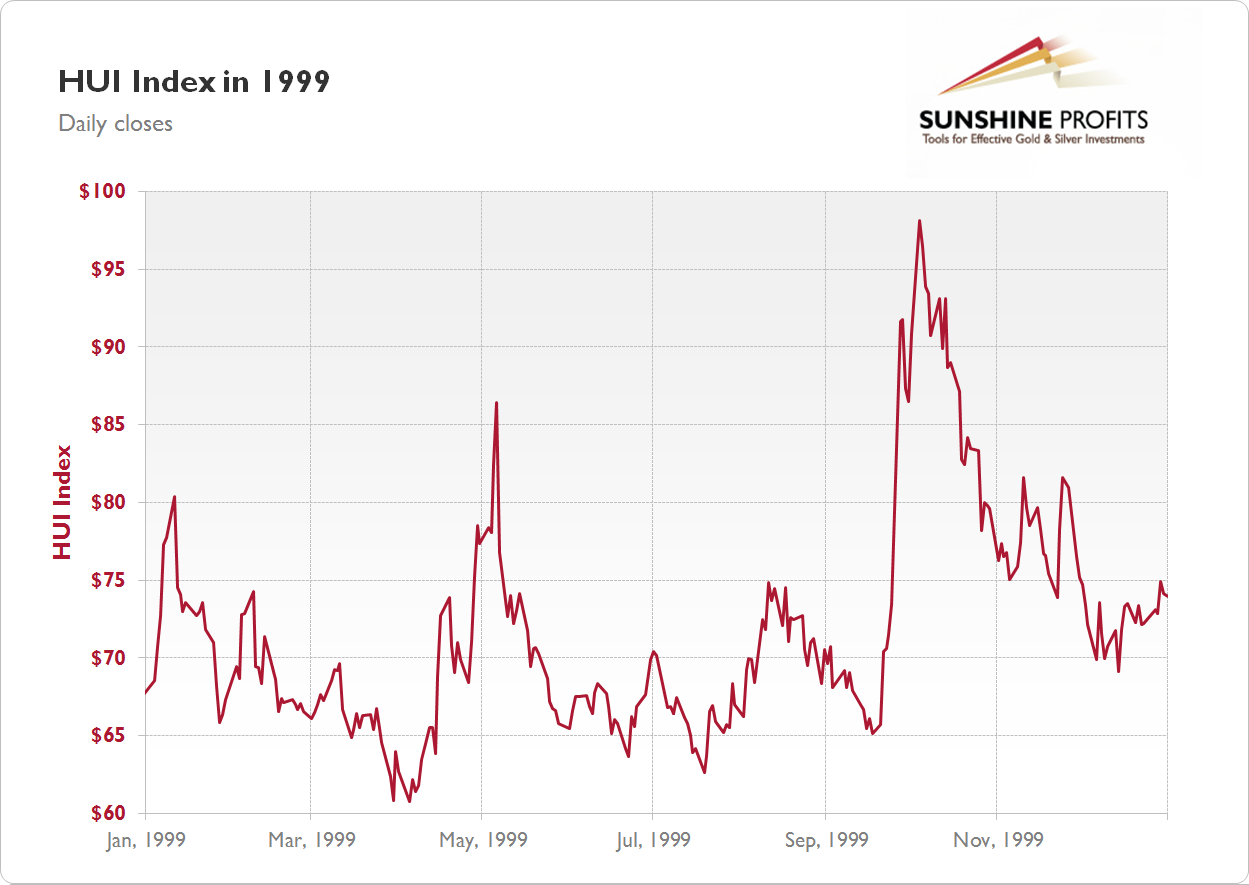
Gold Stock Chart 1999

(clicking on the chart will expand it)
The Gold Mining Stocks price chart for 1999 shows that after a brief rally in January, gold mining stocks were declining until early April. The yearly low was formed on April 5 at 60.79. The HUI Index was trading within a consolidation until September. Then it rallied to yearly high of 98.12 on October 4. Since then, gold mining stocks were declining. Overall, gold mining stocks index gained 6.36 points (9.40%) in 1999. The final close of the year was 74.02.
| Similiar charts | |
|---|---|
| Gold Stock Chart 2000 | Gold Stock Chart 1998 |
| Gold Chart 1999 | Silver Chart 1999 |
Gold Alerts
More-
Status
New 2024 Lows in Miners, New Highs in The USD Index
January 17, 2024, 12:19 PM -
Status
Soaring USD is SO Unsurprising – And SO Full of Implications
January 16, 2024, 8:40 AM -
Status
Rare Opportunity in Rare Earth Minerals?
January 15, 2024, 2:06 PM
Recent
More- May 4, 2021, 6:54 AM Mushrooms in the Park?
- April 11, 2021, 12:24 PM Your Week In Brief
- March 12, 2021, 11:28 AM Dear Bill Gates, Please Stop Commenting about Bitcoin


