
The end of the year is usually calm on the capital markets. The volatility is low, as the money managers from all over the world take some time off and spend the Holiday Season with their families. At the same time, the end of the year is a perfect time for summarizing and reviewing this year's actions and making key decisions regarding the next year. The beginning of this Premium Update will not be any different; especially that this is the year during which the Premium Service was introduced, so I believe that a brief review on this year's performance would be quite useful.
This year has been gold, gold-er, gold-est for investors in the precious yellow metal. Generally, I don't like to brag about my past successful calls (although my friends with expertise in marketing tell me that I have to) - I strive to be the person that looks in the mirror when something goes wrong (to make improvements), instead of looking in it after I succeed. However, it currently seems that this year has really been successful and very profitable for Investors and Speculators, who decided to take advantage of my comments, and given this time of the year, I am going to remind you about a few of them. Please note that all comments that you find below areverifiable.
Exactly a year ago, at the end of December 2008, we sent our Readers an e-mail that said "we are approaching a very good entry point to add to your long-term holdings and perhaps to speculate on rising gold stock prices."
At that time the price of the yellow metal closed at $870. Those who bought gold on my advice watched their investment rally to a peak of $1, 225 a year later. The price of gold climbed the whole of 2009, mainly thanks to:
- Large investment demand
- Central bank purchases
- Declining dollar
- Fears of inflation
- Demand-supply mismatch in gold production and consumption.
- Speculative buying due to the breakout above $1,000
But as you know, nothing ever goes up in a straight line. There have been corrections and consolidations along the way. The great thing is that Subscribers of the Premium Service were not caught by surprise on any of the main twists and turns in the road that the price of gold traveled this year.
With 2009 coming to a close, we looked back at our analyses and recommendations throughout the year and it turns out that the efficiency has been rather good.
A few choice examples:
On February 18th we posted an essay entitled Warning! Precious Metals and Corresponding Stocks May Fall in a Few Days! That was about a month before I introduced the Premium Service, so this essay is available publicly (for verification purposes - here's a link to this essay on Kitco)
At that time gold had enjoyed a $200 rally to break $1,000. After the e-mail the price rallied for six more days, hit $1017, but fell rapidly by $100 two weeks later down to $910.
No surprise there for our forewarned subscribers.
On March 27th we wrote that "it is not out of the question that PM stocks will correct sharply only to soar in the following weeks"
On the day the essay was published, gold closed at $924. Twelve days later, on April 8th, gold dropped to $859. Two days before gold prices hit bottom the following was posted on the website:
The last few days have been really disappointing for people interested in the precious metals market, especially for long-term gold and silver investors. Fortunately for investors reading our analyses, it didn't come without a warning.
Less than two weeks later, on April 19th, we suggested that we have a bullish chart pattern in silver and that we are close to the bottom in gold. We encouraged long-term investors to add to their positions.
On the day after the Premium Update was published, April 20th, the price of gold was $902. A month and a half later, on June 2nd, it rallied to $981.
On September 26th we suggested that gold prices are poised to take off. We sent a Market Alert on October 6th saying:
The momentum on the precious metals market is very strong. Given the strength of this week's rally, it seems that it can take gold to the 1070-80 area before looking back. It no longer pays to wait for lower PM prices, if you were planning to get back on the long side of the market, or to add to your positions.
In a Market Alert posted on November 3rd, we emphasized that the true risk was being out of the precious metals market. On that day gold closed at $1,084 and didn’t look back until it climbed to its peak, $1,224 a month later.
Naturally the key question is if we warned my Subscribers in time that we are nearing a top and that prices were poised to fall.
On November 27th, six full days before gold hit its peak and began its subsequent decline, we sent out a Market Alert (it was sent out on the same day that the Premium Update was posted, because we wanted my Subscribers to be able to take action before the marked closes on that day). We wrote the following:
If you are still long gold/silver/PM stocks with your speculative capital it may make sense to exit your positions now. As mentioned above, there is a chance that the PM sector would get higher on a short-term basis, but the overnight weakness in metals (…) is a strong bearish signal, so staying out of the market for the next several days/weeks (speculative capital) seems justified. There is an old saying that goes "when in doubt, stay out.
On the day of the alert, November 27th, gold closed at $1,172. It went up for another four trading days to hit a high of $1,224 and to close at $1,207 on December 3rd. The decline since then is history.
There is no magic in what your Editor does. I have no crystal ball - just training, knowledge and experience in many of the areas crucial to from the point of view of a Precious Metals Investor: macroeconomics, statistics, (behavioral) finance, monetary policy, risk management, modern portfolio theory, and most of all in studying the charts and interpreting the signals. Most importantly, I love what I do and I do it with passion and diligence.
Thank you for having taken this exciting journey with me this year. Thank you for your confidence, and your invaluable feedback. I will strive to read the map for you and guide you through the sometimes treacherous terrain in 2010 as well as I did in 2009.
So, what’s in store for us next year? Let’s turn to the charts to begin to gather the signs and clues (charts courtesy of http://stockcharts.com).
Gold
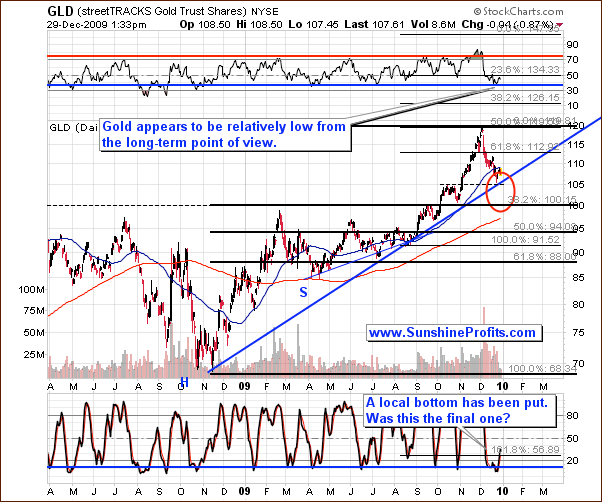
Last week I wrote that the price of gold (GLD ETF) is very close to the long-term support level (rising thick blue line) - the aforementioned $105 level. It is also currently in the area marked with red ellipse, which suggests that the bottom may be very close.
Consequently, we have just seen a local bottom in the gold market, but the question remains if that was the final bottom for this decline, and gold will move higher in the following weeks, or was that just a small pause within the decline.
The Stochastic indicator (on the bottom of the above chart) has put a double bottom, which in the past meant that a local bottom is in. The Relative Strength Index (on the top of the above chart) confirms that gold is moved close to the "oversold" territory, and might have just put a local bottom.
Therefore, the key question is - should I go back on the long side of the market?
If you've been following my analysis for some time, you might have noticed that I'm usually very careful when it comes to saying that "this or that will take place". There is a very good reason for that, which is connected with my overall approach toward investing. Before elaborating on that topic, I would like to provide additional version of the above chart. Normally I would have put everything on one long-term chart, but this time it seems that it would make the whole analysis rather unclear.
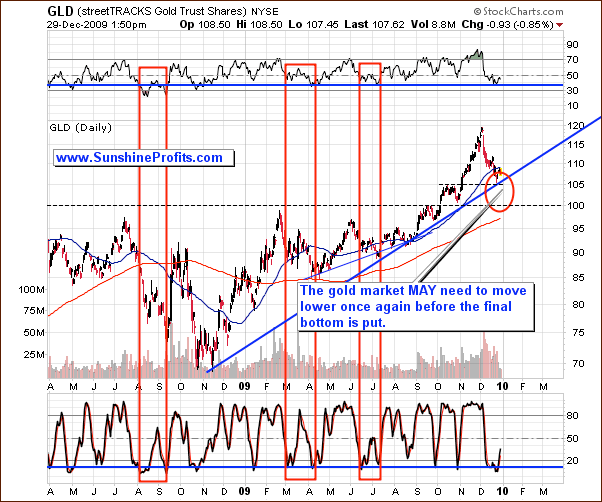
The reason that I decided to feature the second version of the same chart is that it emphasizes the similarity between several situations (red rectangles) that can be extrapolated to what we see today.
Please note that each of the marked time frames begins with a decline after a significant top has been formed. This corresponded to a relatively low value of the RSI indicator and a double bottom (or a big single bottom) in the Stochastic indicator. This is exactly what we see today. It was three times in almost 2 previous years when the initial "Stochastic double bottom" and low values of RSI after a decline meant that only the initial part of the downswing has been completed.
Back then the decline took the form of a "zigzag", meaning that there was one small rally within the decline, that caused the Stochastic indicator to move above 50. Applying this tendency to today's situation on the gold market suggests that gold may rally insignificantly only to move lower once again. Should that take place, we will need to look for some kind of confirmation - most likely in the form of either high (that was an important bottom) or - more likely - low volume meaning that gold is likely to move lower in the short run.
At this point I would like to get back to the topic that I've started a few paragraphs earlier regarding the overall approach toward investing.
The reason that I rarely tell you what will happen is that there is nothing certain in the future, especially when the capital markets are involved. The commodities market tends to be very volatile, so it is even less predictable than prices of other assets. Yet, there are many techniques and tools (and we're on a never ending search for the most reliable ones) that allow us to analyze the market and provide us with an insight as far as the chances that a particular move will materialize are concerned. I have put the "chances" word in bold, because that is the key word here. The chance that a bottom / top / breakdown, or breakout will materialize is all we can infer from the analysis of charts, or by using other means.
Investors often ask me "is the bottom already in?" or "was this the breakout?". I read it in the following way "should I buy?" The problem is that in 99% cases I don't know anything about the person asking this question, nor about their investment preferences. Without that, it's impossible to answer this question. One might ask "Why? That's a relatively simple question..." The question (just like investing itself) appears simple but is in reality complex.
The "was the bottom in?" is just a small part of a much bigger question - "how should I position myself given the current market conditions"
Long-term Investors generally want to keep their holdings invested in a given asset class until the final top is reached (hundreds or much more likely thousands of dollars away). However, given the fact that gold and silver may plunge fast (the big 2008 downswing), these Investors would also prefer to stay out of the market with at least a part of their holdings during the most unfavorable conditions. Consequently, they want to stay out of the market only when the risk of a sell-off is very big, and ride out the smaller / less probable declines. For long-term Investors, the risk is to be out of the market, because the consequences of being totally out of the market are too significant - missing a $200 move to save $10 on an entry point simply isn't worth it.
This means getting back to the long side of the market as soon as the risk of a deep decline is low.
This is the case today. By buying now, one is not buying at the top - more than $100 below it in gold. Moreover, the "bottom area" has been reached, so the risk of a deep decline from here is limited. Consequently, it makes sense for long-term Investors to enter the market, even though there are no "clear" signals that the bottom is in. In other words "it is profitable enough" for one to get back on the long side of the market with their long-term capital, to warrant investing.
Speculation is a different matter. Here, you take small positions, trade often, and a wrong decision every now and then is to be expected (!). Therefore, Speculators usually want to stay with their capital on the sidelines and enter only during the most favorable conditions. This approach allows them to minimize the number of losing transactions and maximize the amount of the profitable ones. Consequently, being out of the market is not a big risk as far as speculation is concerned. Here you can say that "there's always the next train." You can - and it is profitable to - wait for the most profitable risk/reward situation and enter the market at this particular moment.
This means waiting for the most appealing risk/reward combinations. Naturally, you may - and most likely do - have a different style of trading than the one mentioned above, and that is perfectly fine with me. Still, the main implication remains - trading is about many single transactions and maximizing the odds of a success in each of them.
The point is that today we may see several factors suggesting that this may not have been the final bottom for this decline. Therefore, speculators might want to wait for additional signals before opening a position here.
Let's turn to the short-term chart for an additional confirmation.
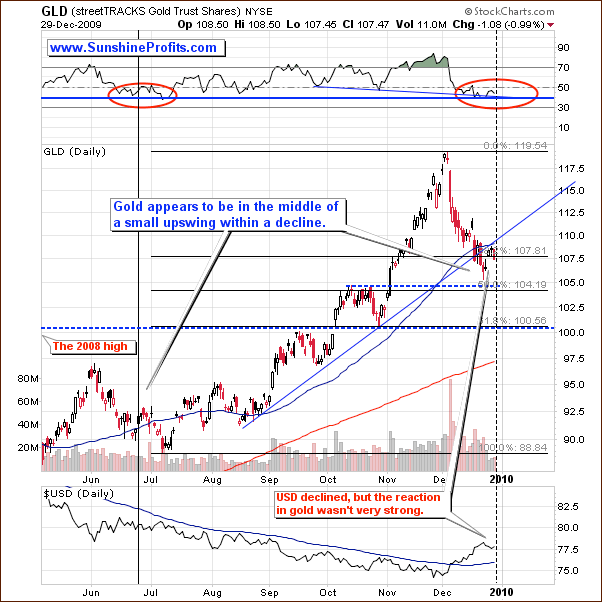
The short-term chart does in fact confirm that the decline in the yellow metal may not be over just yet. The first thing that I would like you to focus on is gold's relative performance to the USD Index, as this is one of the best ways to measure strength of a given market, and consequently the likelihood that it will move up or down soon.
This test didn't go well for the gold market, because the value of the GLD ETF moved up insignificantly in response to the pause in the dollars rally. In other words, the decline on the USD chart is visible, while the small rally in GLD is just a blip on the radar screen.
The volume has been low during the recent small rally, which could normally suggest that a shorting opportunity is upon us, but this is not the case today. Naturally, the market may move lower, but my point is - as mentioned at the beginning of this update - that the low volume at the end of the year is to be expected, so it is nothing extraordinary - this is not a bearish divergence.
Please note that the action in the RSI indicator is currently quite similar to what we've seen several months ago, when GLD was declining from about $97 to about $90. The indicator reached the 40-50 area and is now trading sideways. The recent move up was not accompanied by a huge volume, so there is no decisive sign of a bottom yet. If history is to repeat once again, it seems that gold may move lower once again, but not necessarily right away. It is not certain how low would GLD go, but a move to the 2008 high is more and more likely.
Moving on to the silver market, let's begin with the long-term chart.
Silver
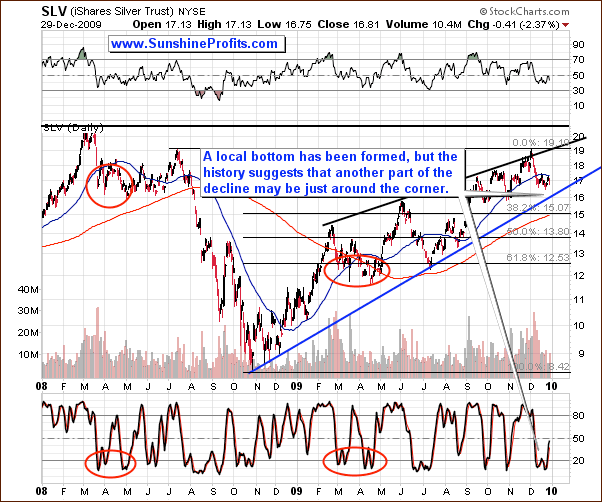
Basically, the silver market is currently in a very similar situation to the one in gold and there are not many changes since the previous week. The decline took silver more than $2 below the top, so it might be a good idea to get back on the long side of the market with your long-term capital - this is certainly not buying at the top.
On the other hand, Speculators may want to wait for additional "buy" signals, because the analysis of past declines suggests that another (smaller) downleg may be in the cards. The Stochastic indicator confirms this assumption. Please take a look at the areas marked with red ellipses. In the past, after a substantial rally, silver used to move sharply lower, after which it bounced only to form a double-bottom a few weeks later. This may be the case today, so opening large long speculative (!) positions in the silver market may be a bit premature. Naturally, this applies if you prefer to trades that take at least a few weeks. Day-Traders may want to focus on every single move.
This is where the short-term chart should prove particularly useful.
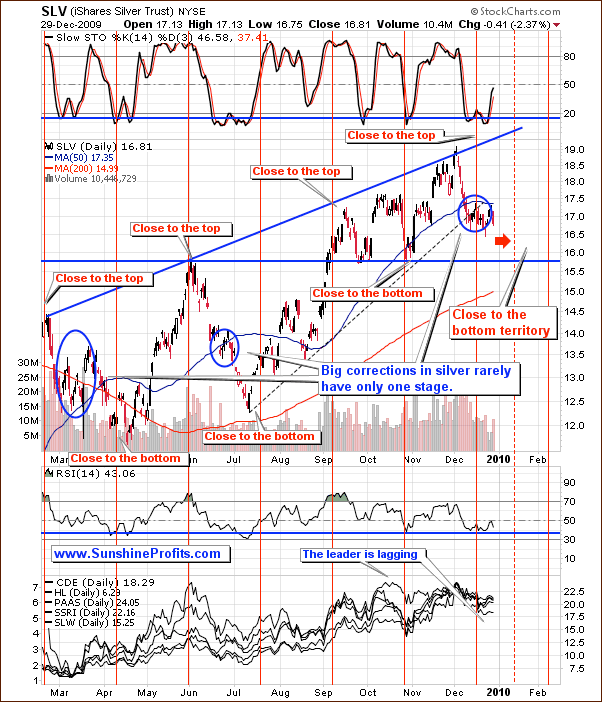
The short-term chart includes the red vertical lines, which are used to mark the cycling of the silver market. The remarkable thing with the white metal is that it really tends to move up / down in moves that take about 6 weeks (which is a very rough approximation). Once silver gets closer to the line that marks the bottom, than it is to the topping one, the odds are that a bottom will be put relatively soon. In this case the critical point comes in the first weeks of January, so silver (and also the rest of the PM market, because of the high correlation between metals) may begin to bottom out in a few weeks.
Please note that big corrections in silver rarely have only one stage, so perhaps what we've seen so far was just the first part of the decline.
Metals often move along with the corresponding equities, so it is usually useful to analyze the PM stocks, even if you are not inclined to trade them.
Precious Metals Stocks
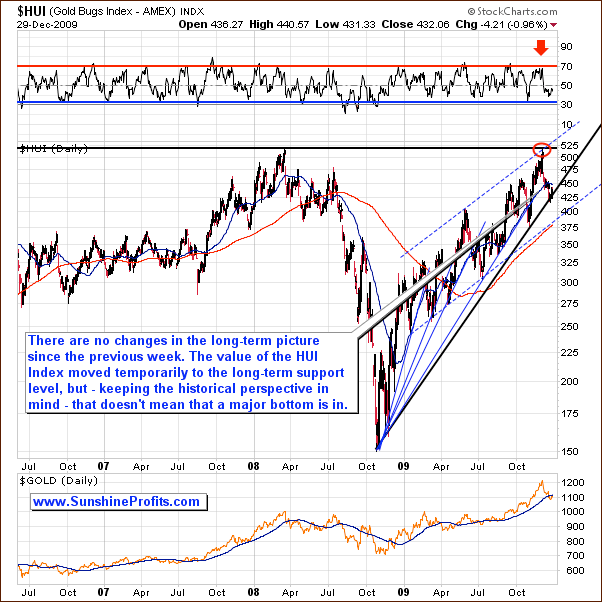
There are virtually no changes in the long-term picture of the HUI Index, so I will just include the last week's comments, as they are up-to-date also today:
Please take a look at the thin blue lines coming from the same price/time combination. Each of them was pierced, before the final bottom was put in, and this is what I expect to take place this time.
The very long-term support line has just been touched. The HUI Index even moved below it on an intra-day basis, but finally closed above this level. (...) taking the historical performance of the gold stock sector, it seems that PMs will need to move a little lower before putting in a bottom. The short-term chart confirms this.
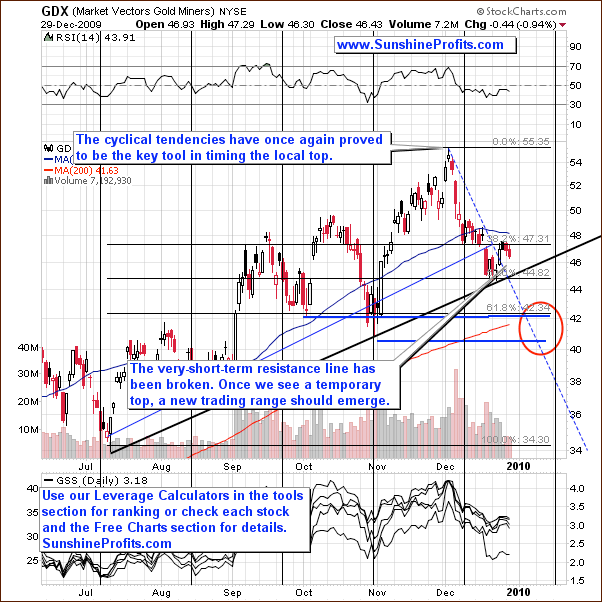
The cyclical tendencies are not only visible on the silver market, but also in PM stocks (here: the GDX ETF), and the USD Index (as you will see in the following part of this update). On the above chart, they suggest that the next turning point will emerge in January, most likely in its early part. Taking into account the shape and direction of the current move, it seems that this is going to be a bottom.
I've marked the area that I believe that is likely to stop the current decline with a red ellipse. The $40 - $42 level is likely to stop the move, because it includes two support levels that have already stopped declines in the past (in October and November), and also because it would perfectly fit the zigzag shape of the decline - I've noticed that declines on the precious metals market (especially in PM stocks) tend to take this particular form.
Moreover, the Fibonacci retracement level of 61.8% is also within the area marked with a red ellipse - just above the $42 level.
The analysis of the PM stocks with emphasis on their performance relative to other stocks provides us with similar implications.
Precious Metals Stocks' Performance Relative to Other Stocks
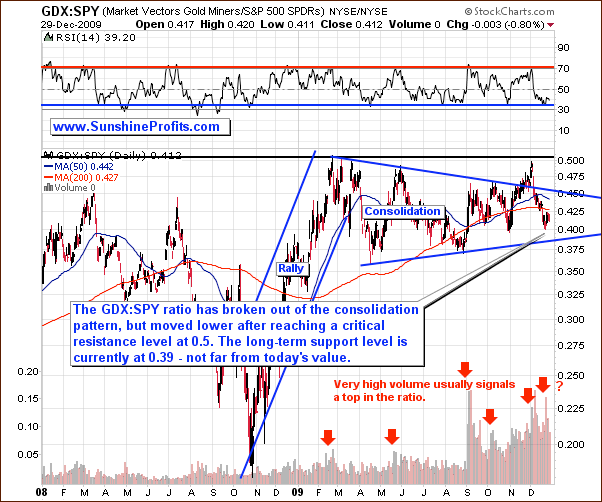
The GDX:SPY ratio describes how did the gold stocks perform versus stocks from other sectors. The ratio has been consolidation through the whole 2009, but that doesn't necessarily indicate that the probability that PM stocks will move higher is the same as the probability that the main stock indices will. Why? Because of the fundamentals, which are the thing that drives the prices of every asset class in the long term.
The most important fundamental factor for PM stocks are PM prices (poised to rally), while the fundamental factor for the main stock indices is the health of the world economy. Clearly, the PM stock Investors are better positioned in the long run than Investors purchasing mix of all other shares.
So, why didn't the ratio move higher during 2009? Taking a broader perspective allows me to answer this question. The probable reason is that this ratio has formed a massive rally a year ago, when it moved from below 0.2 to 0.5 in just four months. Such a dramatic move requires a significant breather before a market is ready to move higher.
It currently seems that this ratio will need to move a little lower - to 0.39 level before a bottom is reached. This means that PM stocks and also the rest of the PM market is likely to move lower in the short term.
I usually prefer to analyze the precious metals market along with markets that drive their prices in the short- and sometimes long-term, to gain additional insight, and this update will not be any different.
Correlations
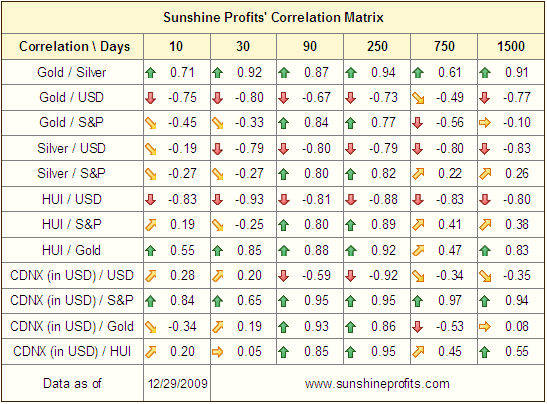
I featured the correlations matrix also a week ago, when I wrote the following:
The reason that I've decided to include the correlation table in this weeks update is that it finally features a divergence between the current value of the correlation coefficient for PMs and the S&P 500. The values of the correlation coefficients are currently not in tune with their historical norms. In fact, no matter which of the above S&P 500 correlation coefficients one takes into account (with gold, silver or the HUI Index), it is clear that the correlation has been very low in the past month: 0.06 for gold, 0.04 for silver, and 0.00 for the HUI Index. This means that during the past month, the precious metals market has been trading independently from the general stock market. Consequently, if the main stock indices finally plunge, it may not mark the beginning of a new serious downleg in the metals. Therefore, from the PM Investor's point of view, the analysis of the general stock market and its implications is now less meaningful.
The points raised a week ago are still relevant today, but the situation is even more interesting. The remarkable part of the above table is the value of the correlation coefficients between the general stock market and gold, silver, and PM stocks, because they are negative. They are not very strong (-0.33, -0.27, and -0.25 respectively), but the fact that in the past 30 trading days PMs moved on average in the opposite direction to the general stock market (which is NOT in tune with the historical norms for PM stocks and silver) is very important. These numbers suggest that right now (!) we should not rely on the signals from the general stock market as far as timing PMs is concerned.
However, the analysis of the USD Index is still relevant. Therefore, let's move to the long-term chart of the U.S. Dollar.
USD Index
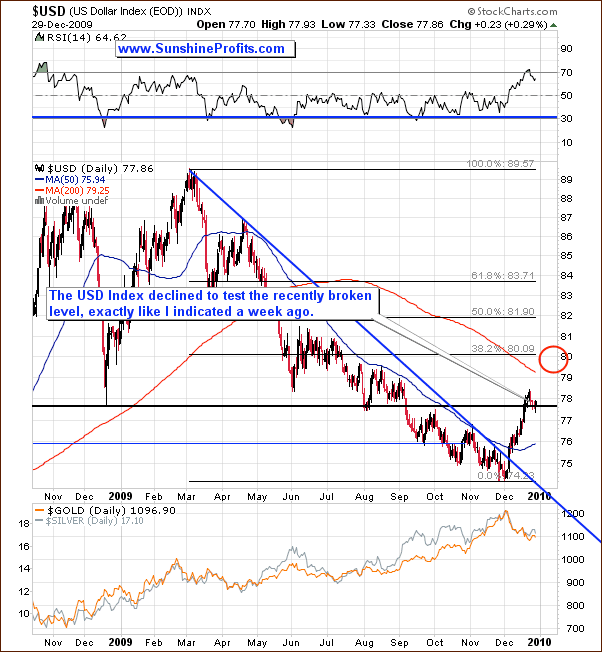
In the previous Premium Update I wrote the following:
The first target for this rally has been reached. The next strong resistance level is at 80. Currently, USD Index may decline temporarily to test the recently broken level.
This is exactly what took place this week - the U.S. Dollar moved lower and is currently testing the recently broken resistance level. It is likely that the test will be successful, and once price moves higher (thus forming a bottom just above the 77 level) USD Index will move to the area marked with red ellipse - possibly to the 80 level.
Let's take a look at the short-term chart for additional details.
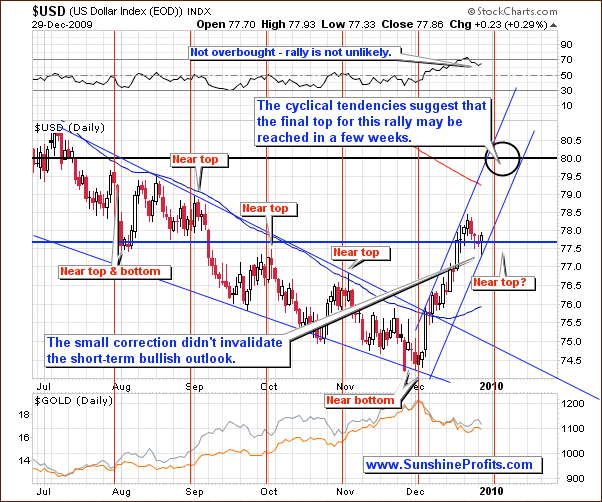
Last week I wrote the following:
The thick blue line has been broken, but there was no test that would verify it as a support. This doesn't have to take place, but these types of verification are quite common, so it is natural to expect one. Of course, you may take whatever action you wish regarding your investments and that is perfectly fine with me, but I personally wouldn't trade such a small move.
The fact that USD Index moved lower has broadened the rising trading channel, but it didn't have a big influence on the area that is likely to contain the next top. It is still in the early part of 2010, most likely in the first weeks of January, and it is likely to materialize around the 80 level. Please note that this area / time-frame corresponds to the points raised earlier, while analyzing the PM market directly.
I've mentioned above that the analysis of the general stock market is not very important given the current market juncture, but I would like to provide you with the analysis of this market in case you do decide to own some of the popular stocks. Additionally, it will allow me to maintain the continuity of the analysis
The General Stock Market
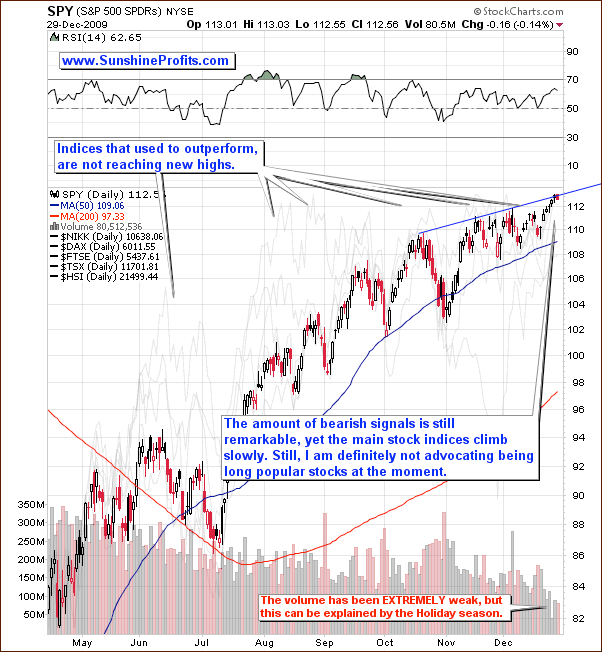
The general stock market managed to move higher despite many bearish signs. This is not the first time that this happens, so I always strive to emphasize when the analysis of the main stock indices is important from the PM Investors' point of view, and when not.
Anyway, the SPY ETF rose to the short-term resistance level and paused. It is doubtful that a breakout would take place soon, especially given the low volume. This is not a bearish sign right now because the Holiday season is characterized by low volume, but it certainly is not a bullish sign either. Please keep in mind that each market needs new buying power to move higher, and tiny volume is not a positive signal.
The financial sector has rallied as well, but the upswing has been so small that I might not have mentioned it and I doubt that anyone would notice.
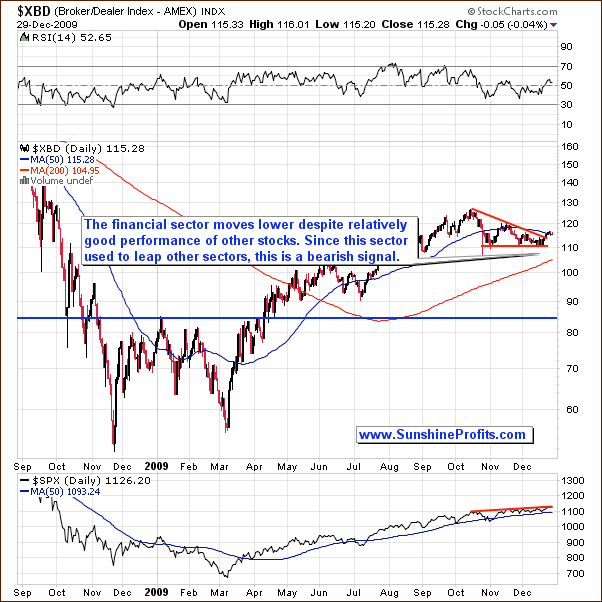
I wrote that the financial sector (the Broker/Dealer Index is being used as a proxy) used to lead the whole market in the past, so the fact that each new top is lower than the previous one, signals that the whole market may plunge sooner rather than later.
The recent small rally confirms the points raised above - the move in the financials has been even less significant than the one in other parts of the general stock market.
The last but definitely not the least signal (or rather the lack of the signal) comes from one of our own indicators.
Sunshine Profits' Indicators
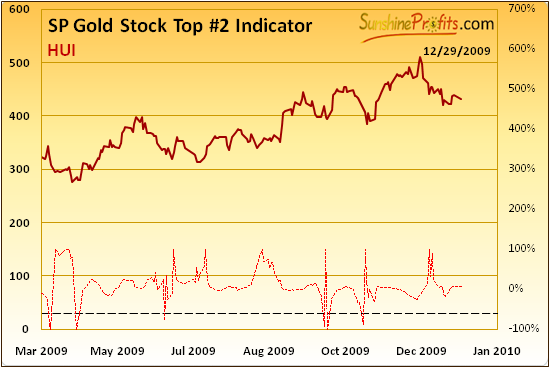
Last week I wrote the following:
Please note that the majority of bottoms were not reached until there was a confirmation from the above indicator. There was no such signal so far, which means that the bottom is likely to be put in the (most likely not too distant-) future, and that it didn't take place yet.
This week we have not seen the confirmation signal either, so it seems that the major bottom is still ahead of us.
Summary
The precious metals market is currently in the "close to the bottom" mode. The key question is how close is "close enough for you" to enter the market. The answer depends on your individual preferences.
Long-term Investors may want to purchase PMs and corresponding equities right away, regardless of the fact that the bottom may be formed in a few weeks. While this may seem careless at the first sight, I assure you it is not. The calculations behind managing large amounts of money in a strong bull market point to the fact that the true risk is to be out of the market. The chance of saving dimes just to risk missing a substantial move often isn't worth it. This is where we are today in gold, silver, and precious metals stocks.
On the other hand, Speculators, who prefer to take short-term trades with a part of their capital may want to wait for additional signals before opening new long positions, as there are several factors suggesting that the decline is not over yet. The cyclical tendencies from several markets indicate that the next turning point may emerge during the first half of January. Based on today's data, this is likely to correspond to the top in the USD Index, which (unlike the general stock market) is still an important driver of PM prices.
This completes this week's Premium Update. Thank you for reading.
Wishing you a happy and very profitable New Year,
Przemyslaw Radomski

