

Briefly: In our opinion, full (100% of the regular size of the position) speculative short positions in gold, silver and mining stocks are justified from the risk/reward perspective at the moment of publishing this alert.
“Not much happened yesterday” – one might say after looking briefly on gold, silver and mining stocks’ charts. And they would be correct. But they would probably miss the key three developments that indeed happened yesterday outside of the precious metals sector that can have enormous impact on its short-term direction. What are they?
Firstly, the USD Index moved to its long-term support levels, secondly, the Japanese yen reached its resistance line and the 61.8% Fibonacci retracement level, and thirdly, we saw a confirmation that the general stock market is no longer as important for PMs as it was in the previous days. These are all very important factors. Let’s take a closer look (chart courtesy of http://stockcharts.com).
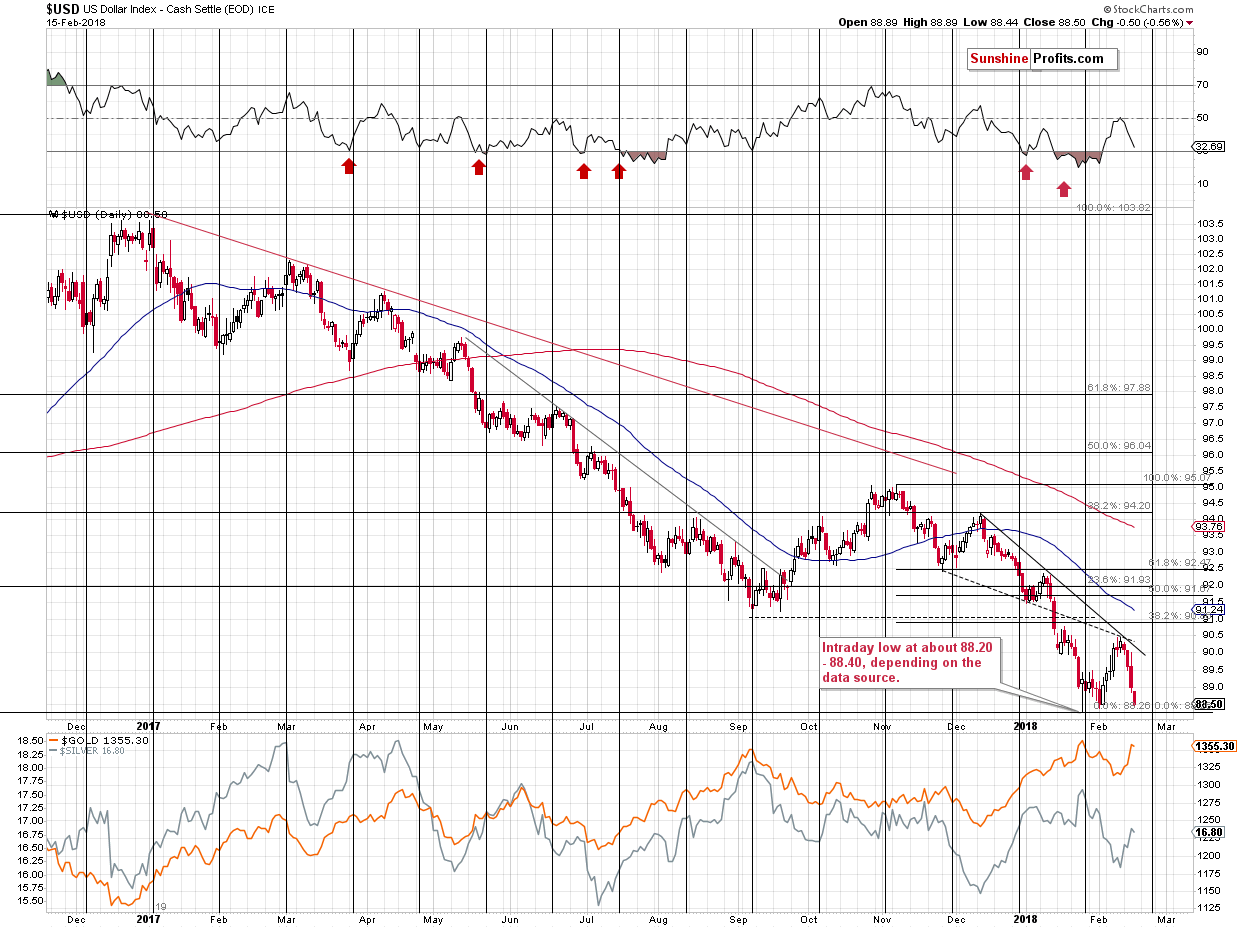
We’ll begin today’s analysis by saying that our yesterday’s comments on the above chart remain mostly up-to-date:
Today’s pre-market low for the USD Index is 88.585 (Bloomberg). We plotted this move on the above chart as a small black line.
The USD Index moved below the highest of the long-term support levels and it actually moved to this year’s low. Interestingly, gold is only $4 higher in light of the above, which is a rather weak type of reaction.
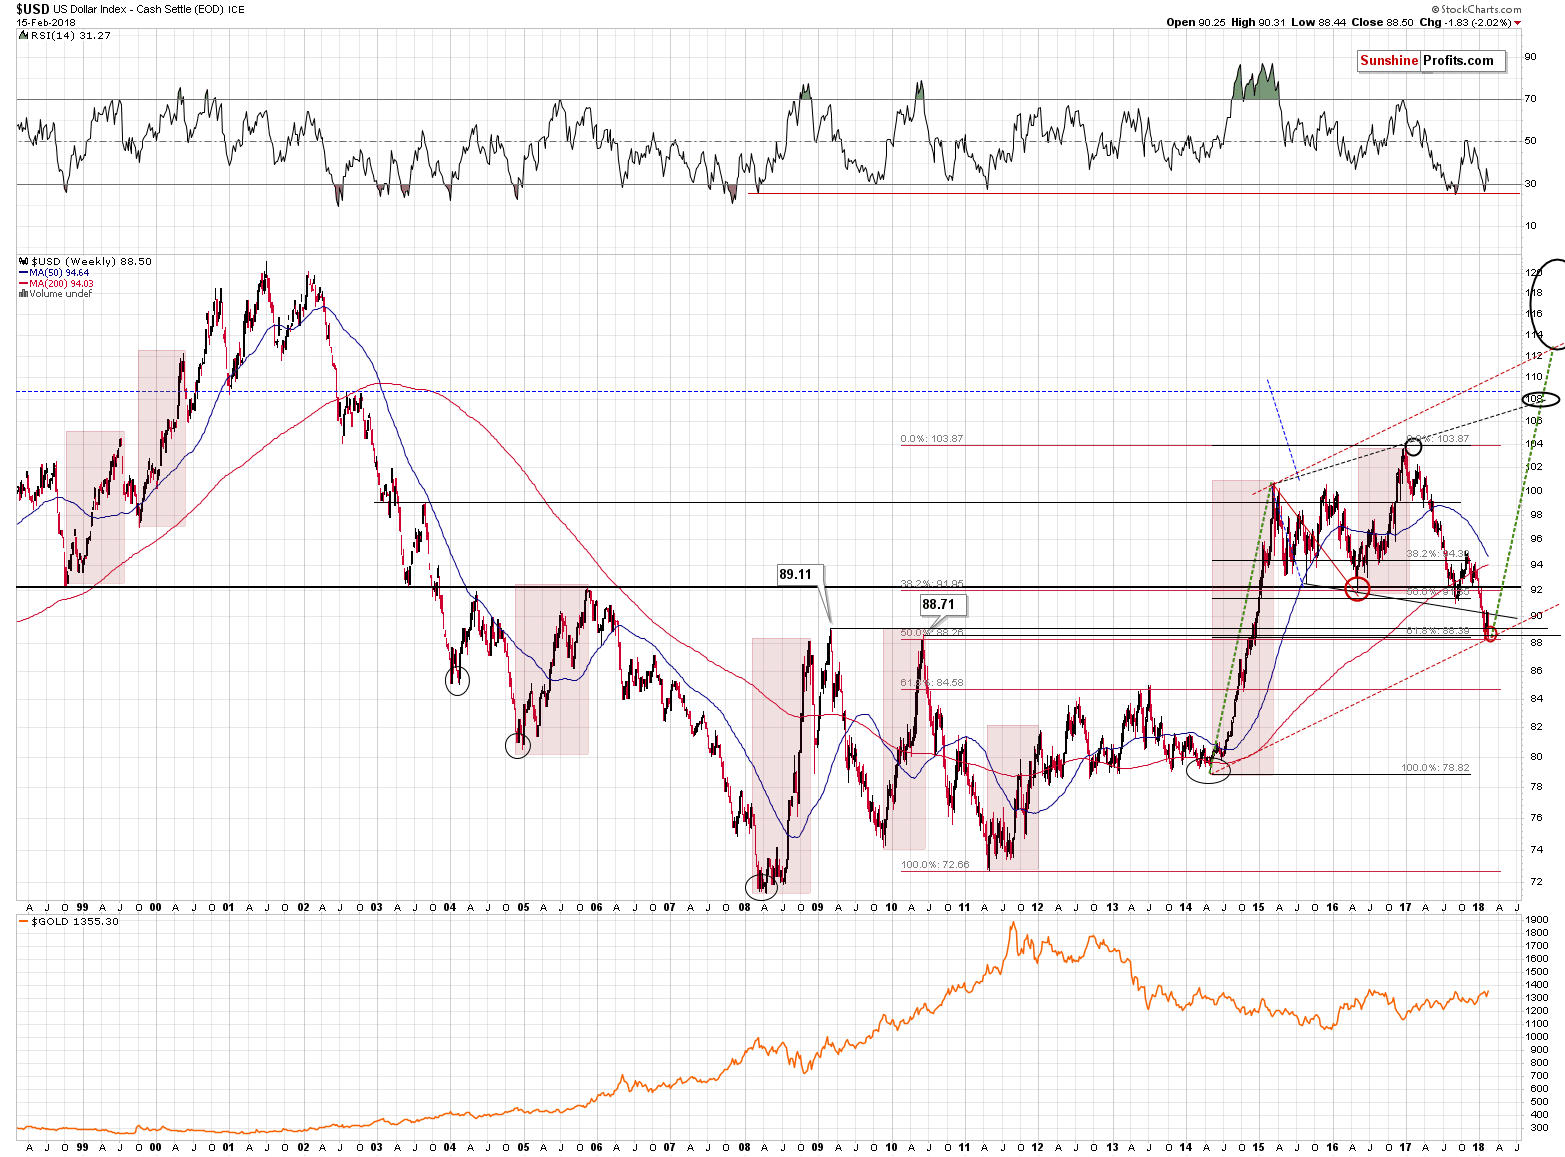
The other key, long-term support levels are: 88.71 (the 2010 high) and the two Fibonacci retracements - the 50% retracement based on the 2011-2017 rally (88.26) and the 61.8% retracement based on the 2014-2017 rally (88.39). The USD Index was just in the middle of these levels.
Another rally here will serve as an invalidation of the breakdown and another buy signal. Another decline here will likely be reversed at the lowest of the support levels (88.26) or we’ll see a breakdown. The breakdown would likely be invalidated rather quickly, just like the January 25 tiny breakdown was.
The USD Index ended yesterday’s session at 88.50, which was still in the middle of the mentioned support levels. At the moment of writing these words, today’s intraday low was 88.253 (Bloomberg) and it moved to 88.30 later on. This means that we’re seeing a repeat of the late-January action. Back then it was the bottom in the USD and a top in gold. The implications for the precious metals market – at this time – are definitely bearish.
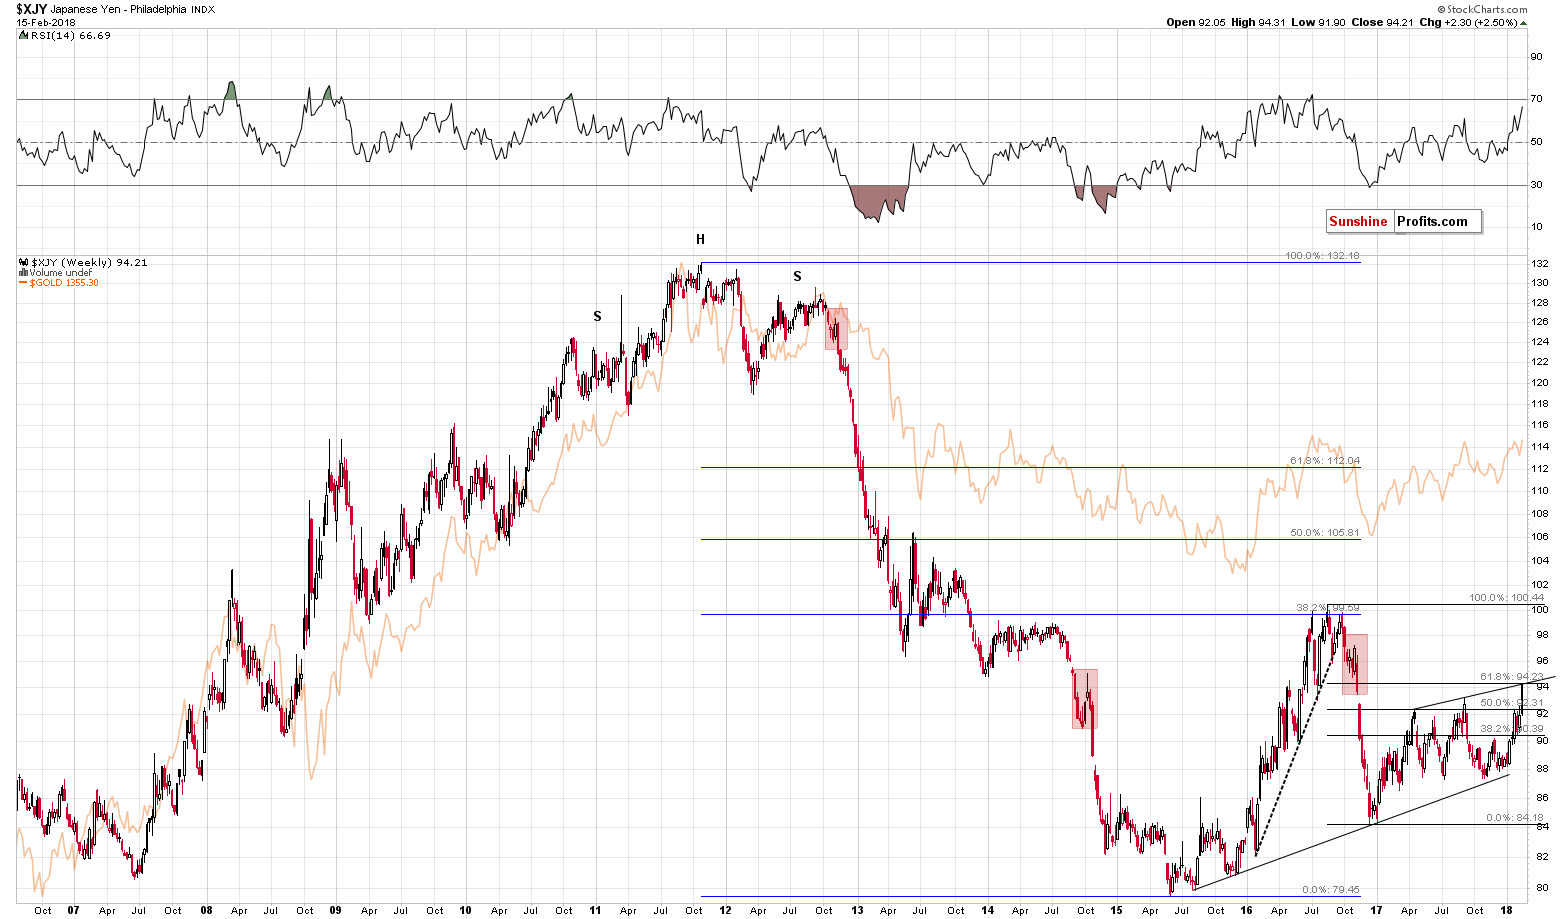
As far as the Japanese yen chart is concerned, we wrote the following in our yesterday’s alert:
Finally, let’s look at the Japanese yen. It moved above its 2018 and 2017 highs, so it’s now likely to either invalidate the breakdown or to move to the rising resistance line. The latter seems more likely as this resistance is strengthened by the 61.8% Fibonacci retracement and this is exactly the retracement that worked so perfectly from the bigger perspective in the case of the 2016 top.
(…)
The implications are rather unclear for the very short term, but with a slight bullish bias.
Gold did indeed move to new intraday high as the yen rallied to the mentioned combination of resistance levels, but the move in gold was rather insignificant. The move in yen, however, was significant as the resistance reached is strong and is quite likely to trigger a reversal. Knowing that the Japanese yen and gold very often move in tandem suggests that precious metals are currently topping.
Speaking of precious metals, let’s take a look at gold.
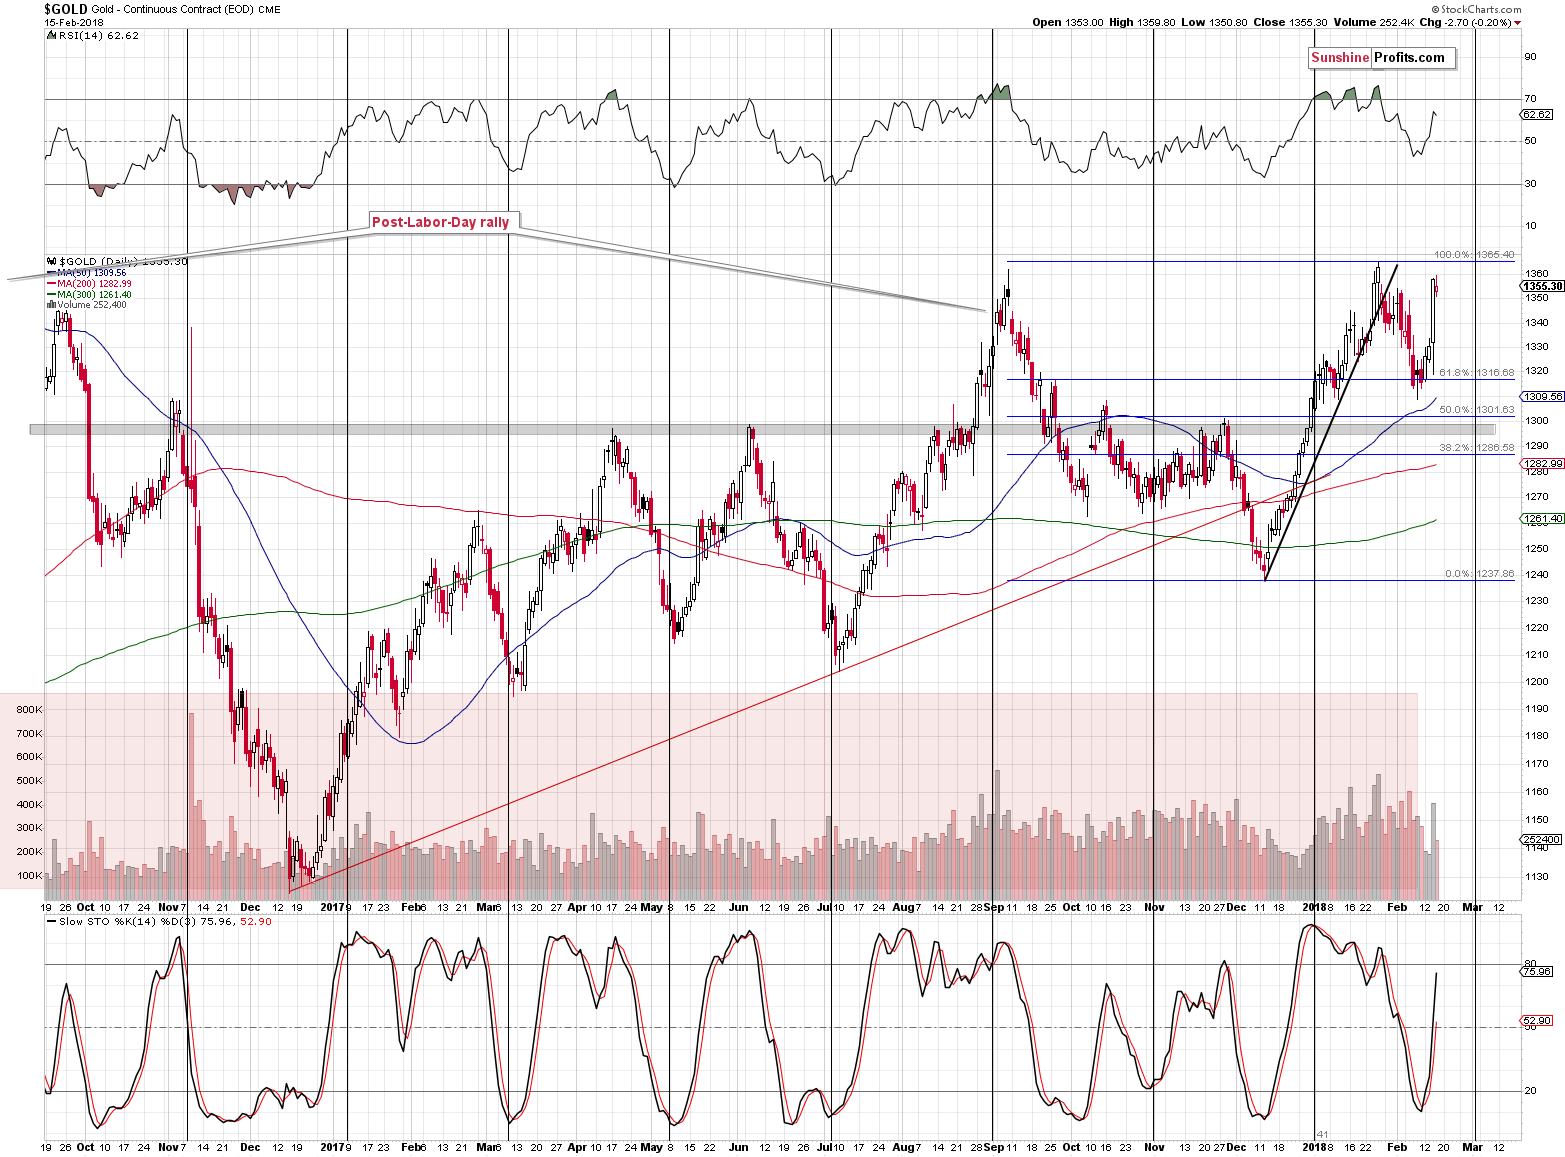
Since nothing really changed in the gold market yesterday, our previous comments on the above chart remain up-to-date also today:
Gold moved to our upper target, and then moved even higher, ending the session between the September 2017 and January 2018 tops. The [Wednesday’s] volume was not as high as it was in February, but it was definitely significant, and the session was very emotional overall. But, does it make the outlook bullish?
We have seen only a very small move above September high in terms of the closing prices and we’re still below the January high in terms of the closing prices. Gold is below both highs in terms of intraday highs. Gold approached the tops, but didn’t break above them. Gold didn’t break above other nearby tops either: the early 2016 high, and the 2014 high.
Is the above bullish or is it bearish as the resistance that is being reached is very significant? Looking at [Wendesday’s] session alone, the situation appears very bullish, but taking off the emotional glasses allows us to see that this price level was approached many times and in each previous case in the last 4 years, such an attempt was followed by a sizable decline.
Before we move to silver, we’d like to reply to a question that you might be asking yourself at this time – if gold breaks above the January 2018 and September 2017 highs, how high can it rally before stopping again.
The answer is the 2016 high of $1,377.50.
The above does not mean that the move to this level is likely – we simply want to keep you informed and prepared for the unlikely outcome of gold breaking higher.
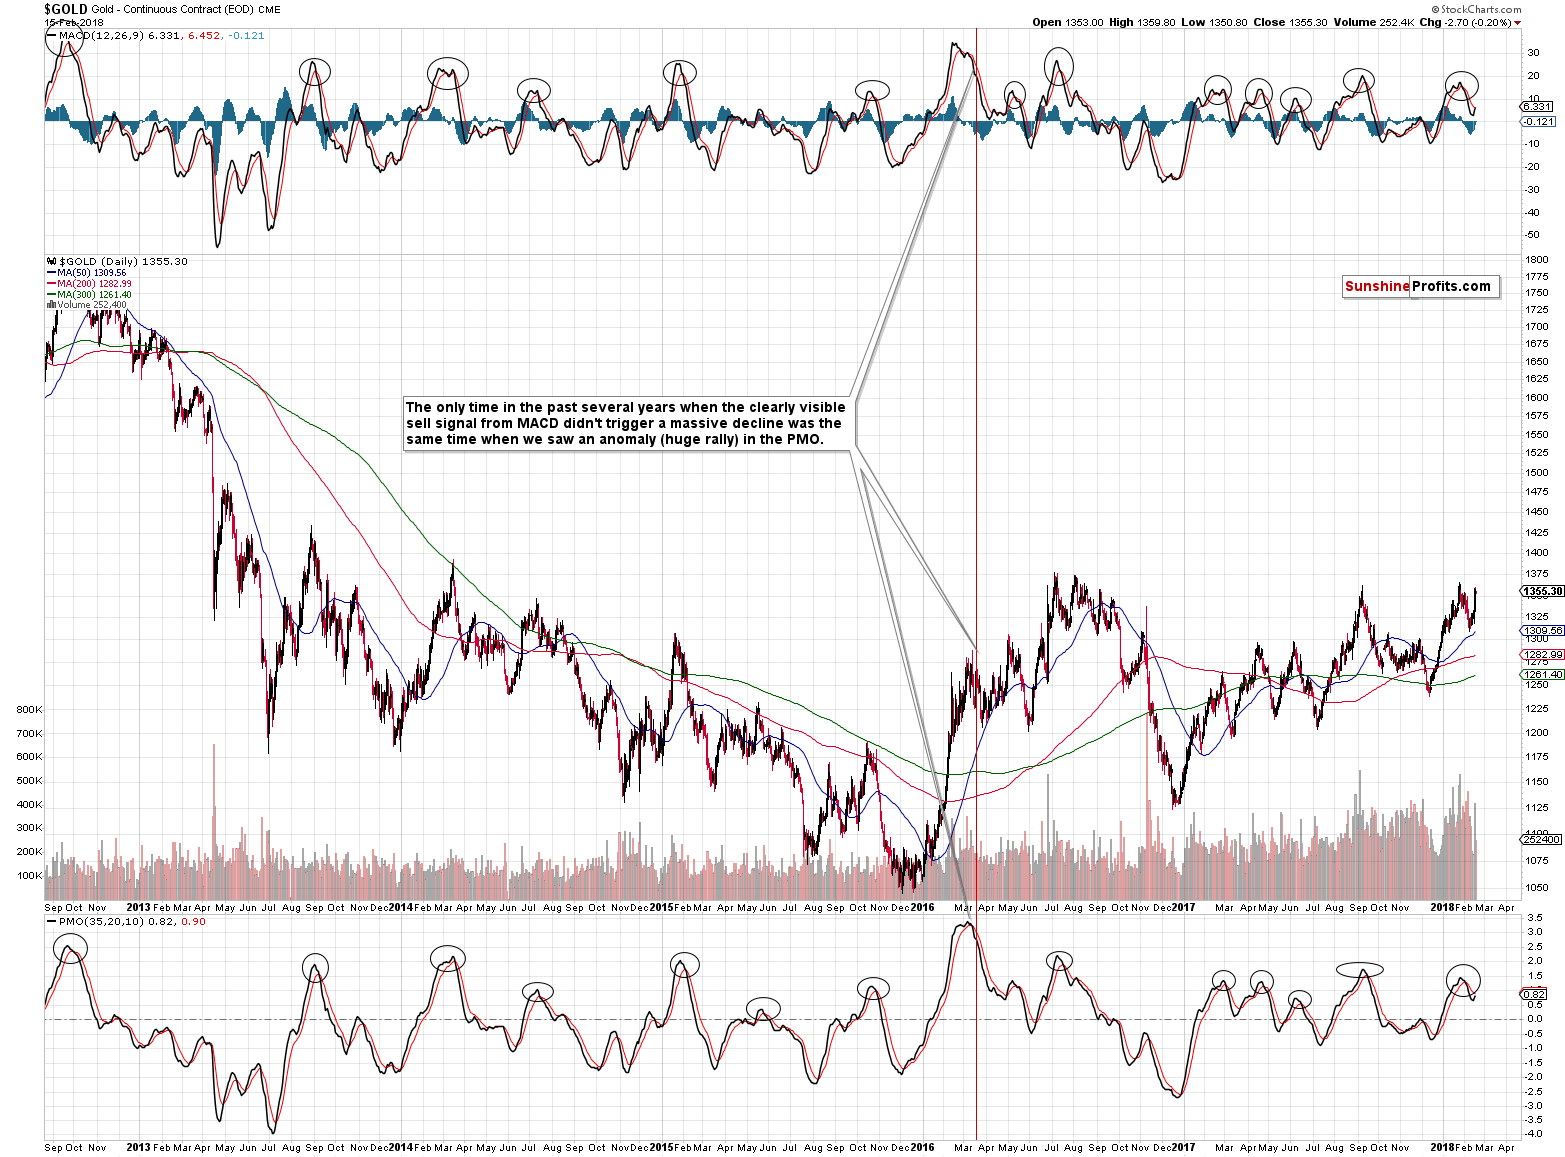
The mentioned outcome is unlikely i.a. based on the MACD and PMO indicators - our yesterday’s comments on them remain up-to-date:
The medium-term sell signal from the MACD and PMO remain in play and looking at their efficiency in detecting major tops in the past should be enough to cool the emotions triggered by yesterday’s volatility.
Both indicators moved a bit higher based on [this week’s] rally, but they are still far from reaching their moving averages, let alone breaking above them. There was one case just like that in the past – in the middle of 2016. The second top in gold was formed just below the previous one and that was the moment that started the biggest decline of the year that took gold to almost $1,100. Does [this week’s] rally still appear very bullish? No.
Since little changed yesterday, we’ll begin our comments on the white metal similarly to the way we started commenting on gold – by quoting our yesterday’s alert:
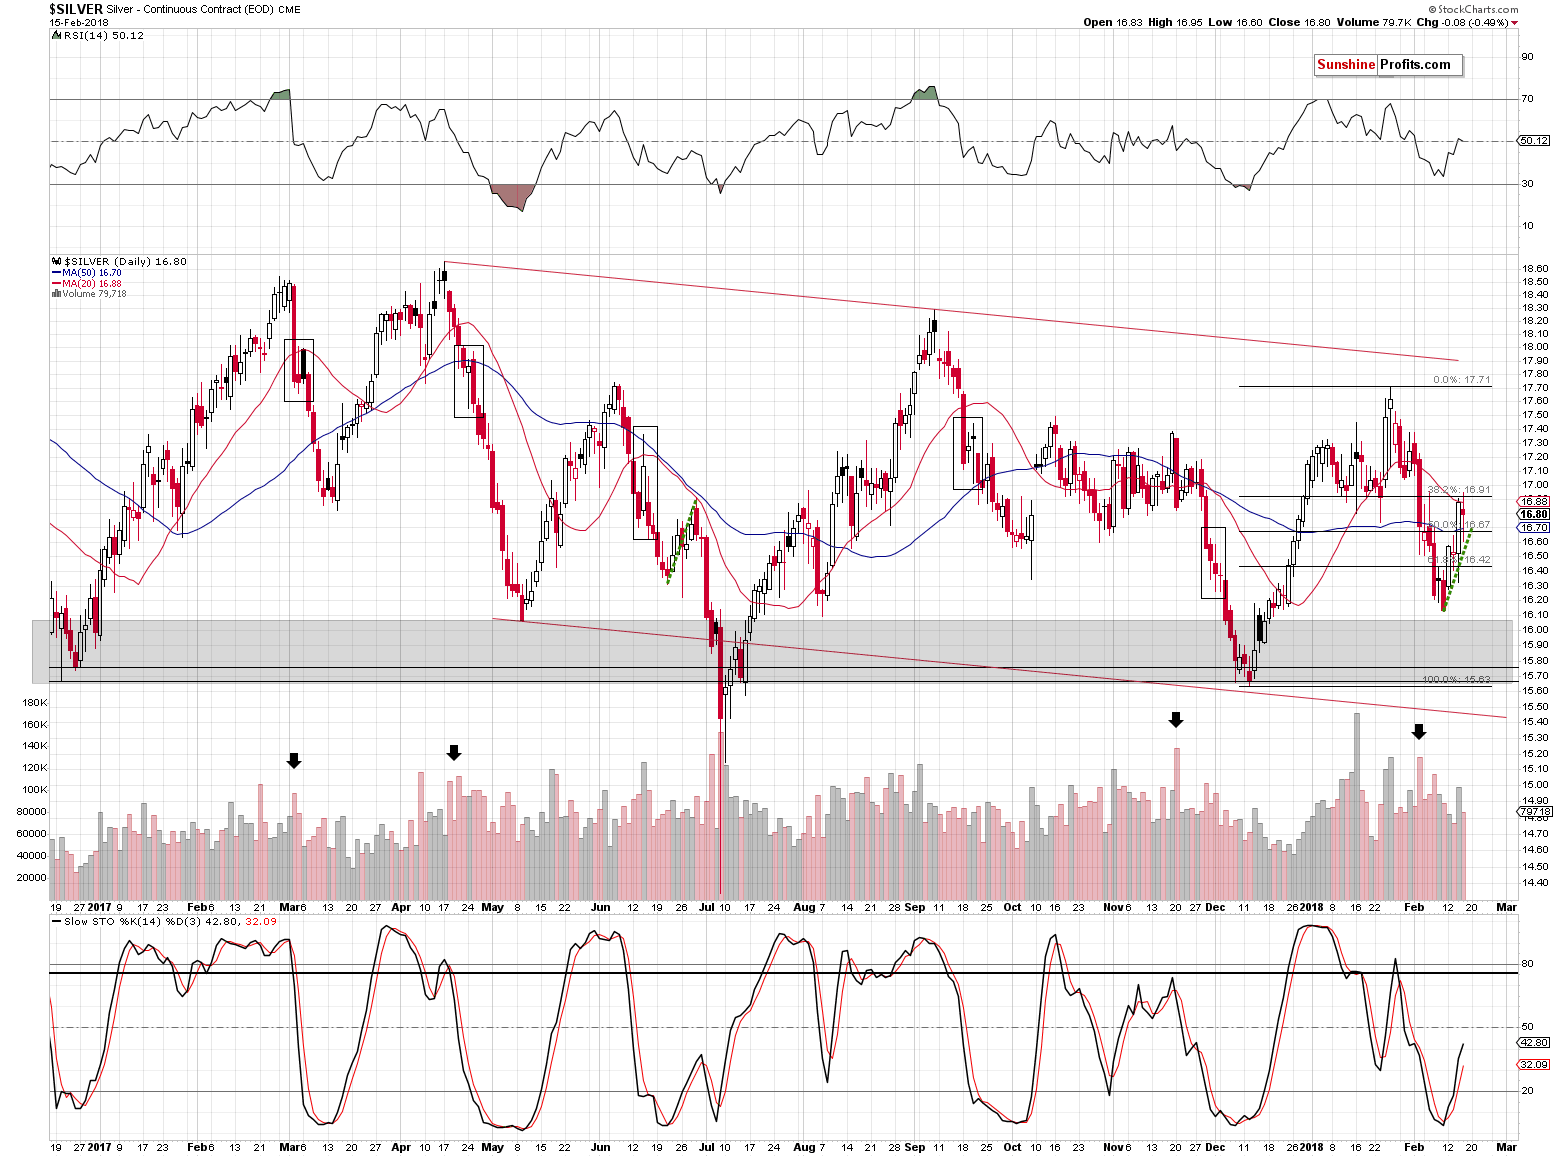
Just like gold, silver moved higher [on Wednesday], and the volume was quite significant. Unlike gold, however, the white metal didn’t move close to its previous 2018 high – only to the 61.8% Fibonacci retracement and its 20-day moving average. The first is universally important (in all markets and, in this case, silver is not an exception), while the latter is a silver-specific thing. That’s a moving average that is not necessarily important for all markets, but silver tends to bounce off it during both rallies and declines.
Did silver reach its top for this rally? It’s possible, but it could very well be the case that we’ll see another upswing before the decline resumes. This could take the form of a daily upswing, as the one that we discussed when describing gold.
The latter scenario seems quite possible especially that we haven’t seen silver’s significant short-term outperformance which would serve as a strong bearish confirmation.
To be clear – the relationship between silver’s outperformance and tops is a one-way one. Tops can form without silver’s outperformance, so the lack of silver’s outperformance is not enough to make the outlook bullish – it’s neutral and other factors should be considered. But, if we see silver’s short-term outperformance and other factors are bearish as well, then their strength is multiplied.
That’s why we are not inclined to increase the size of the current short position, even though the outlook is bearish and the resistance level in gold is at hand.
The mentioned combination of the 20-day moving average and the 61.8% Fibonacci retracement level stopped silver’s rally. Was this the top? It’s possible, but not certain. Actually, we would prefer silver to rally a bit more along with declining or pausing gold as that would serve as a perfect bearish confirmation.
Unfortunately, silver declined yesterday instead of outperforming. “Unfortunately”, because instead of seeing a bearish signal, we definitely saw a neutral one (silver’s underperformance doesn’t have bullish implications – the relationship is not symmetrical). Consequently, we’ll need to wait some more before adding to our short positions (or closing them, should the situation cease to be bearish overall), as one of the clearest bearish signs for the short term is absent.
We can say something similar about mining stocks. Their rally was stopped by the resistance levels that used to stop previous corrective upswings in the past. We described them in Wednesday’s third alert:
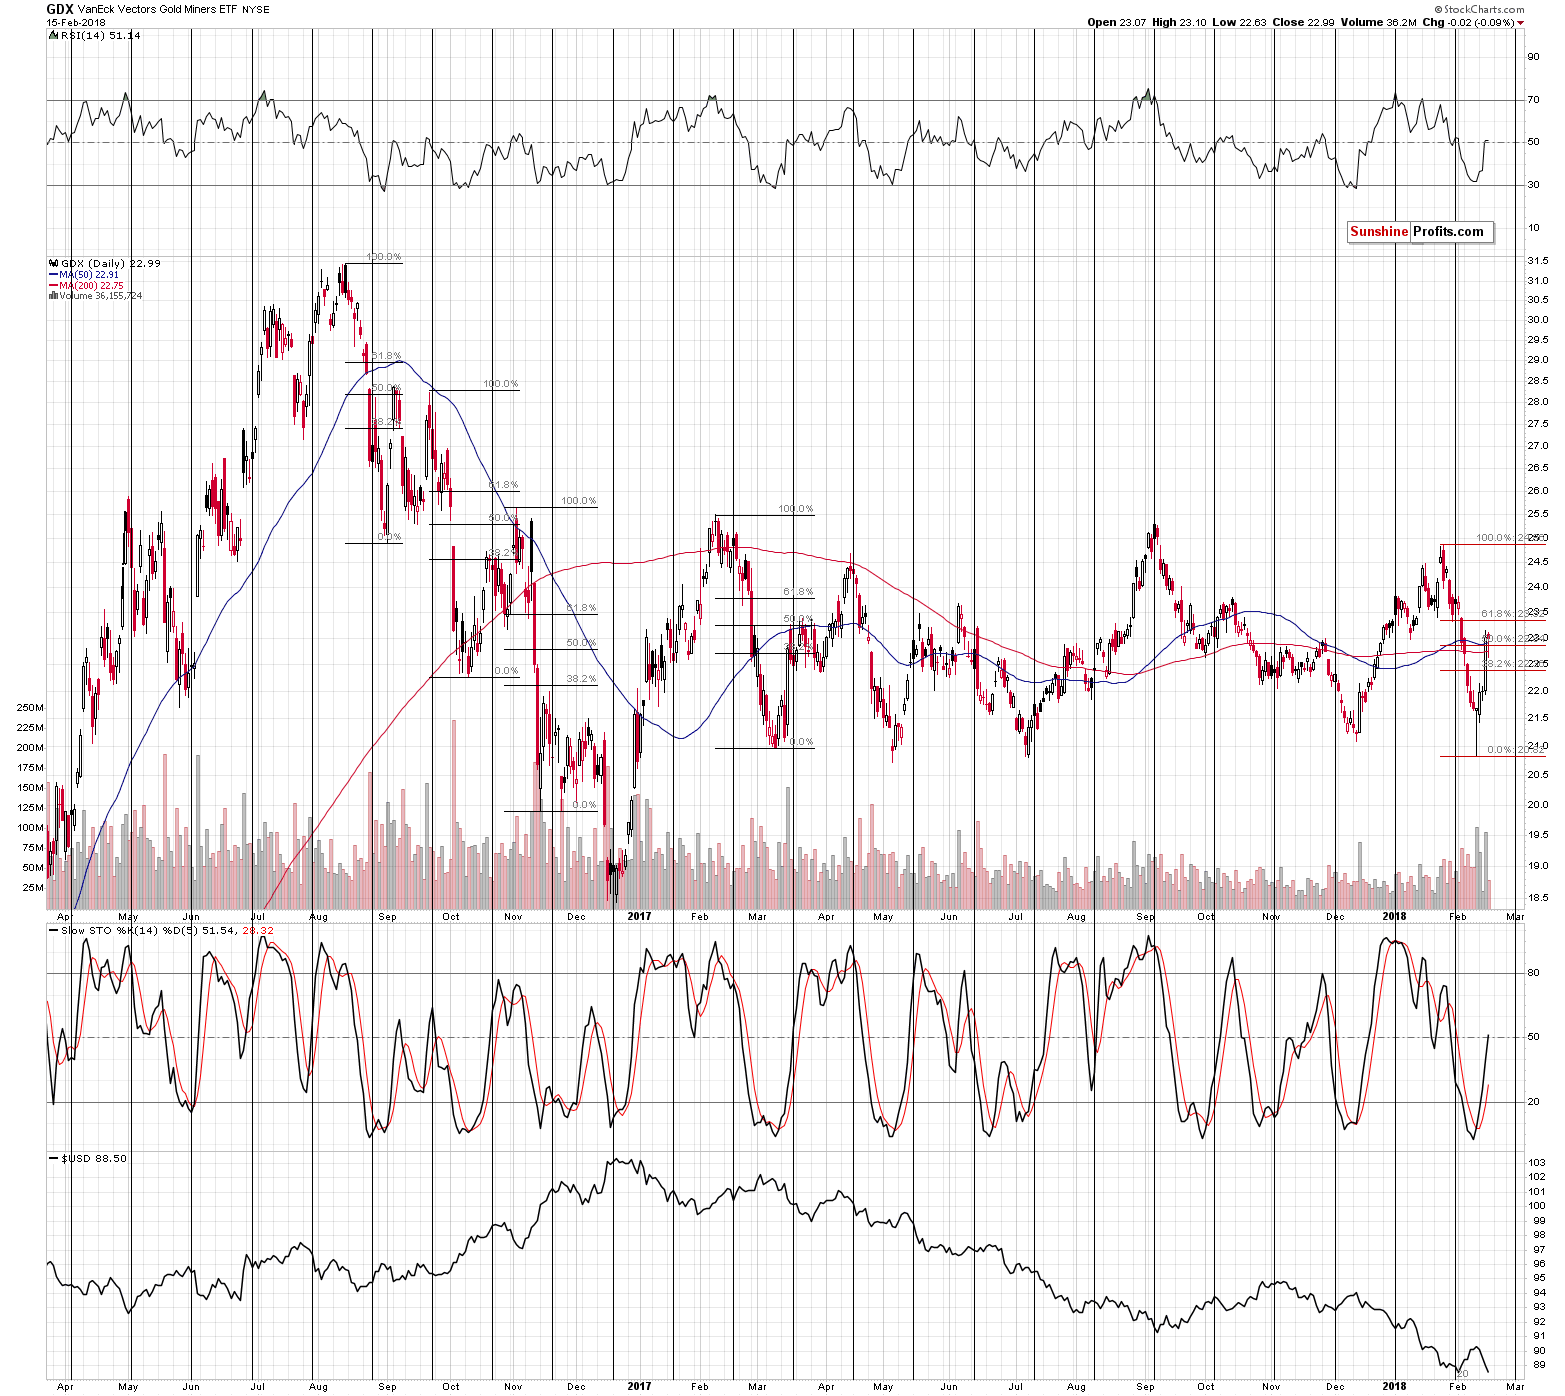
Today’s rally in the mining stocks may seem like the end of the world or at least like a tremendous change in the situation on the precious metals world. In reality, however, it’s something that we’ve seen multiple times - only not very recently.
The last big and volatile downswing that was followed by a sharp upswing in GDX was seen in February and March 2017. The upswing took miners to about 50% Fibonacci retracement, before stopping. The preceding similar situations took place in the second half of 2016. When GDX declined sharply in August, it rallied back up just a little above the 50% Fibonacci retracement. The decline that started in September corrected initially to the 38.2% retracement, but ended only after miners moved a bit above the 50% retracement. The November decline was corrected to the 38.2% retracement.
At this time, GDX corrected a bit more than 50% of the recent sharp decline, which is well in line with the historical norms for a volatile corrective upswing WITHIN a bigger decline. In other words, even though the mining stocks are up by about 5% today, it’s not necessarily a bullish sign.
During yesterday’s session, mining stocks were trading back and forth around the 50% Fibonacci retracement and two of their moving averages: the 50-day and 200-day one. The breakouts above all three resistance levels are not confirmed yet, so we might be currently seeing a topping pattern, just as the currency markets suggest.
Mining stocks ended the session a few cents below Wednesday’s closing price, which might be surprising given that the general stock market actually rallied.
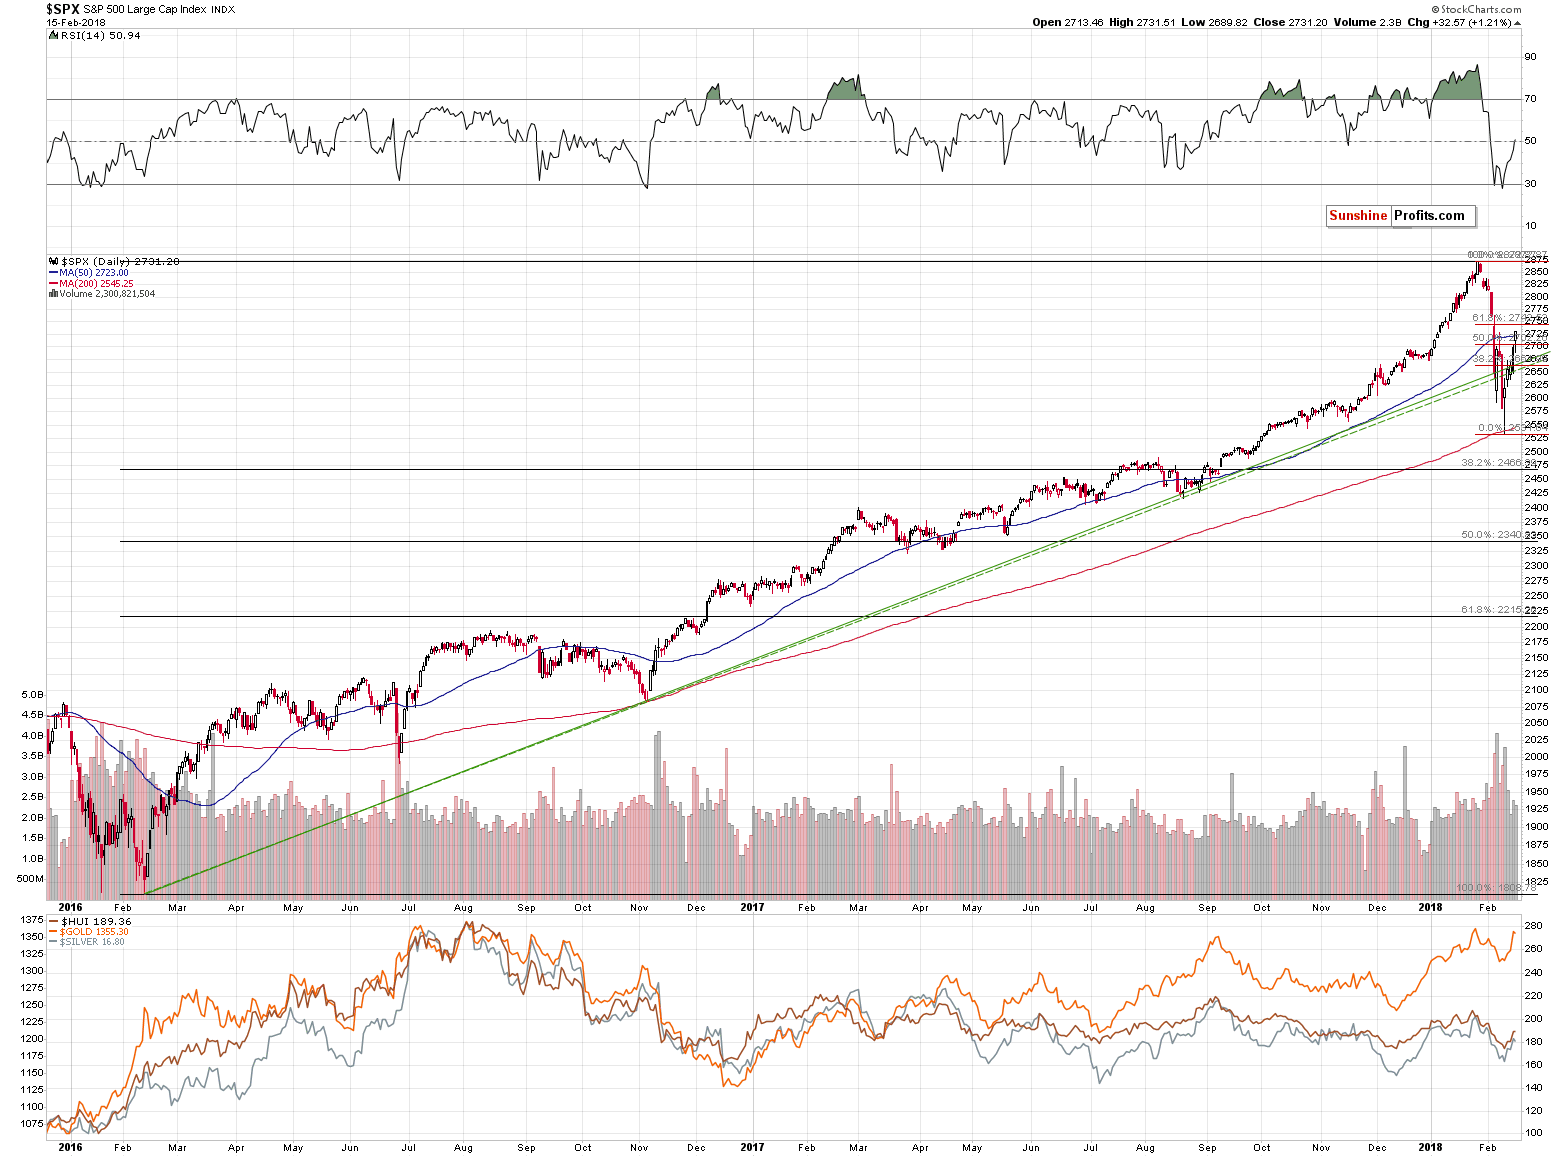
In yesterday’s alert, we wrote that it seemed that the effect that the general stock market had on mining stocks was wearing off. Based on yesterday’s session, we can say that what seemed to be the case, is indeed the case. Miners declined regardless of the general stock market’s rally. So, just like we indicated yesterday, the importance of main stock indices for us – precious metals investors and traders – is now lower. In fact, until we see a proof that the relationship is back, we shouldn’t count on it.
Summing up, the precious metals sector moved higher this week, but that is not – by itself – a bullish sign. PMs simply reacted to the very weak performance of the USD Index and since the USD Index just broke below the key support levels and invalidated this breakdown, it could be the case that the rally in metals and miners is over or about to end today. The Japanese yen just reached a combination of 2 important resistance levels, which could also cause the precious metals sector to decline. This is a combination of factors that favors short positions, not long ones.
If we’re lucky, we’ll see another small upswing in gold which is accompanied by a bigger daily rally in silver and disappointing performance in mining stocks. This would serve as a perfect bearish confirmation for the short term that would likely make us double the size of the current short position. At this time, however, the above is just a possibility, not a certainty, so we’ll need to keep monitoring the market and act accordingly.
As always, we will keep you – our subscribers – informed.
To summarize:
Trading capital (supplementary part of the portfolio; our opinion): Full short positions (100% of the full position) in gold, silver and mining stocks are justified from the risk/reward perspective with the following stop-loss orders and initial target price levels:
- Gold: initial target price: $1,218; stop-loss: $1,382; initial target price for the DGLD ETN: $53.98; stop-loss for the DGLD ETN $37.68
- Silver: initial target price: $14.63; stop-loss: $17.82; initial target price for the DSLV ETN: $33.88; stop-loss for the DSLV ETN $20.88
- Mining stocks (price levels for the GDX ETF): initial target price: $19.22; stop-loss: $26.14; initial target price for the DUST ETF: $39.88; stop-loss for the DUST ETF $15.78
In case one wants to bet on junior mining stocks' prices (we do not suggest doing so – we think senior mining stocks are more predictable in the case of short-term trades – if one wants to do it anyway, we provide the details), here are the stop-loss details and initial target prices:
- GDXJ ETF: initial target price: $27.82; stop-loss: $38.22
- JDST ETF: initial target price: $94.88 stop-loss: $37.78
Long-term capital (core part of the portfolio; our opinion): No positions (in other words: cash)
Insurance capital (core part of the portfolio; our opinion): Full position
Important Details for New Subscribers
Whether you already subscribed or not, we encourage you to find out how to make the most of our alerts and read our replies to the most common alert-and-gold-trading-related-questions.
Please note that the in the trading section we describe the situation for the day that the alert is posted. In other words, it we are writing about a speculative position, it means that it is up-to-date on the day it was posted. We are also featuring the initial target prices, so that you can decide whether keeping a position on a given day is something that is in tune with your approach (some moves are too small for medium-term traders and some might appear too big for day-traders).
Plus, you might want to read why our stop-loss orders are usually relatively far from the current price.
Please note that a full position doesn’t mean using all of the capital for a given trade. You will find details on our thoughts on gold portfolio structuring in the Key Insights section on our website.
As a reminder – “initial target price” means exactly that – an “initial” one, it’s not a price level at which we suggest closing positions. If this becomes the case (like it did in the previous trade) we will refer to these levels as levels of exit orders (exactly as we’ve done previously). Stop-loss levels, however, are naturally not “initial”, but something that, in our opinion, might be entered as an order.
Since it is impossible to synchronize target prices and stop-loss levels for all the ETFs and ETNs with the main markets that we provide these levels for (gold, silver and mining stocks – the GDX ETF), the stop-loss levels and target prices for other ETNs and ETF (among other: UGLD, DGLD, USLV, DSLV, NUGT, DUST, JNUG, JDST) are provided as supplementary, and not as “final”. This means that if a stop-loss or a target level is reached for any of the “additional instruments” (DGLD for instance), but not for the “main instrument” (gold in this case), we will view positions in both gold and DGLD as still open and the stop-loss for DGLD would have to be moved lower. On the other hand, if gold moves to a stop-loss level but DGLD doesn’t, then we will view both positions (in gold and DGLD) as closed. In other words, since it’s not possible to be 100% certain that each related instrument moves to a given level when the underlying instrument does, we can’t provide levels that would be binding. The levels that we do provide are our best estimate of the levels that will correspond to the levels in the underlying assets, but it will be the underlying assets that one will need to focus on regarding the signs pointing to closing a given position or keeping it open. We might adjust the levels in the “additional instruments” without adjusting the levels in the “main instruments”, which will simply mean that we have improved our estimation of these levels, not that we changed our outlook on the markets. We are already working on a tool that would update these levels on a daily basis for the most popular ETFs, ETNs and individual mining stocks.
Our preferred ways to invest in and to trade gold along with the reasoning can be found in the how to buy gold section. Additionally, our preferred ETFs and ETNs can be found in our Gold & Silver ETF Ranking.
As a reminder, Gold & Silver Trading Alerts are posted before or on each trading day (we usually post them before the opening bell, but we don't promise doing that each day). If there's anything urgent, we will send you an additional small alert before posting the main one.
=====
Latest Free Trading Alerts:
Do you like to see the market as an area of constant struggle between bulls and bears? Great. So do we! We invite you to read our today’s article about the historical bull and bear markets in the U.S. dollar and find out what do they imply for the future of the greenback and gold.
U.S. Dollar Bull and Bear Markets
=====
Hand-picked precious-metals-related links:
PRECIOUS-Gold hits 3-week high as dollar slides to lowest since 2014
Barrick Cuts Gold Output Forecast for Eighth Potential Drop
Asia Gold-India swings to discount as price jump hurts demand
Gold goes virtual on the blockchain
=====
In other news:
World shares set for best week since 2011, dollar hits lowest since 2014
Equities Power Higher as Treasury Yields Decline: Markets Wrap
ECB sees market volatility contained to stocks: Coeure
Selloff Grips Credit Funds as Rate Fears Ripple Through Markets
The SEC Just Blocked the Chinese Takeover of a U.S. Stock Exchange
China has boosted its huge stash of U.S. government debt
=====
Thank you.
Sincerely,
Przemyslaw Radomski, CFA
Founder, Editor-in-chief, Gold & Silver Fund Manager
Gold & Silver Trading Alerts
Forex Trading Alerts
Oil Investment Updates
Oil Trading Alerts

