

Briefly: in our opinion, full (300% of the regular position size) speculative short positions in junior mining stocks are justified from the risk/reward point of view at the moment of publishing this Alert.
Once again, almost nothing happened in the markets yesterday, so today’s technical part of the analysis is going to be brief.
In short, my Friday’s (extensive) comments remain up-to-date. The only thing that appears worth commenting on is yesterday’s lack of rally in junior mining stocks, despite the general stock market rally.
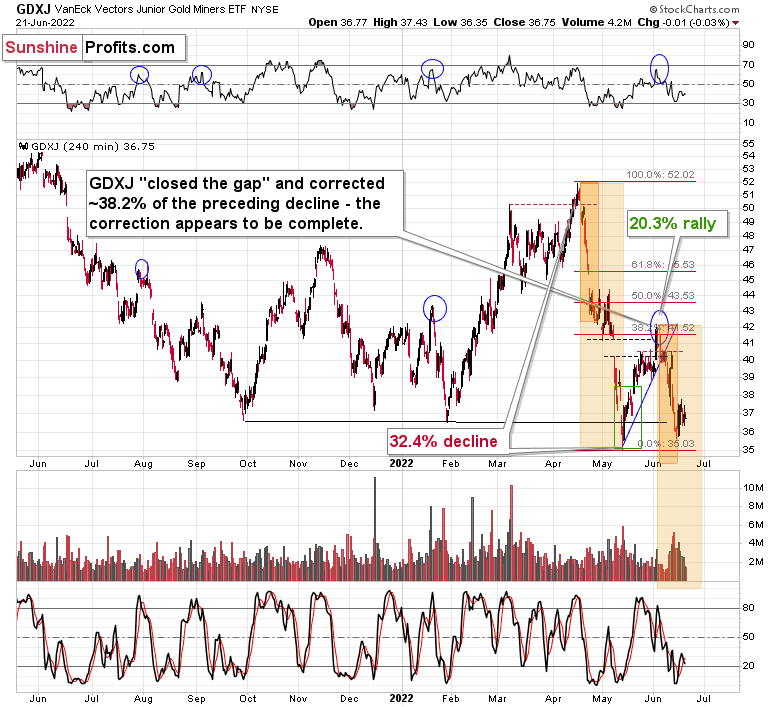
The GDXJ ETF was down by $0.01 yesterday, so it was practically flat.
Gold was slightly lower yesterday while the general stock market was up.
The ~2.5% rally in the S&P 500 Index was quite visible, and yet junior miners didn’t follow it higher. This is a sign of weakness and an indication that when gold declines more, junior miners will likely follow it lower, instead of focusing on the stock markets’ strength.
As a reminder, I don’t think that we’ll see much strength in stocks here – perhaps a temporary consolidation or a corrective upswing that will be nothing to write home about. Even if we see it, it’s unlikely to trigger a rally in the case of junior miners.
This means that the very bearish outlook that I’ve been describing for some time now remains up to date, and that the profits on our short positions in junior mining stocks are likely to increase in the coming weeks.
Having said that, let’s take a look at the markets from a more fundamental angle.
The Hangover
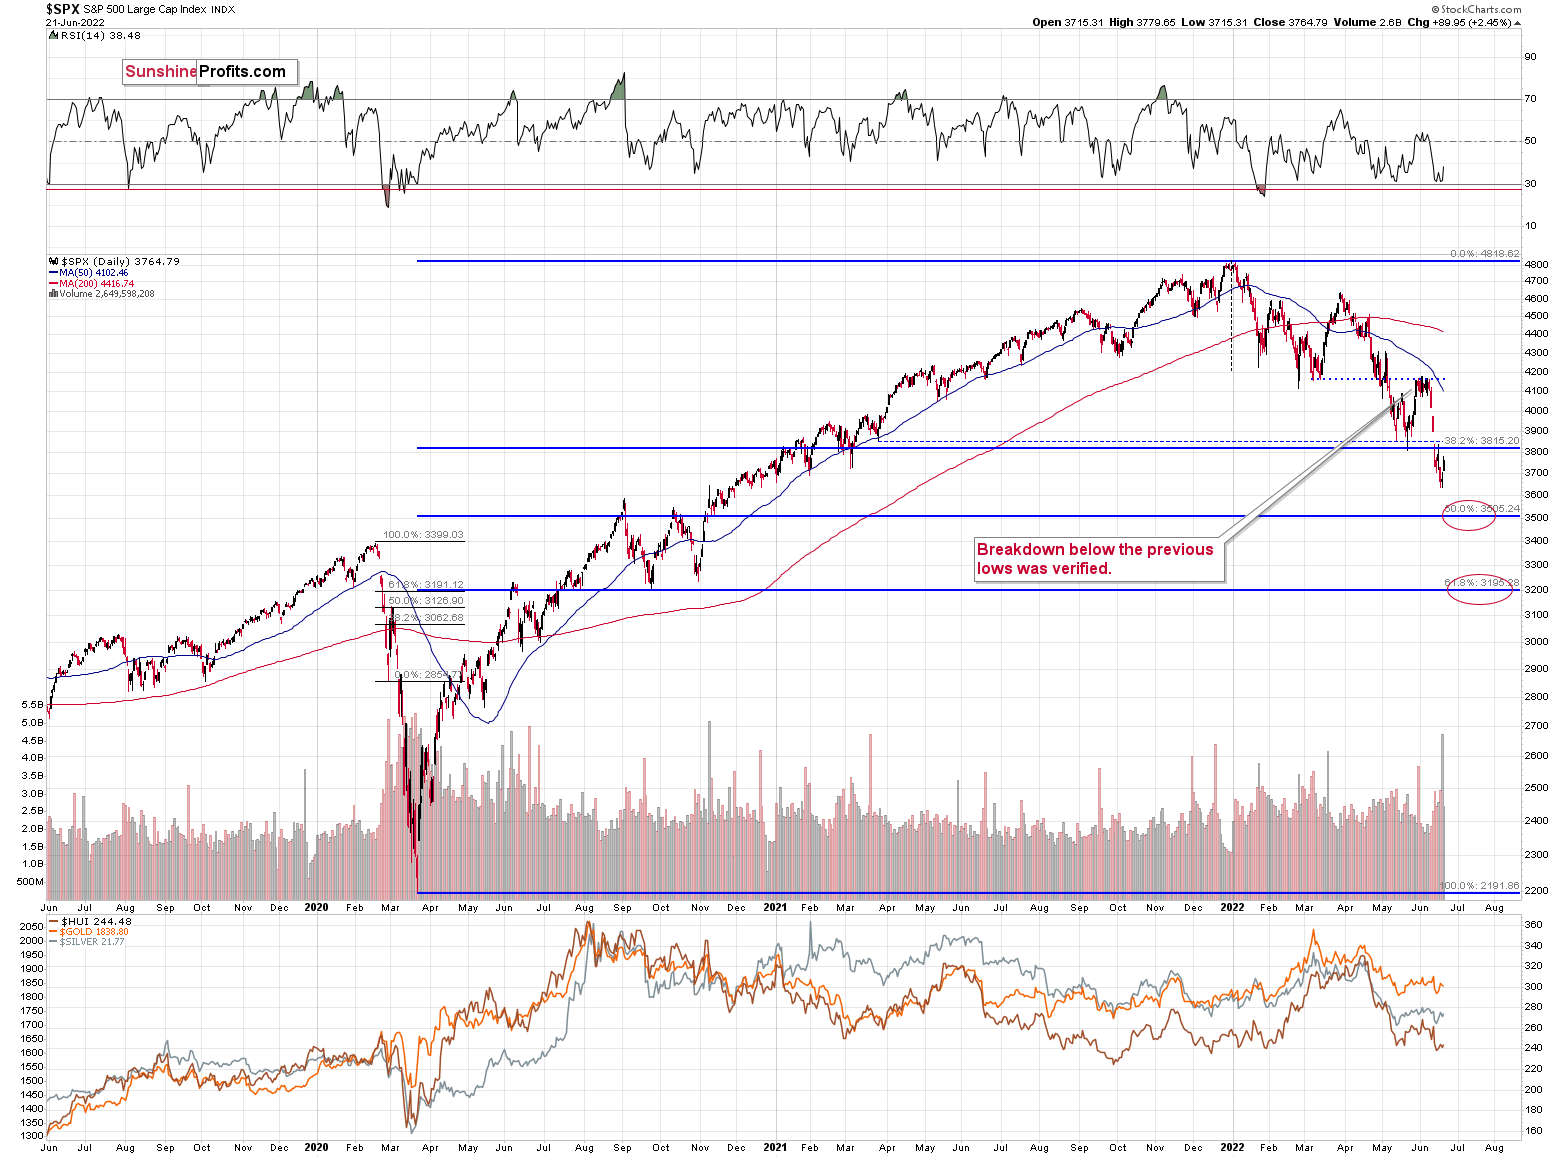
While investors orchestrated a relatively immaterial short squeeze on Jun. 21, the daily optimism did little to resolve the fundamental headwinds that helped foster the S&P 500's 2022 collapse. Moreover, with the GDXJ ETF not participating in the festivities, the junior miners have fallen off investors' wish lists. Therefore, while the former's price action may have been bullish, the medium-term realities are far from it.
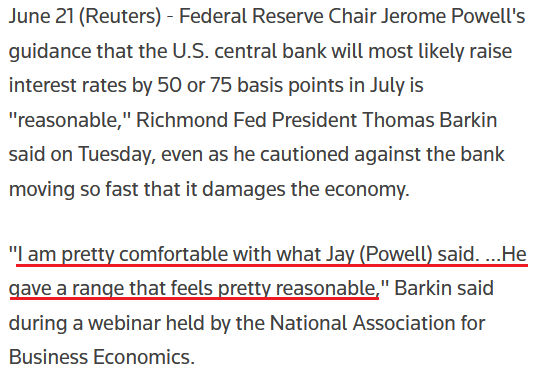
For example, Richmond Fed President Thomas Barkin said on Jun. 21: "We are in a situation where inflation is high, it's broad-based, it's persistent, and rates are still well below normal. The spirit is, you want to get back to where you want to go as fast as you can without breaking anything."
As a result, Barkin is on board with Chairman Jerome Powell's call for a 50 or 75 basis point rate hike in July.
Please see below:
 Source: Reuters
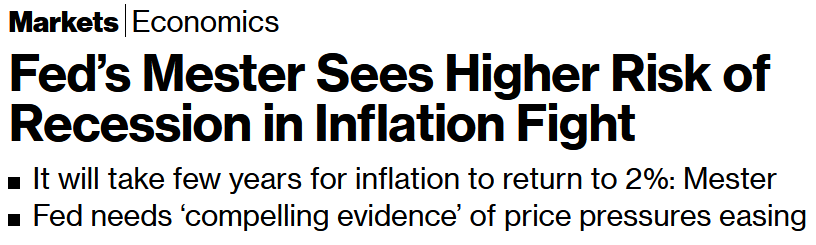
Likewise, Cleveland Fed President Loretta Mester said on Jun. 19 that “We at the Fed are very committed to using the tools at our disposal to bring this inflation under control and getting back to 2% is the No. 1 challenge in the economy now.”
Moreover, she also admitted:
“The recession risks are going up partly because monetary policy could have pivoted a little bit earlier than it did. We do have growth slowing to a little bit below trend growth and that’s okay.”
Thus, Fed officials are starting to acknowledge reality:
 Source: Bloomberg
To that point, while “below trend growth” may be “okay” for now, further rate hikes will continue to pressure the U.S. economy. Moreover, all periods of unanchored inflation end in recession. For context, I wrote on May 26:
While 50 basis point rate hikes are likely to be done deals in June and July, a realization will only put the U.S. federal funds rate at 1.83%. With annualized inflation at 8%+, calming the price pressures with such little action is completely unrealistic. In fact, it’s never happened.
If you analyze the chart below, you can see that the U.S. federal funds rate (the green line) nearly always rises above the year-over-year (YoY) percentage change in the headline Consumer Price Index (the red line) to curb inflation. Therefore, investors are kidding themselves if they think the Fed is about to re-write history.
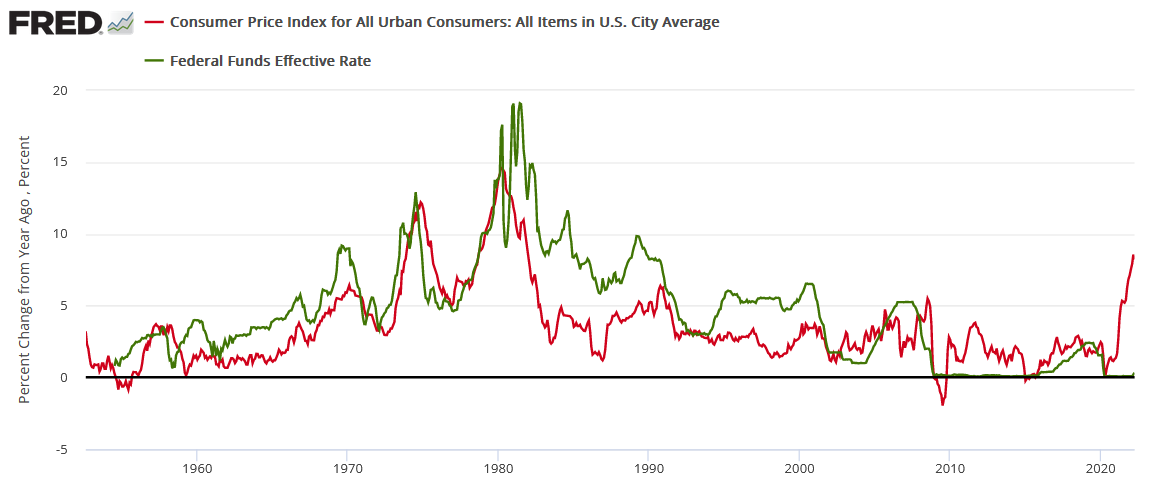
(…) The bottom line? Investors are running towards a cliff, and they don’t even know it. With nearly 70 years of history showing that unanchored inflation ends in a recession, the idea of doing so little and achieving a “soft landing” materially lacks credibility.
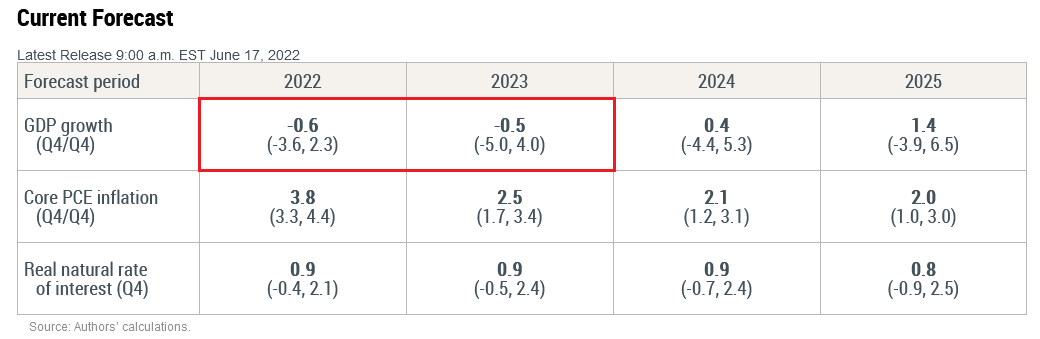
Supporting the thesis, Liberty Street Economics updated its dynamic stochastic general equilibrium (DSGE) model on Jun. 17. For context, the report includes “analysis from New York Fed economists working at the intersection of research and policy.”
Therefore, while the report was compiled by New York Fed researchers, “the views expressed are those of the authors, and do not necessarily reflect the position of the New York Fed or the Federal Reserve System.”
In any event, an excerpt read:
“According to the model, the probability of a soft landing – defined as four-quarter GDP growth staying positive over the next ten quarters – is only about 10 percent. Conversely, the chances of a hard landing – defined to include at least one quarter in the next ten in which four-quarter GDP growth dips below -1 percent, as occurred during the 1990 recession – are about 80 percent.”
Likewise, the team expects negative GDP growth in 2022 and 2023; and not only do they model an “80 percent” chance of a hard landing, but the downtrend is expected to continue for several months.
Please see below:
 Source: New York Fed
Therefore, while short-covering and the algorithms helped spur a relief rally, the Fed’s rate hike cycle should upend investors’ optimism in the months ahead. As a result, the S&P 500 and the PMs are likely to be far from medium-term bottoms.
Fuel for the Hawkish Fire
While I warned for months that investors and the Fed underestimated the demand side of the inflation equation, consumers' resiliency highlighted why the pricing pressures would not subside. As a result, the Fed would have to hike interest rates, and the forecast proved prescient.
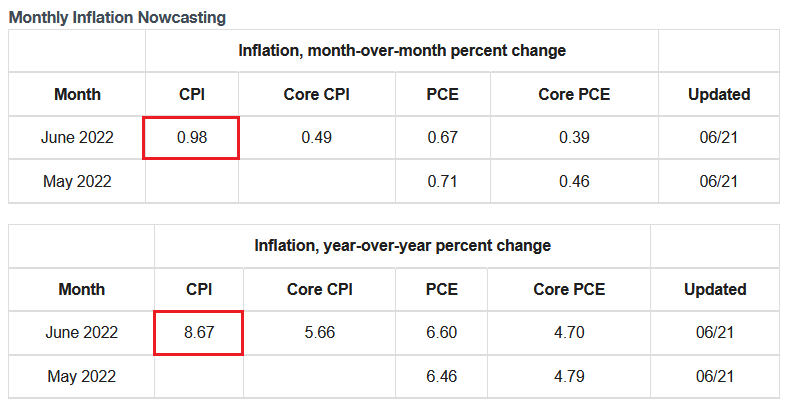
Furthermore, nothing has changed. With the Cleveland Fed updating its inflation "Nowcast" on Jun. 21, researchers expect the headline Consumer Price Index (CPI) to increase by 0.98% month-over-month (MoM) and 8.67% year-over-year (YoY) in June. Thus, the Fed is far from winning its war on inflation.
Please see below:
 Source: Cleveland Fed
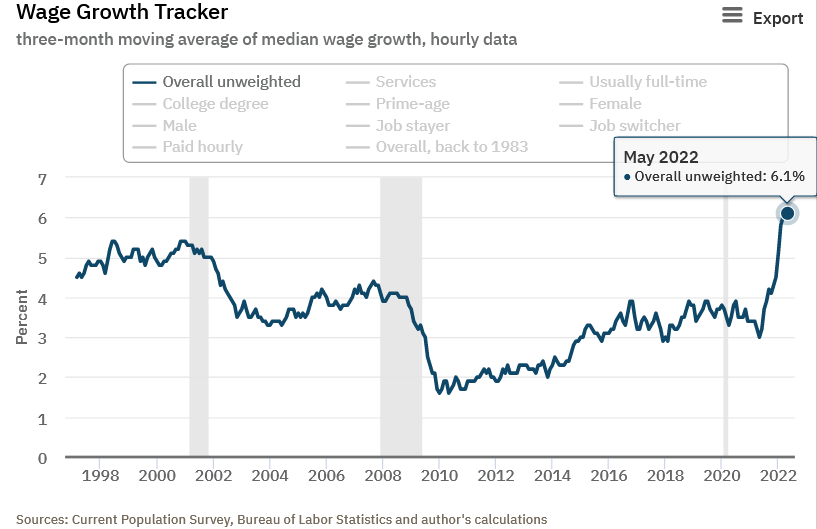
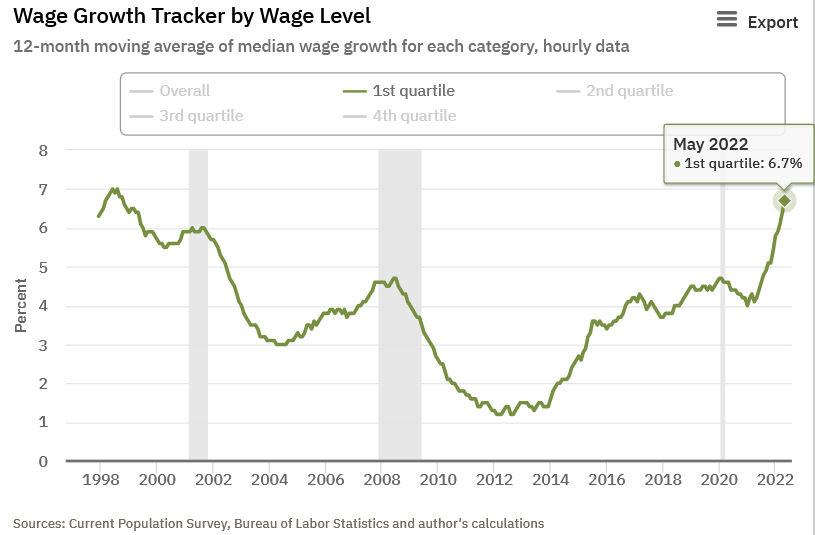
Second, the Atlanta Fed updated its wage tracker on Jun. 9. The data shows that consolidated wage inflation hit an all-time high in May.
Please see below:
Moreover, the lowest-paid Americans outperformed, and the data highlights why consumer spending continues to fuel more price increases.
Please see below:
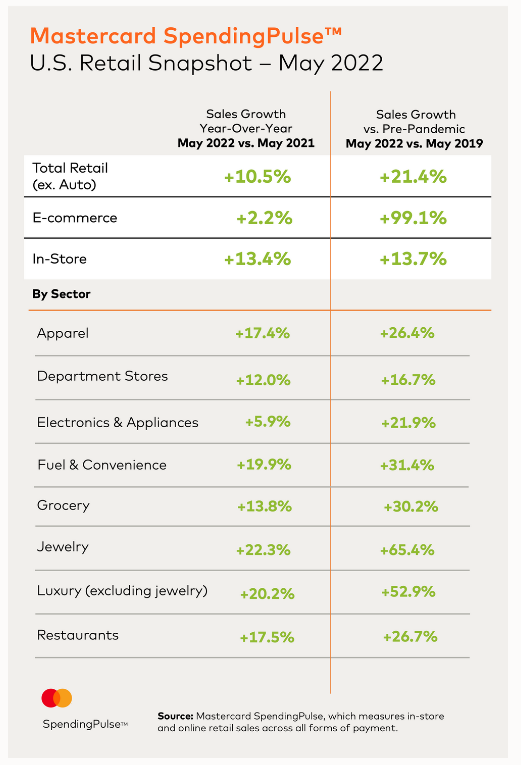
Speaking of which, Mastercard released its SpendingPulse retail sales report on Jun. 14. An excerpt read:
“Total U.S. retail sales excluding automotives increased 10.5% year-over-year in May, and 21.4% compared to pre-pandemic May 2019. This is outpacing the YoY monthly growth experienced thus far in 2022. In-store sales were a key driver, up 13.7% compared to pre-pandemic levels.”
U.S. Chief Economist Michelle Meyer said:
“The continued retail sales momentum in May aligns with the sustained growth rates we’ve seen so far this year. The consumer has been resilient, spending on goods and increasingly services as the economy continues to rebalance. That said, headwinds have become stronger – including gains in prices for necessities like gas and food, as well as higher interest rates."
Thus, while investors cry wolf about demand destruction, Mastercard’s data suggests otherwise. Moreover, the report highlights why more rate hikes are needed to cool inflation, and the prospect is bullish for the USD Index and U.S. real yields, and bearish for the PMs.
Please see below:
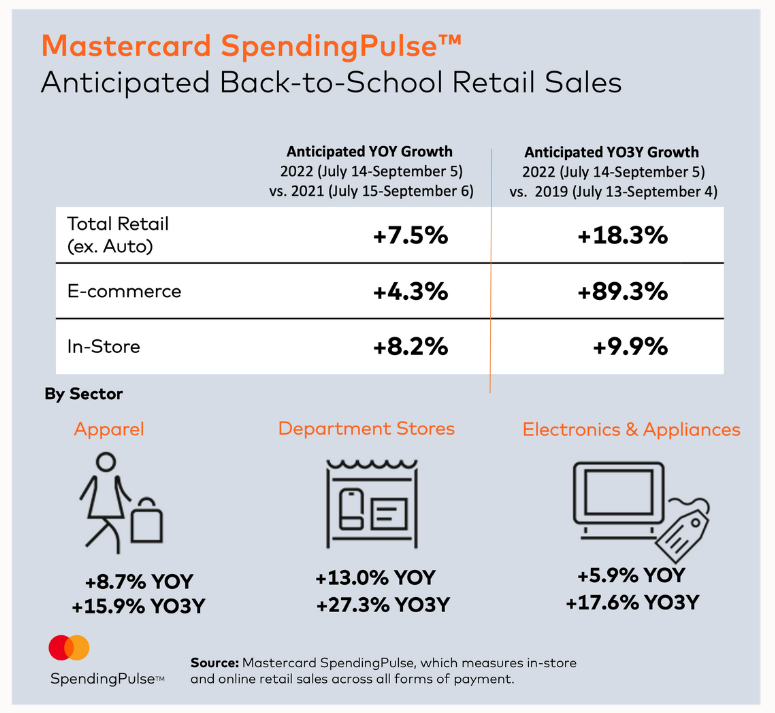
Likewise, Mastercard expects back-to-school sales to remain resilient in the months ahead. Therefore, such a realization will only add more fuel to the hawkish fire. The report stated:
“As we look ahead to the critical mid-July through Labor Day back-to-school period, U.S. retail sales are expected to grow 7.5% excluding automotive compared to 2021. Sales are anticipated to be up 18.3% compared to pre-pandemic 2019, with Department Stores expected to be a noteworthy winner as the sector continues its recent rebound.”
Please see below:
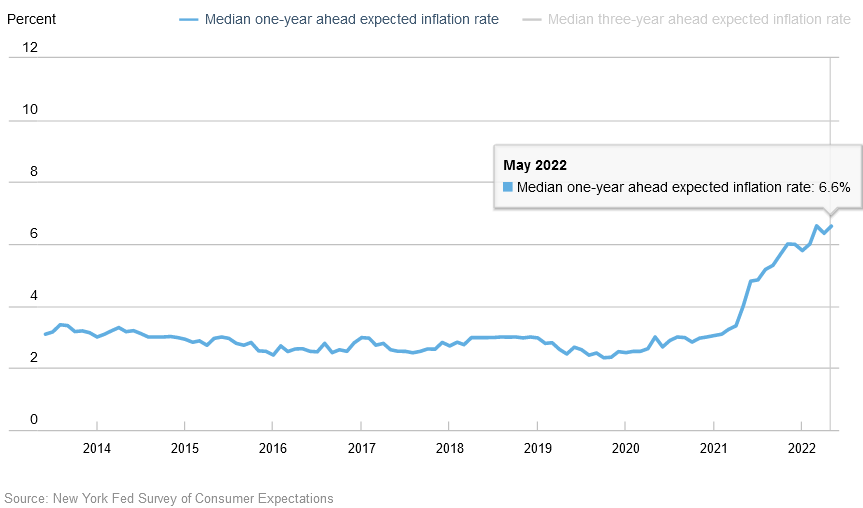
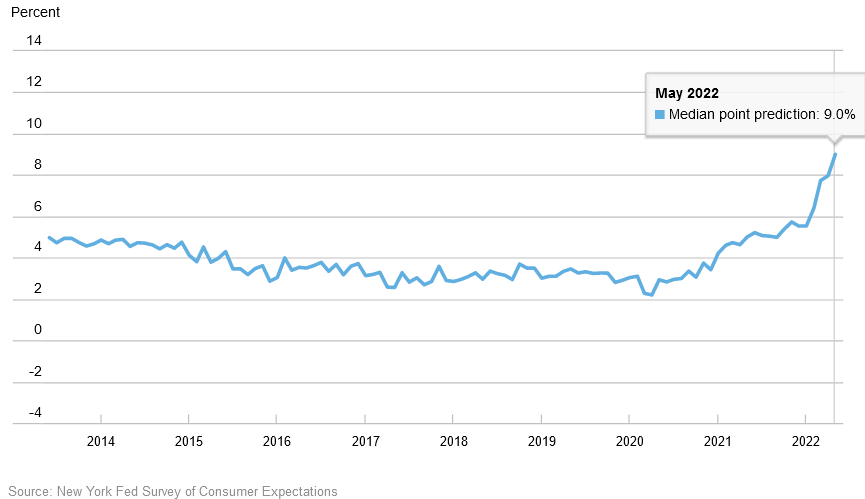
As further evidence, the New York Fed released its Survey of Consumer Expectations on Jun. 13. The report revealed:
“The one-year ahead median inflation expectations increased from 6.3% to 6.6% in May, tying the highest reading of the series since the inception of the survey in June 2013. In contrast, the median three-year-ahead inflation expectations remained unchanged at 3.9%.”
Please see below:
More importantly:
“Median household nominal spending growth expectations increased sharply to 9.0% from 8.0% in April. This is the fifth consecutive increase and a new series high. The increase was most pronounced for respondents between the age of 40 and 60 and respondents without a college education.”
Please see below:
Also noteworthy:
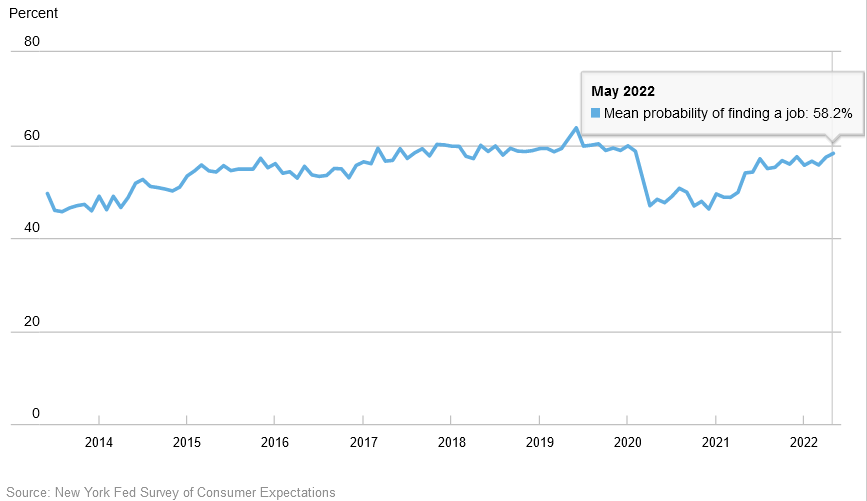
“The mean perceived probability of finding a job (if one’s current job was lost) increased from 57.4% in April to 58.2%, its highest value since February 2020. The increase was driven by respondents over 40, those without a college education and those with lower household incomes (under $50,000).”
As a result, when Americans are confident about their employment prospects and wages are rising rapidly, the cocktail is profoundly inflationary. Moreover, when you add on Americans' bloated bank accounts, it's no wonder inflation proved much longer-lasting than many expected. To explain, I wrote on Dec. 23:
While the fiscal spending spree may end, U.S. households are flush with cash. U.S. households have nearly $3.54 trillion in their checking accounts. For context, this is 253% more than Q4 2019 (pre-COVID-19) (…).
While some investors expect a dovish 180 from the Fed, they shouldn’t hold their breath. With U.S. economic growth still resilient and the U.S. consumer in much better shape than some portray, the Fed can raise interest rates without crashing the U.S. economy. As a result, Powell will likely stick to his hawkish script and forge ahead with rate hikes in 2022.
I updated on Jun. 10:
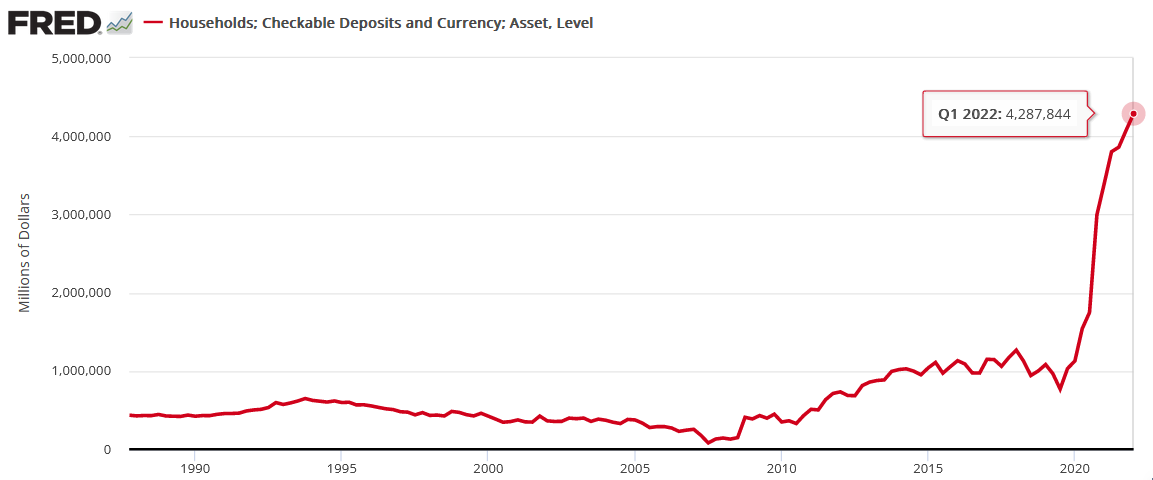
While the prediction proved prescient, U.S. households, on aggregate, are still flush with cash. For example, the Fed released its Financial Accounts of the United States report on Jun. 9. It revealed that U.S. households have nearly $4.288 trillion in their checking accounts as of the end of Q1. Moreover, the figure is 5.1% higher than Q4:2021.
For the sake of objectivity, the data lags by roughly two months. However, with the metric at an unprecedented all-time high, U.S. consumers still have plenty of spending power. As a result, more hawkish policy is needed to create the demand destruction necessary to tame inflation.
Please see below:
The Bottom Line
Despite the S&P 500’s daily optimism, the Fed’s catch-22 is worsening by the day. With GDP growth slowing and the U.S. housing market suffering mightily from higher interest rates, signs of stress are present. In contrast, with U.S. consumers continuing their spending spree, inflationary demand keeps shifting from one category to the next. Thus, the Fed is stuck trying to balance these competing forces. However, the road to recession has likely already been paved, and material re-pricings are necessary for assets to reflect their fundamental values.
In conclusion, the PMs were mixed on Jun. 21, as silver and the GDX ETF ended the day in the green. However, with the Fed hawked up and rate hikes on autopilot for the foreseeable future, the PMs’ medium-term outlooks are profoundly bearish. As a result, summer swoons should be on the horizon.
Overview of the Upcoming Part of the Decline
- It seems to me that the very-short-term rally in the precious metals market is either over or very close to being over. It’s so close to being over that I think it’s already a good idea to be shorting junior mining stocks.
- We’re likely to (if not immediately, then soon) see another big slide, perhaps close to the 2021 lows ($1,650 - $1,700).
- If we see a situation where miners slide in a meaningful and volatile way while silver doesn’t (it just declines moderately), I plan to – once again – switch from short positions in miners to short positions in silver. At this time, it’s too early to say at what price levels this could take place and if we get this kind of opportunity at all – perhaps with gold prices close to $1,600.
- I plan to exit all remaining short positions once gold shows substantial strength relative to the USD Index while the latter is still rallying. This may be the case with gold close to $1,400. I expect silver to fall the hardest in the final part of the move. This moment (when gold performs very strongly against the rallying USD and miners are strong relative to gold after its substantial decline) is likely to be the best entry point for long-term investments, in my view. This can also happen with gold close to $1,400, but at the moment it’s too early to say with certainty.
- The above is based on the information available today, and it might change in the following days/weeks.
You will find my general overview of the outlook for gold on the chart below:
Please note that the above timing details are relatively broad and “for general overview only” – so that you know more or less what I think and how volatile I think the moves are likely to be – on an approximate basis. These time targets are not binding or clear enough for me to think that they should be used for purchasing options, warrants, or similar instruments.
Letters to the Editor
Q: Is it prudent to use DUST to take advantage of the miners’ decline? You refer to JDST. What are the advantages / disadvantages of DUST and JDST?
A: DUST is an inverse, 2x leveraged instrument that’s based on the GDX ETF (it magnifies and inverses its performance. So, it’s a proxy for betting on senior mining prices’ decline.
The JDST is an inverse, 2x leveraged instrument that’s based on the GDXJ ETF (it magnifies and inverses its performance. So, it’s a proxy for betting on junior mining prices’ decline.
So, it’s not a matter of prudence, but rather of preference – whether one prefers to bet on senior miners’ decline or junior miners’ decline. In my opinion, the profitability potential for the short position in junior mining stocks is bigger, which is why I’m mentioning shorting GDXJ or using JDST for this trade.
However, it’s up to you to decide if you’d like to participate in this trade, and if so, what proxy to use. Please note that due to the 2x leverage, both: DUST and JDST are more volatile and risky than simply shorting GDXJ. Simply shorting GDXJ might be a better option (less risky) for many traders, especially beginning ones.
Summary
Summing up, it seems to me that the short-term rally in the precious metals market is over, and the decline will now continue. And the tiny correction’s days are likely numbered, too.
I previously wrote that the profits from the previous long position (congratulations once again) were likely to further enhance the profits on this huge decline, and that’s exactly what happened. The profit potential with regard to the upcoming gargantuan decline remains huge.
As investors are starting to wake up to reality, the precious metals sector (particularly junior mining stocks) is declining sharply. Here are the key aspects of the reality that market participants have ignored:
- rising real interest rates,
- rising USD Index values.
Both of the aforementioned are the two most important fundamental drivers of the gold price. Since neither the USD Index nor real interest rates are likely to stop rising anytime soon (especially now that inflation has become highly political), the gold price is likely to fall sooner or later. Given the analogy to 2012 in gold, silver, and mining stocks, “sooner” is the more likely outcome.
After the final sell-off (that takes gold to about $1,350-$1,500), I expect the precious metals to rally significantly. The final part of the decline might take as little as 1-5 weeks, so it's important to stay alert to any changes.
As always, we'll keep you – our subscribers – informed.
To summarize:
Trading capital (supplementary part of the portfolio; our opinion): Full speculative short positions (300% of the full position) in junior mining stocks are justified from the risk to reward point of view with the following binding exit profit-take price levels:
Mining stocks (price levels for the GDXJ ETF): binding profit-take exit price: $27.32; stop-loss: none (the volatility is too big to justify a stop-loss order in case of this particular trade)
Alternatively, if one seeks leverage, we’re providing the binding profit-take levels for the JDST (2x leveraged). The binding profit-take level for the JDST: $18.35; stop-loss for the JDST: none (the volatility is too big to justify a SL order in case of this particular trade).
For-your-information targets (our opinion; we continue to think that mining stocks are the preferred way of taking advantage of the upcoming price move, but if for whatever reason one wants / has to use silver or gold for this trade, we are providing the details anyway.):
Silver futures downside profit-take exit price: $17.22
SLV profit-take exit price: $16.22
ZSL profit-take exit price: $41.47
Gold futures downside profit-take exit price: $1,706
HGD.TO – alternative (Canadian) 2x inverse leveraged gold stocks ETF – the upside profit-take exit price: $11.87
HZD.TO – alternative (Canadian) 2x inverse leveraged silver ETF – the upside profit-take exit price: $31.87
Long-term capital (core part of the portfolio; our opinion): No positions (in other words: cash)
Insurance capital (core part of the portfolio; our opinion): Full position
Whether you’ve already subscribed or not, we encourage you to find out how to make the most of our alerts and read our replies to the most common alert-and-gold-trading-related-questions.
Please note that we describe the situation for the day that the alert is posted in the trading section. In other words, if we are writing about a speculative position, it means that it is up-to-date on the day it was posted. We are also featuring the initial target prices to decide whether keeping a position on a given day is in tune with your approach (some moves are too small for medium-term traders, and some might appear too big for day-traders).
Additionally, you might want to read why our stop-loss orders are usually relatively far from the current price.
Please note that a full position doesn't mean using all of the capital for a given trade. You will find details on our thoughts on gold portfolio structuring in the Key Insights section on our website.
As a reminder - "initial target price" means exactly that - an "initial" one. It's not a price level at which we suggest closing positions. If this becomes the case (as it did in the previous trade), we will refer to these levels as levels of exit orders (exactly as we've done previously). Stop-loss levels, however, are naturally not "initial", but something that, in our opinion, might be entered as an order.
Since it is impossible to synchronize target prices and stop-loss levels for all the ETFs and ETNs with the main markets that we provide these levels for (gold, silver and mining stocks - the GDX ETF), the stop-loss levels and target prices for other ETNs and ETF (among other: UGL, GLL, AGQ, ZSL, NUGT, DUST, JNUG, JDST) are provided as supplementary, and not as "final". This means that if a stop-loss or a target level is reached for any of the "additional instruments" (GLL for instance), but not for the "main instrument" (gold in this case), we will view positions in both gold and GLL as still open and the stop-loss for GLL would have to be moved lower. On the other hand, if gold moves to a stop-loss level but GLL doesn't, then we will view both positions (in gold and GLL) as closed. In other words, since it's not possible to be 100% certain that each related instrument moves to a given level when the underlying instrument does, we can't provide levels that would be binding. The levels that we do provide are our best estimate of the levels that will correspond to the levels in the underlying assets, but it will be the underlying assets that one will need to focus on regarding the signs pointing to closing a given position or keeping it open. We might adjust the levels in the "additional instruments" without adjusting the levels in the "main instruments", which will simply mean that we have improved our estimation of these levels, not that we changed our outlook on the markets. We are already working on a tool that would update these levels daily for the most popular ETFs, ETNs and individual mining stocks.
Our preferred ways to invest in and to trade gold along with the reasoning can be found in the how to buy gold section. Furthermore, our preferred ETFs and ETNs can be found in our Gold & Silver ETF Ranking.
As a reminder, Gold & Silver Trading Alerts are posted before or on each trading day (we usually post them before the opening bell, but we don't promise doing that each day). If there's anything urgent, we will send you an additional small alert before posting the main one.
Thank you.
Przemyslaw Radomski, CFA
Founder, Editor-in-chief

