

Briefly: in our opinion, full (200% of the regular size of the position) speculative short positions in gold, silver and mining stocks are justified from the risk/reward perspective at the moment of publishing this alert.
The top in the precious metals market is in and there’s no doubt about it. Many daily gains were erased during just one session and those who were prepared profited significantly. You were. Still, let’s keep in mind that no trade is definitely good or bad until its completed. The question, therefore, is if we are close to a good exit price for this trade, are there no meaningful support levels nearby that could trigger a corrective upswing? In other words, the question is about gold’s near-term downside target. The even more important follow-up is what to do with this knowledge – should one prepare to exit the short position shortly, or should one see right through the correction?
Let’s take a closer look at the charts for details, starting with gold’s long-term picture.
Gold’s Outlook and Targets
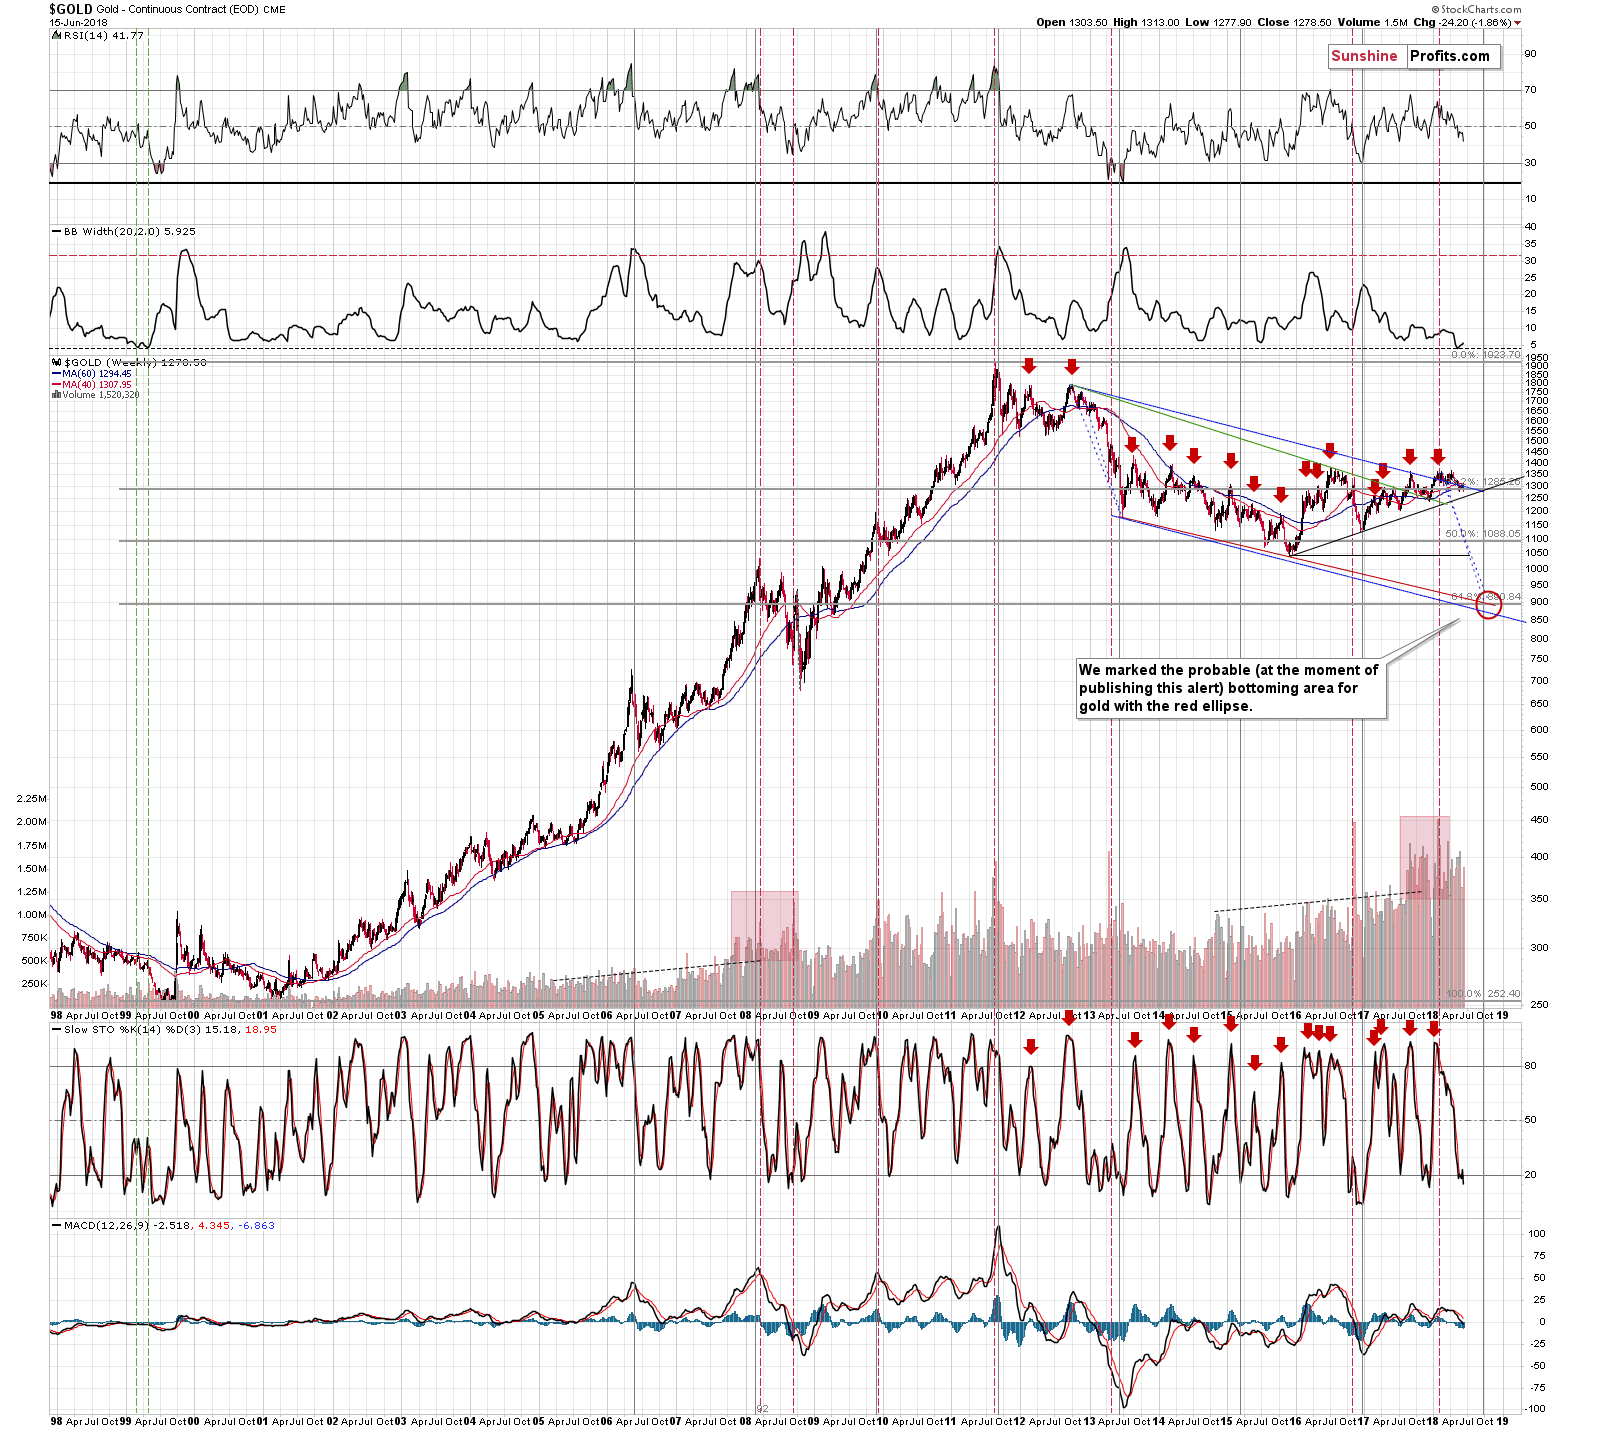
The key thing that we can infer from the long-term chart is that there is quite little time for gold to decline according to the self-similar pattern with 2012-2013 (blue dashed lines), the apex of the long-term triangle pattern, long-term cycle (vertical black line) and the combination of support levels close to $900: 61.8% Fibonacci retracement, and the lower border of the declining trend channel.
Little time means that if the price/time target of about $900 in the late September or early October 2018 is to be upheld, then we are likely to see decline’s acceleration shortly. This implies that any corrective upswings that we see before the final bottom are likely to be short-lived.
The width of the Bollinger Band also moved a bit higher after reaching extremely low level, which is in tune with only one such time from the recent history. That’s what we saw before the final decline in 1999. The implications are very bearish.
Yet, we also see a medium-term support line that’s based on important bottoms – the late 2015 and the late 2016 ones. That’s the most significant support besides the above-mentioned bottoms that we have nearby, so it’s something that could indeed trigger a corrective move. Let’s examine it more closely by zooming in.
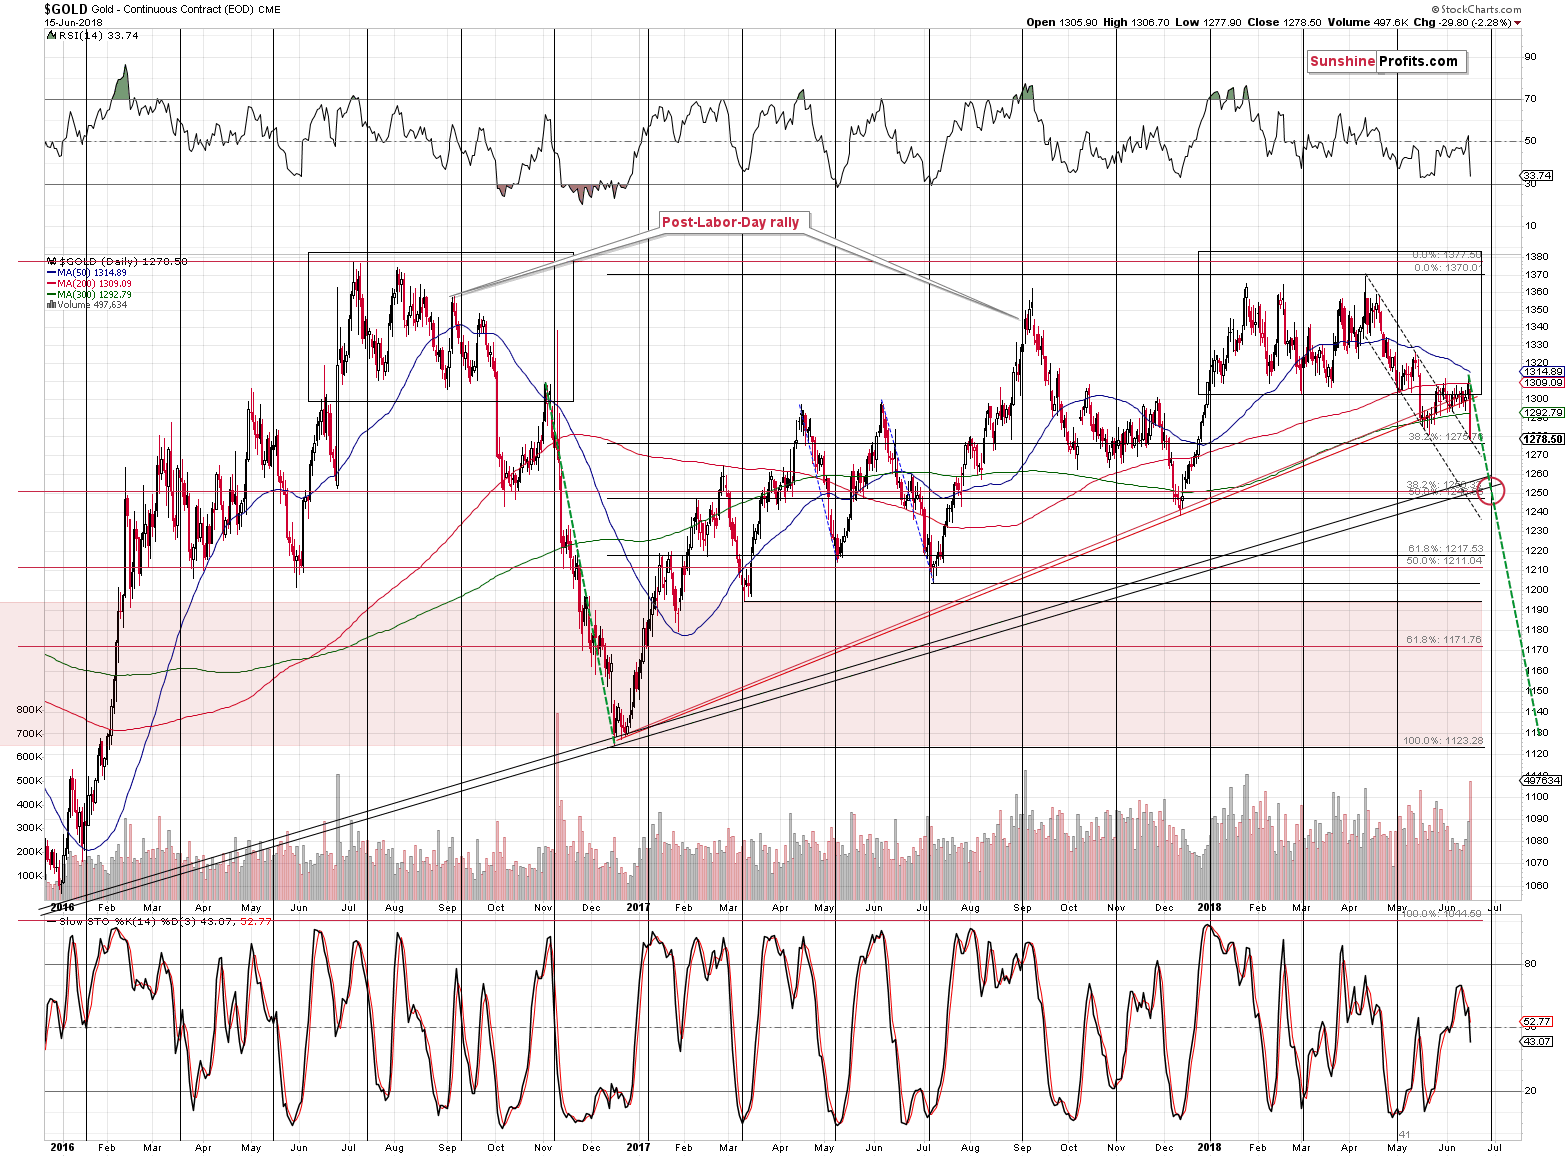
There are actually two lines not one. The upper line is based on the above-mentioned bottoms in terms of the daily closing prices and the lower one is based on the intraday lows. The latter is more significant for intraday moves and the former for the closing prices and together they provide us with a target area of $1,250 - $1,260.
But, will gold really bounce from it? It’s been consolidating for several weeks, so it may want to decline by more than $60 before correcting. This is especially the case in light of the analogy to gold’s performance in the second half of 2016.
We marked the similar areas with black rectangles. Please note the multi-top pattern at similar price levels, breakdown below the previous lows (early October 2016 and mid-May 2018), and then a move back to (and even slightly above) them. Now the decline continues, just like it did in November 2016. Back then the initial breakdown and the subsequent follow-up were more volatile and this may or may not be the case this time. What is definitely likely, however, is that the decline will continue and that the continuation will be at least as big (approximately) as the decline that what we’ve seen so far.
On the above chart, the green dashed line estimates the likely maximum medium-term size of the move based on the above analogy and if we simply double the size of the current decline so far, we’ll get $1,200 as the downside target.
The $1,200 level is supported by previous lows and the proximity to the 61.8% Fibonacci retracement level based on the December 2016 – April 2018 rally.
As far as the time factor is concerned, there is gold’s turning point scheduled for June 27th.
Speaking of time and turning points, let’s take a look at the nearby long-term apex-based reversals.
Apex-based Reversals
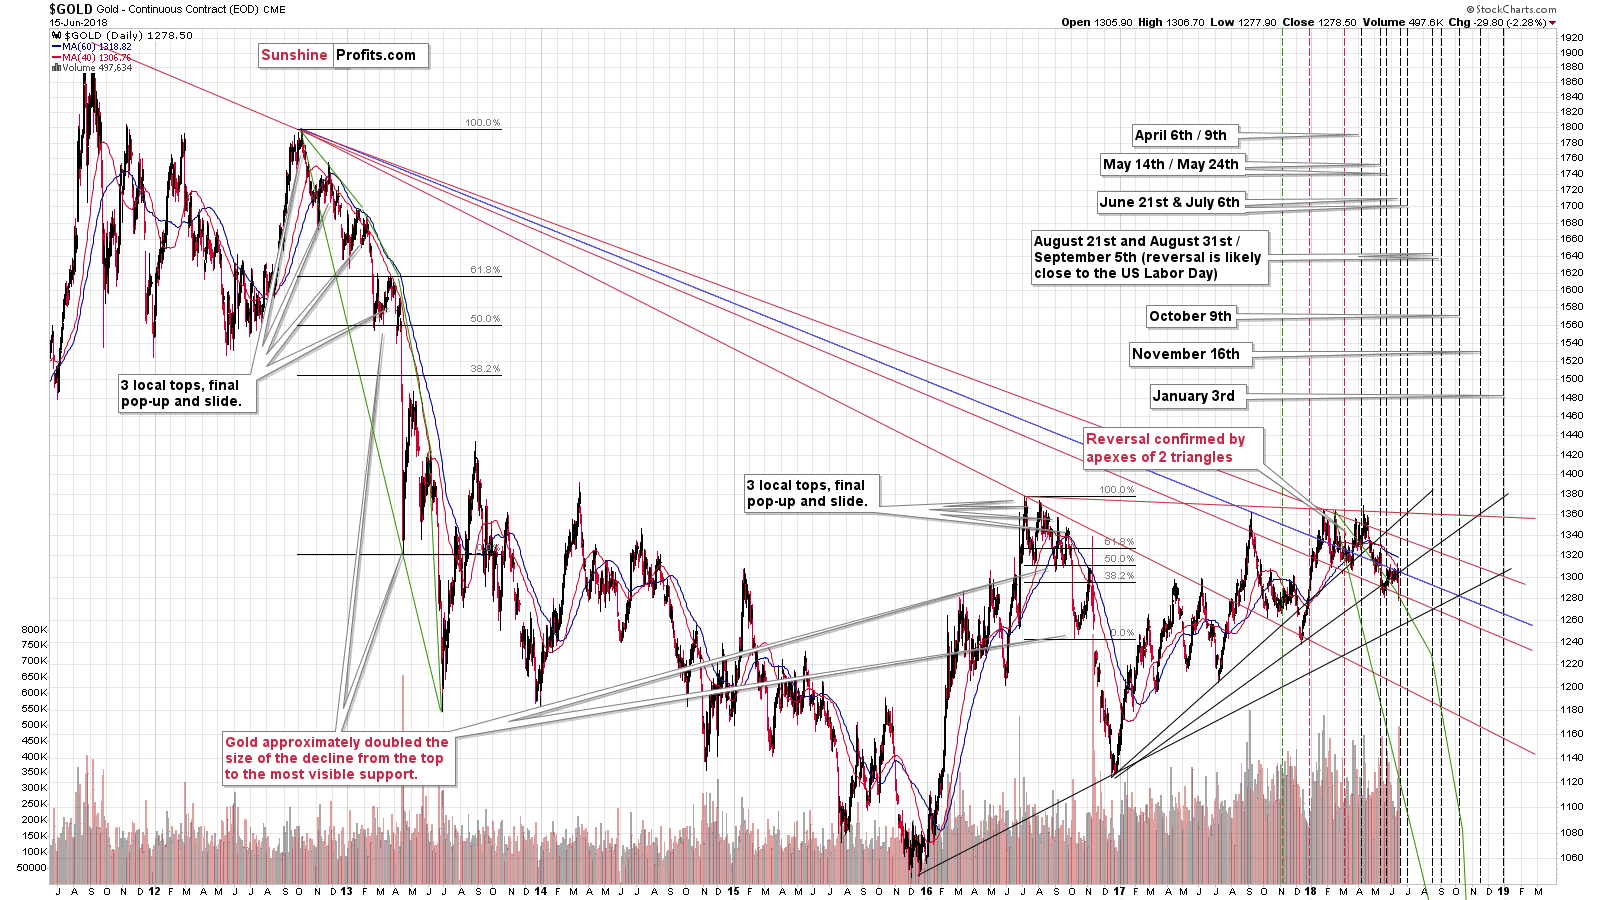
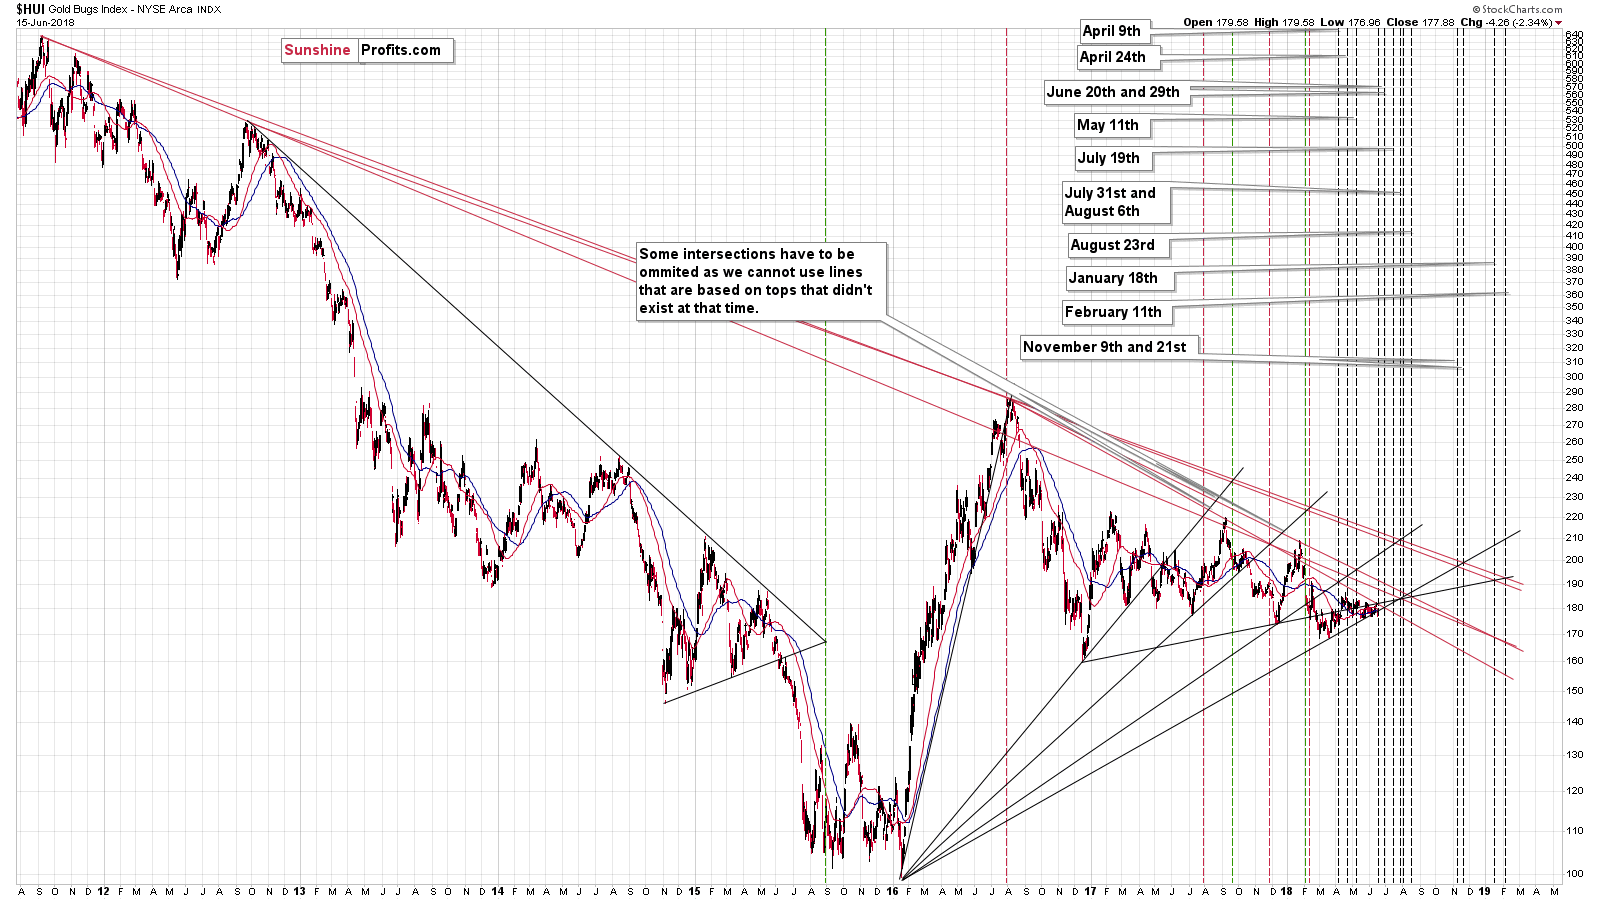
In case of gold the nearest reversal is on June the 21st (Thursday), and in case of gold stocks, the nearest reversal is on June the 20th (Wednesday). This suggests that we may get lower prices and mining stocks show strength on Thursday, by not declining further even though gold is likely to.
What should one make of all this? Is gold likely to bottom close to $1,250 or not? It’s a tough call and monitoring the market for confirmations will be necessary, but at this time, it might be the case that gold bottoms relatively close to $1,250 shortly, perhaps on Thursday and then bounces to approximately the current price levels ($1,270 - $1,280) and tops close to the June 27th turning point. This scenario covers all turning points, the $1,250 support, and it fits the scenario in which gold’s corrections are temporary.
The key silver and gold stock charts confirm that the big move has likely begun and betting on additional prolonged consolidations may be a bad choice.
Silver’s Critical Bearish Signs
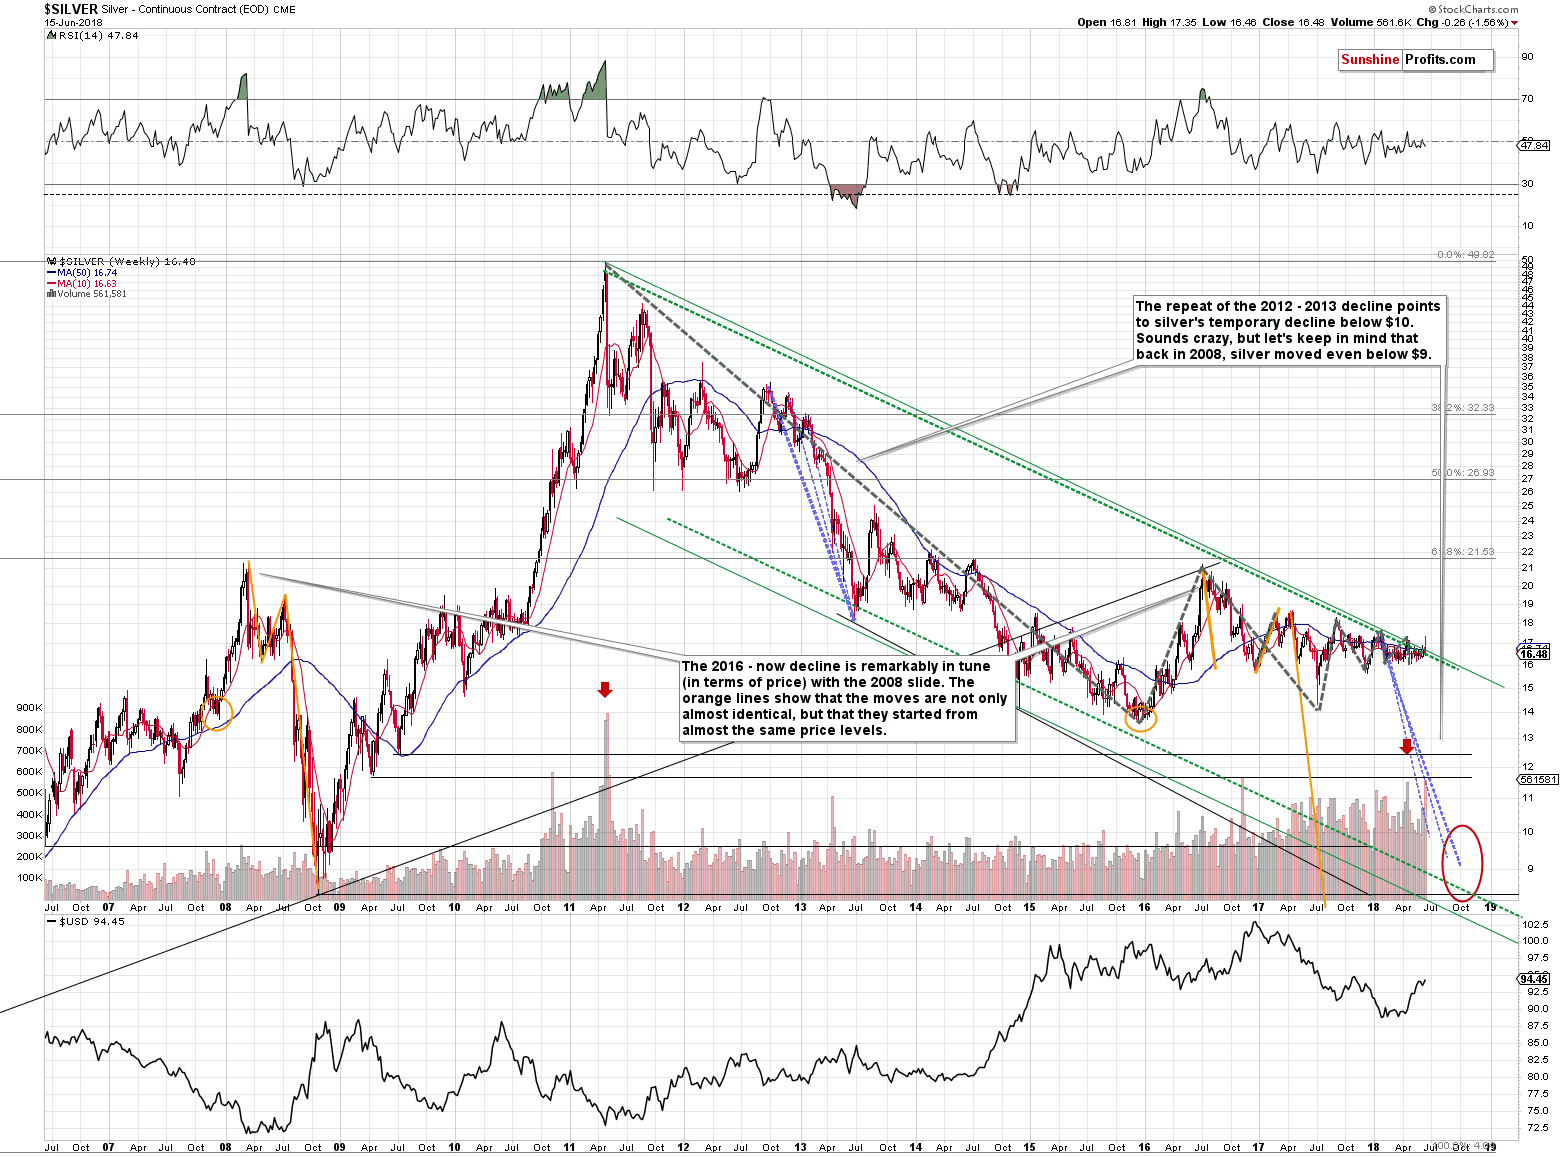
Silver formed an extremely clear weekly reversal. The bearish shooting star candlestick was accompanied by huge volume. This is a popular formation and many traders recognize it. They will likely add fuel to the decline shortly.
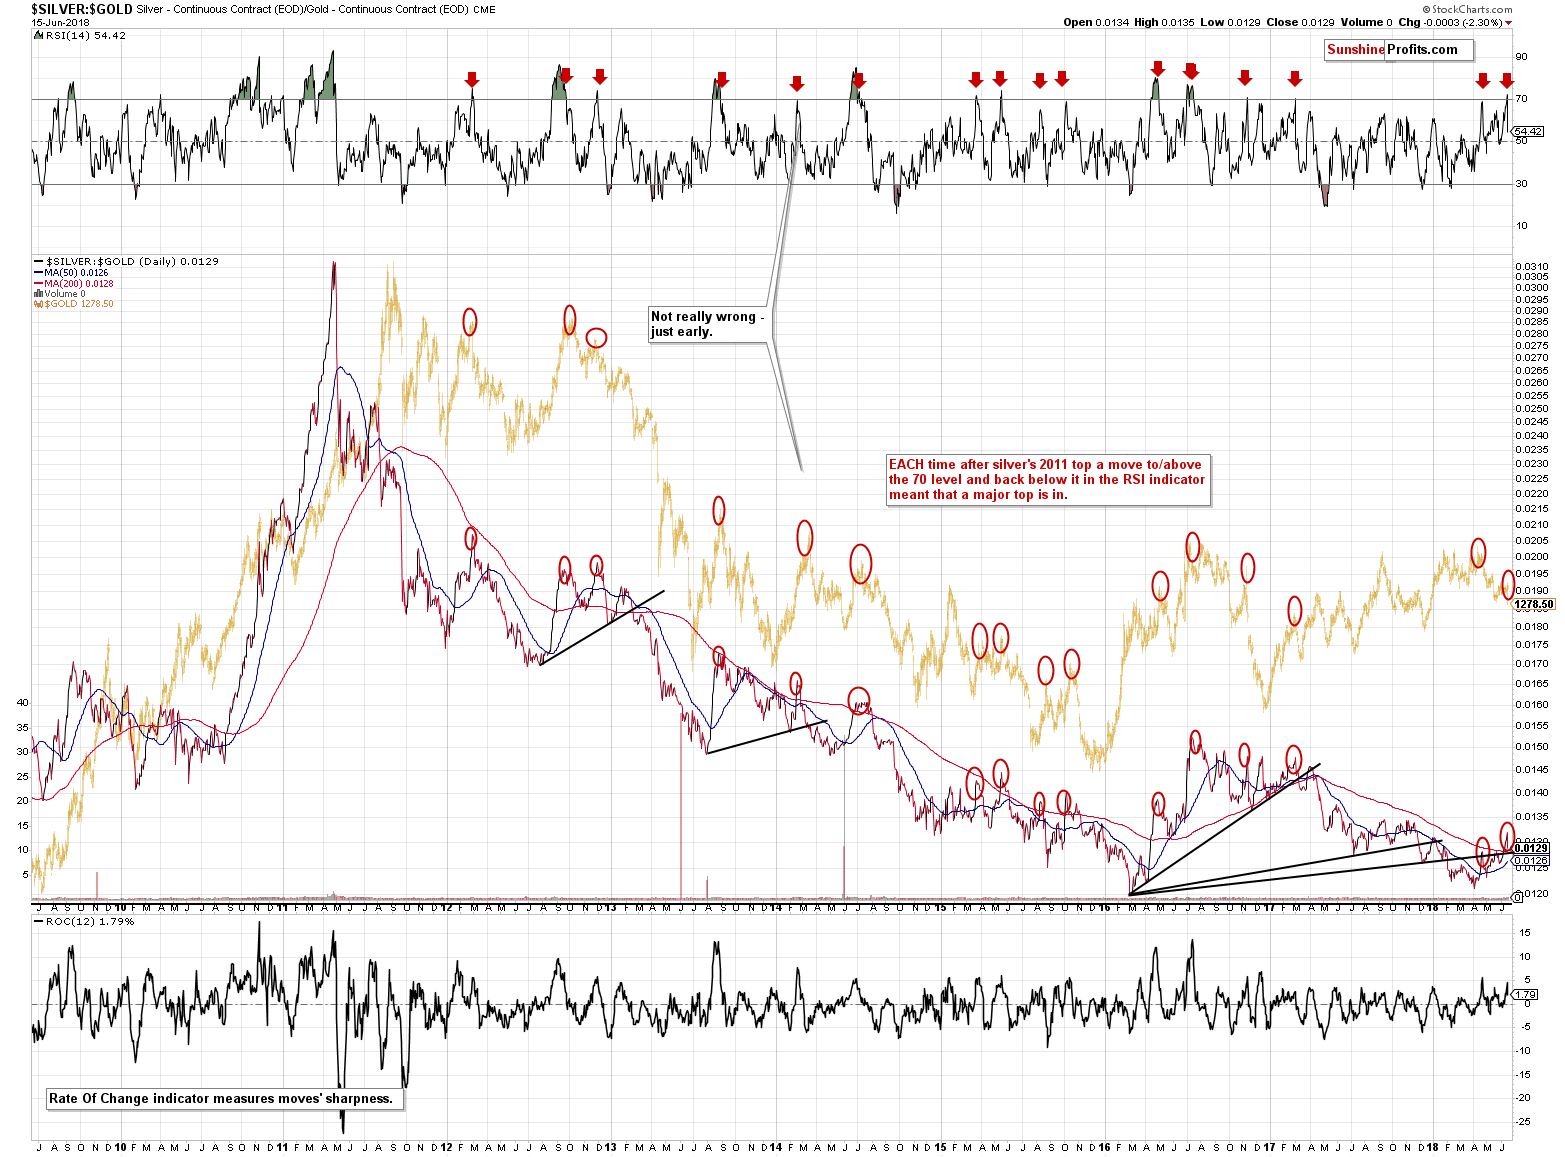
The extremely effective signal from the RSI that’s based on the silver to gold ratio flashed as well. In Friday’s Alert, we commented on the above chart in the following way:
Based on yesterday’s price action in gold and silver, the RSI moved above 72. That’s the highest it’s been since mid-2016. Back then gold declined over $200 and silver declined by more than $5, so that’s a quite bearish analogy.
The full sell signal will flash when the RSI moves back below 70 again and when it does, the implications will be very straightforward and very important. We marked similar situations with red arrows on the above chart and as you can see, this signal has been extremely effective.
The big-volume signal that we discussed previously along with the SLV reversal both suggest that silver will plunge shortly. This means that we’re likely to get the above-mentioned confirmation from the RSI any day now. While the situation may appear very bullish for silver at the first sight, it’s actually exactly the opposite.
The RSI moved below 70 after being above it, so the major sell signal is in. The decline is starting, not ending.
Small, Big Breakdown
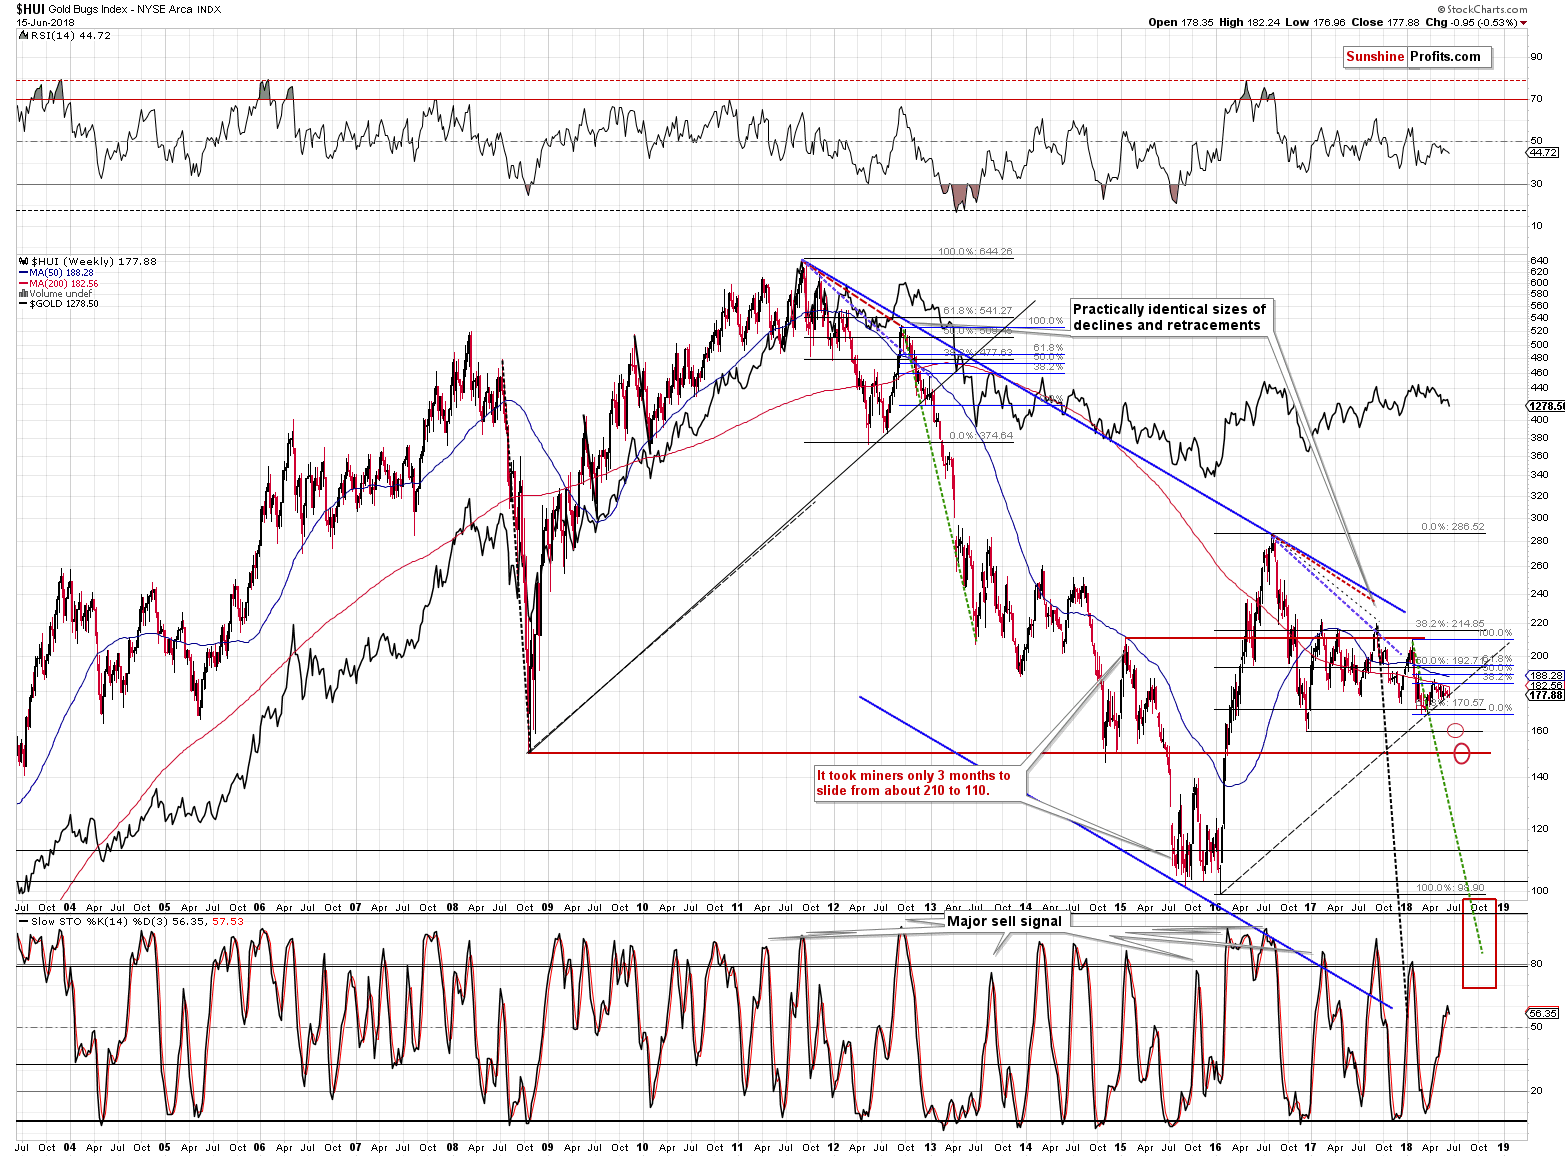
As far as the mining stocks are concerned, we saw a small – but still – breakdown below the long-term rising support line. The breakdown is not yet confirmed, but it is already important as it was seen in both: daily and weekly terms. The implications are already bearish.
Silver and Gold Stocks – Near-term Downside
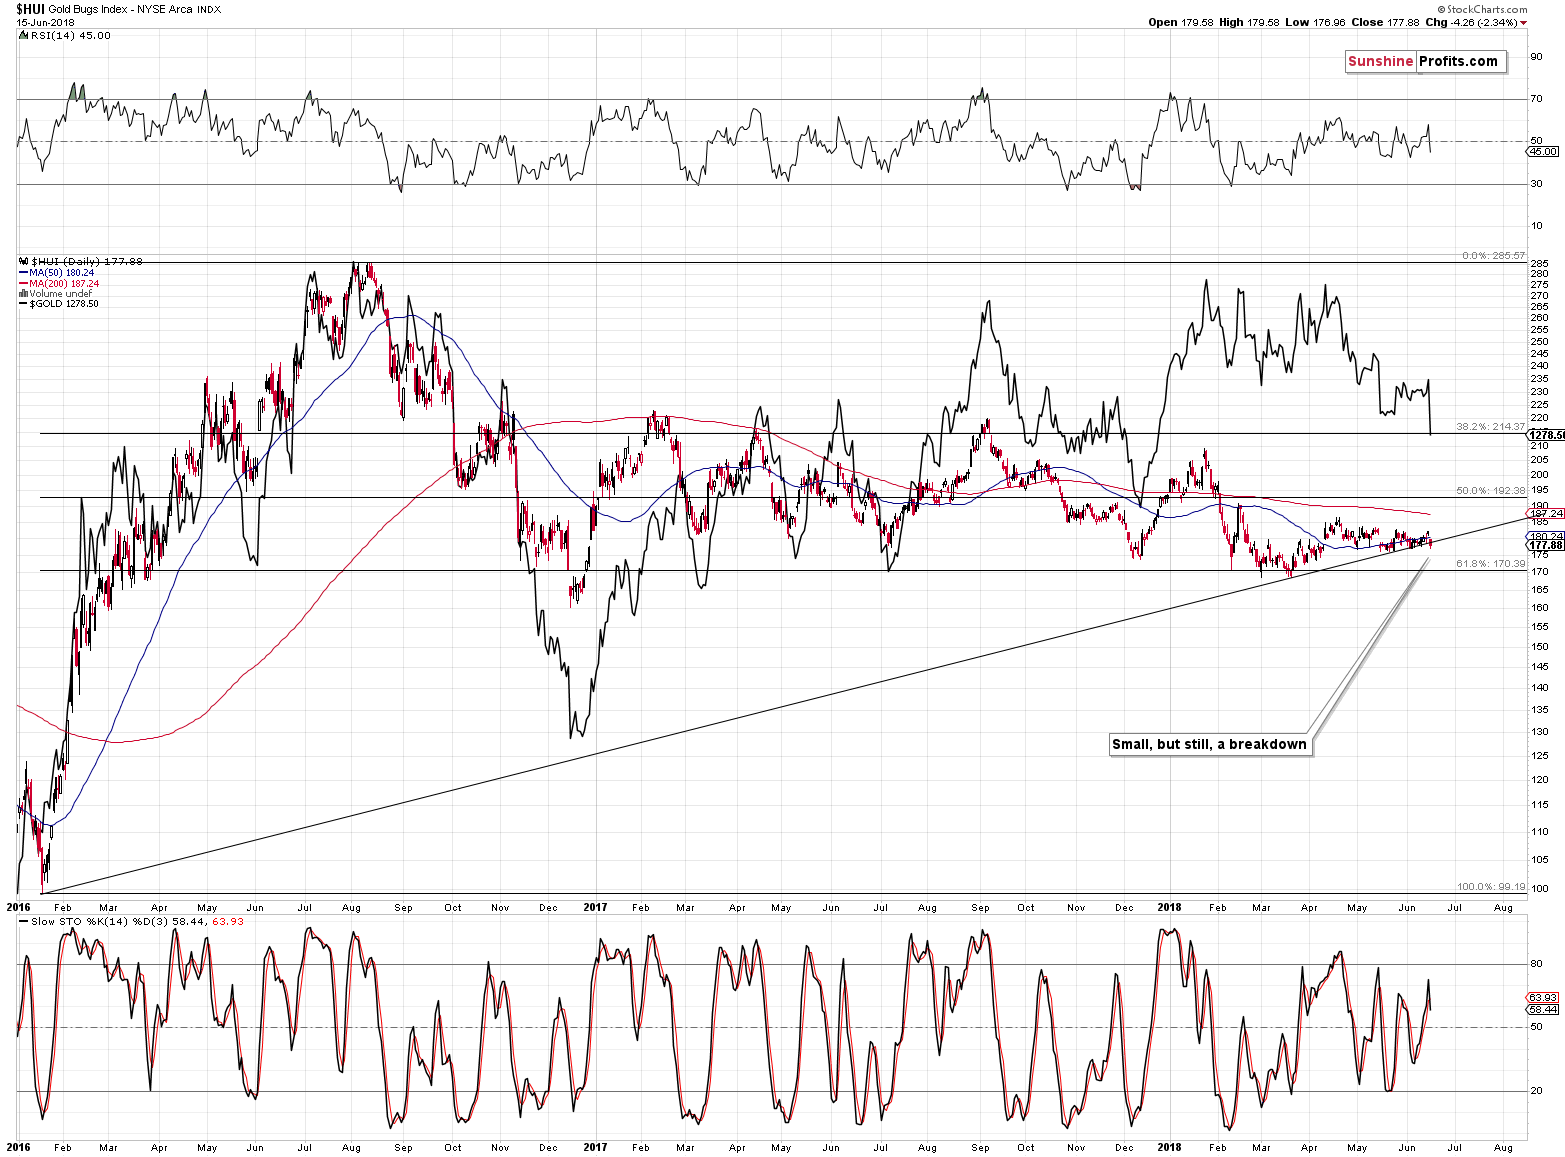
The move is not huge, but it’s there – the dam is broken. The above chart also provides us with a nearby target price for the mining stocks. If gold moves to $1,250 or so, then we might expect the mining stocks to move to their previous 2018 lows.
The same appears likely for silver.
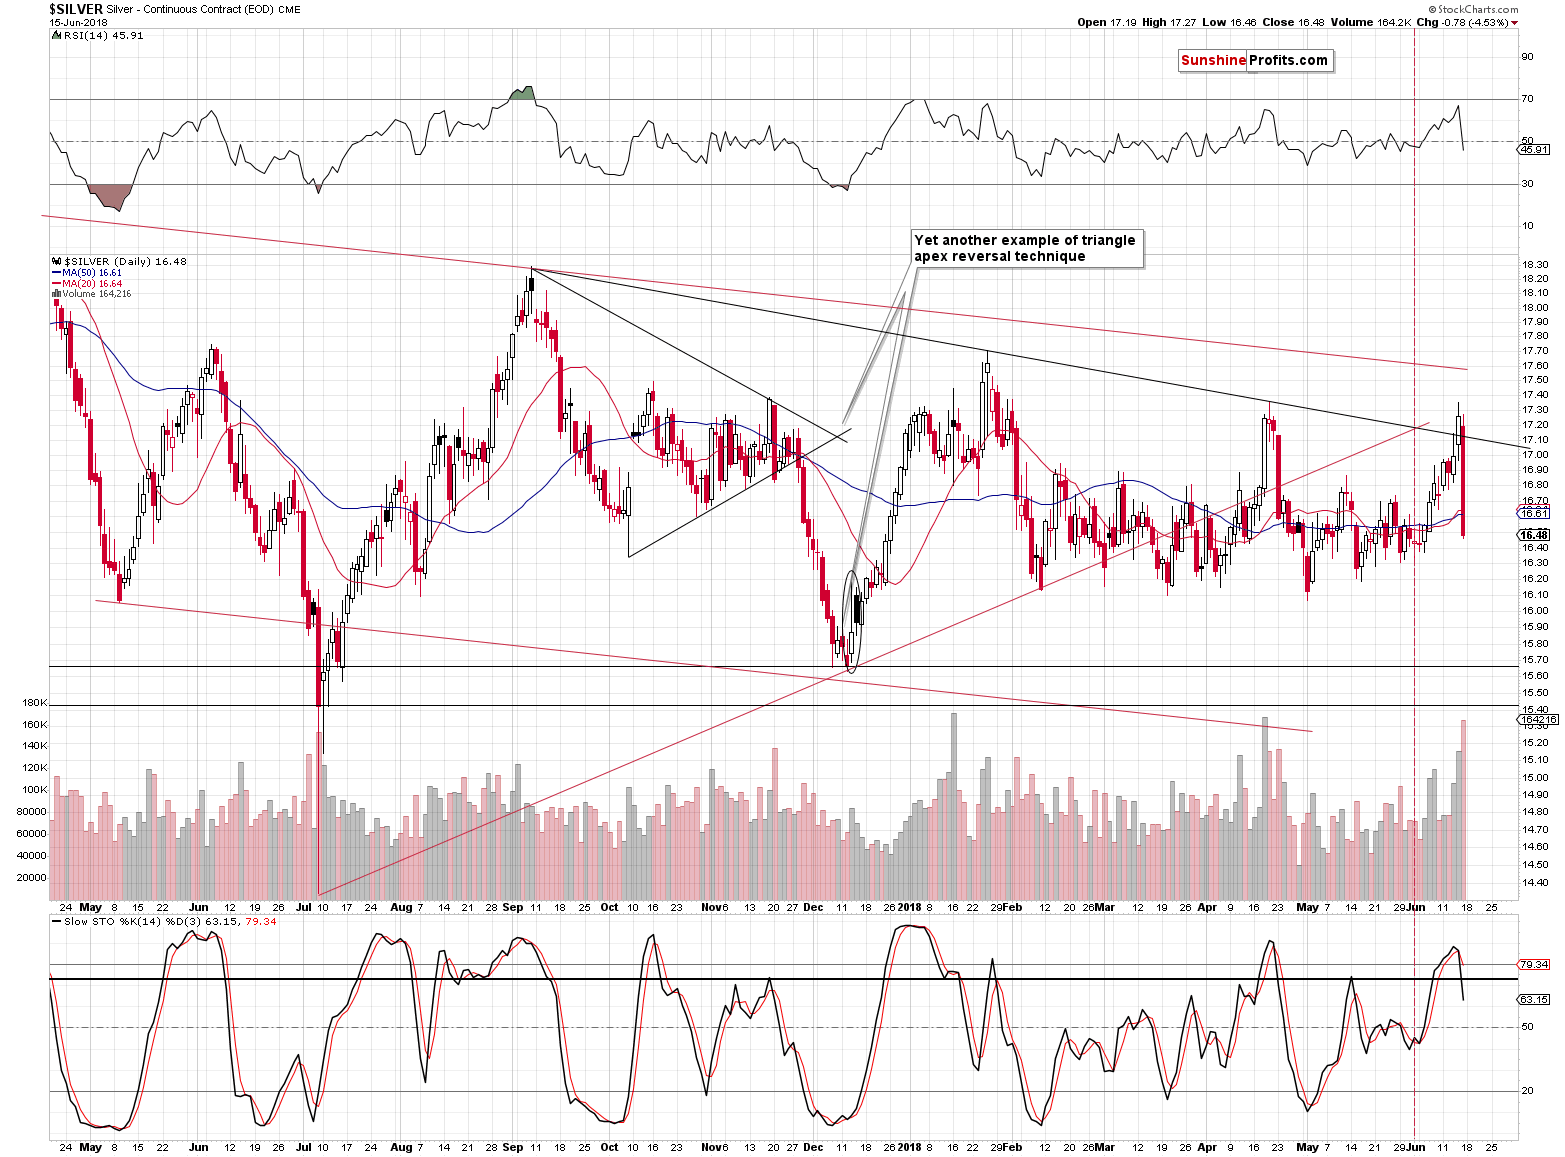
The white metal moved, sharply lower on Friday and it was accompanied by huge volume. The implications are bearish. But, in addition to the above, the chart also shows that the white metal is still visibly above its previous 2018 lows. This means that the latter still provides support and it could hold silver’s decline for a few days.
Naturally, when silver moves to $16.10 or so, almost every silver bull out there will claim that the bottom is in, just as it was in in all the other cases between February and May. Yet, it seems that this time all this level will be able to generate is a small and brief rally that’s followed by surprising (to those making the above claims) and profitable (to those who are positioned correctly) decline.
Forex Note
This completes that analytical part of today’s Alert that’s dedicated to precious metals. We should now theoretically move to the forex part as that’s what we planned to do instead of posting regular Forex Trading Alerts this week. Yet, nothing basically changed since Friday and since we are completing this analysis less than 30 minutes before the market opens, it seems in your best interest to receive this information sooner instead of receiving it later, but with addition of a repeat of our Friday’s forex analysis. If you haven’t had the chance to read Friday’s Alert, we encourage you to do so today. All positions (the ones related to the precious metals market and one forex ones) remain as described in Friday’s analysis. The outlook for the USD Index remains bullish and the same goes for the USD/JPY currency pair, while the outlook for the EUR/USD pair is bearish.
Summary
Summing up, the precious metals market declined in tune with the multiple signals that we had described in the previous alerts and it seems that the decline is just starting. There is quite likely to be a pause or a corrective upswing when gold moves close to the $1,250 level, but it doesn’t seem that it will generate anything more than just a brief correction. The analogous target prices are $16.10 for silver, and $21 for the GDX. Based on the nearby turning points, it seems that we might see some kind of reversal on Wednesday or Thursday this week and then on next Wednesday, June the 27th.
Will it be justified to exit the short positions and to perhaps open long ones in order to profit from this bounce? It’s a tough call. We’ll have to wait for what happens on Wednesday and Thursday and see what kind of confirmations we get. If miners bottom before gold and show strength on Thursday, then we might adjust the current position or even switch it. We’ve done something similar in crude oil recently, taking profits from short positions on June 5th (crude oil at about $64.20) and re-entering them on June 13th (crude oil at $66.78), but at this time we don’t have the same number of signals pointing to a move higher from $1,250 or so in gold as we had in case of crude oil. If we see them, we’ll report to you accordingly.
As always, we’ll keep you – our subscribers – informed.
To summarize:
Trading capital (supplementary part of the portfolio; our opinion): Full short positions (200% of the full position) in gold, silver and mining stocks are justified from the risk/reward perspective with the following stop-loss orders and initial target price levels:
- Gold: initial target price: $1,251; stop-loss: $1,382; initial target price for the DGLD ETN: $48.88; stop-loss for the DGLD ETN $37.48
- Silver: initial target price: $15.73; stop-loss: $18.06; initial target price for the DSLV ETN: $27.58; stop-loss for the DSLV ETN $19.17
- Mining stocks (price levels for the GDX ETF): initial target price: $21.03; stop-loss: $23.54; initial target price for the DUST ETF: $28.88; stop-loss for the DUST ETF $21.16
In case one wants to bet on junior mining stocks' prices (we do not suggest doing so – we think senior mining stocks are more predictable in the case of short-term trades – but if one wants to do it anyway, we provide the details), here are the stop-loss details and initial target prices:
- GDXJ ETF: initial target price: $30.62; stop-loss: $36.14
- JDST ETF: initial target price: $59.68 stop-loss: $40.86
Long-term capital (core part of the portfolio; our opinion): No positions (in other words: cash)
Insurance capital (core part of the portfolio; our opinion): Full position
Important Details for New Subscribers
Whether you already subscribed or not, we encourage you to find out how to make the most of our alerts and read our replies to the most common alert-and-gold-trading-related-questions.
Please note that the in the trading section we describe the situation for the day that the alert is posted. In other words, it we are writing about a speculative position, it means that it is up-to-date on the day it was posted. We are also featuring the initial target prices, so that you can decide whether keeping a position on a given day is something that is in tune with your approach (some moves are too small for medium-term traders and some might appear too big for day-traders).
Plus, you might want to read why our stop-loss orders are usually relatively far from the current price.
Please note that a full position doesn’t mean using all of the capital for a given trade. You will find details on our thoughts on gold portfolio structuring in the Key Insights section on our website.
As a reminder – “initial target price” means exactly that – an “initial” one, it’s not a price level at which we suggest closing positions. If this becomes the case (like it did in the previous trade) we will refer to these levels as levels of exit orders (exactly as we’ve done previously). Stop-loss levels, however, are naturally not “initial”, but something that, in our opinion, might be entered as an order.
Since it is impossible to synchronize target prices and stop-loss levels for all the ETFs and ETNs with the main markets that we provide these levels for (gold, silver and mining stocks – the GDX ETF), the stop-loss levels and target prices for other ETNs and ETF (among other: UGLD, DGLD, USLV, DSLV, NUGT, DUST, JNUG, JDST) are provided as supplementary, and not as “final”. This means that if a stop-loss or a target level is reached for any of the “additional instruments” (DGLD for instance), but not for the “main instrument” (gold in this case), we will view positions in both gold and DGLD as still open and the stop-loss for DGLD would have to be moved lower. On the other hand, if gold moves to a stop-loss level but DGLD doesn’t, then we will view both positions (in gold and DGLD) as closed. In other words, since it’s not possible to be 100% certain that each related instrument moves to a given level when the underlying instrument does, we can’t provide levels that would be binding. The levels that we do provide are our best estimate of the levels that will correspond to the levels in the underlying assets, but it will be the underlying assets that one will need to focus on regarding the signs pointing to closing a given position or keeping it open. We might adjust the levels in the “additional instruments” without adjusting the levels in the “main instruments”, which will simply mean that we have improved our estimation of these levels, not that we changed our outlook on the markets. We are already working on a tool that would update these levels on a daily basis for the most popular ETFs, ETNs and individual mining stocks.
Our preferred ways to invest in and to trade gold along with the reasoning can be found in the how to buy gold section. Additionally, our preferred ETFs and ETNs can be found in our Gold & Silver ETF Ranking.
As a reminder, Gold & Silver Trading Alerts are posted before or on each trading day (we usually post them before the opening bell, but we don't promise doing that each day). If there's anything urgent, we will send you an additional small alert before posting the main one.
=====
Latest Free Trading Alerts:
There was some profit-taking action on Friday, as stocks retraced a part of their recent uptrend. However, the S&P 500 index remained very close to its week-long consolidation along the resistance level of around 2,800. Is this some short-term topping pattern before a downward reversal? Or just quick downward correction? There are still two possible medium-term scenarios.
Bitcoin has been denying the bullish ideas of some of the investors for some time now. At the moment, the currency is in a particularly important zone. One specific move out from this area could result in extreme moves, boosting profits on our hypothetical positions.
=====
Hand-picked precious-metals-related links:
PRECIOUS-Gold steadies after worst fall since November 2016
Hedge Funds Pick the Wrong Time to Go Big on Gold as Prices Drop
Doug Casey says governments don't care about gold and GATA wears tinfoil hats
=====
In other news:
Global stocks, oil suffer as U.S.-China trade spat heats up
Global debt has hit a high – can financial regulators cope?
Unloved British Stocks Trigger a Buy Signal for Morgan Stanley
Bitcoin Could Break the Internet, Central Bank Overseer Says
OPEC Discusses Output Hike of Up to 600,000 Barrels a Day
=====
Thank you.
Sincerely,
Przemyslaw Radomski, CFA
Founder, Editor-in-chief, Gold & Silver Fund Manager
Gold & Silver Trading Alerts
Forex Trading Alerts
Oil Investment Updates
Oil Trading Alerts

