

Briefly: In our opinion, full (200% of the regular size of the position) speculative short positions in gold, silver and mining stocks are justified from the risk/reward perspective at the moment of publishing this alert.
Gold didn’t rally based on the airstrikes in Syria, and it didn’t rally based on the decline in the USD Index. That tells us a lot about the near future of the gold market and the specific confirmation from the euro makes the outlook for the next two weeks quite clear.
Namely, gold is very likely to decline. Both of the mentioned factors should have caused gold to rally. We can say that the airstrikes in Syria were expected and already included in the price, but gold should still have increased in value in USD terms as the dollar declined visibly. Consequently, we can infer that gold is in the situation where it doesn’t want to go higher. Actually, we already knew that weeks ago, but yesterday’s session serves as yet another confirmation.
In the April 3 Gold & Silver Trading Alert, we explained that nothing needed to happen for gold to start its decline. It had been moving back and forth close to the previous highs without the strength to break above them as new bullish geopolitical factors kept emerging (trade conflict between the U.S. and China). Yesterday’s session was the cherry on the analytical cake. Even airstrikes amid high geopolitical tensions didn’t manage to make gold rally above the previous highs. In fact, they didn’t even manage to make gold close a single session visibly higher.
The difference between Friday’s and yesterday’s closing prices is barely visible and in light of a declining USD Index it’s a truly bearish type of reaction. We already discussed this kind of performance in the April 5 Gold & Silver Trading Alert, but it seems that it will be useful to remind the real-life analogy to declining reactions to bullish developments. It’s a perfect description of yesterday’s session.
There is a combination of two factors that makes the current situation particularly interesting and meaningful. The first factor is what we already discussed in the previous alerts – gold’s decline was delayed because new bullish fundamental news kept emerging. We wrote that eventually there would be no new bullish news and that the price of gold would move back to its default mode and resume its decline.
The second factor is that if a given market no longer reacts to factors that should trigger a specific kind of reaction, then it’s a clear sign that the market is about to move in the opposite direction. Yesterday’s session in gold showed exactly that – gold should have rallied, and it did – but only initially. There was not enough buying power to keep pushing gold higher. In fact, buyers were not even able to prevent gold’s decline in the final part of yesterday’s session. Today’s pre-market downswing (gold is at about $1,325 at the moment of writing these words) confirms that the buying power (at least temporarily) almost dried up.
Combining the two previous paragraphs gives us a picture in which gold is not only unwilling to rally substantially based on positive news – it’s not even likely to rally temporarily based on them. It means that both: gold’s next move is likely to be a sizable downswing and that the time for the consolidation is up or almost up.
Before we move to charts, we would like to explain how the market tends to react if it really wants to move in one way (here: decline), but the fundamentals keep interrupting it (here: bullish fundamental news). We’ll not going to explain a sophisticated econometric model for this and we’ll not going to use terms as first derivative or diminishing marginal returns. Instead, we’ll use a simple analogy to something from real life. It will not be a pleasant analogy, but if it generates any emotions, then it’s more likely that it will be easier to keep in mind.
Think of a hardcore drug addict. They have to keep on getting more and more of their “stuff” to keep them happy. They have to constantly increase the amounts of drugs that they take to get the same effect. Even though the final effect is the same – they get their “enjoyment” - the cause is only the increase in dosage. If they didn’t increase it, they would get smaller effects up to the point when it would not be noticeable. If they stop taking the drug at all (eventually, they are likely to run out of it, or their health is too damaged), their “enjoyment” turns into a nightmare.
Similarly, the price needs more and more bullish news to keep on rallying and at some point, the same amount of news (or the same importance of them) will start to generate smaller and smaller rallies. It would take more dramatic and more bullish pieces of news to trigger the same upswings. If the bullish news dosage stays the same, the price will rally at a slower pace and finally stop to rally at all. Once the bullish news is gone (or we have bearish news), the rally turns into a decline.
Yesterday’s session in gold likely shows the final stages of the above cycle and the implications are very bearish.
Interestingly, in a recent interview, Jim Rogers said the following
When there is a lot of bad news and something like gold doesn’t go up, it means it’s not going to go up – the correction is not over for gold.
Please note that it’s a general overview of what we described in detail and what you – our subscribers – knew weeks ago, along with the implications of declining strength of reaction and a real-life analogy.
Gold’s and Silver’s (Lack of) Action
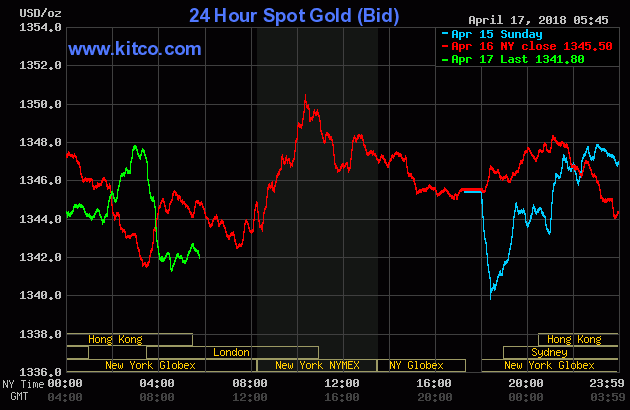
As we discussed earlier today, nothing really changed in terms of the closing prices. The volume was almost as low as it was on Friday and our yesterday’s comments remain up-to-date:
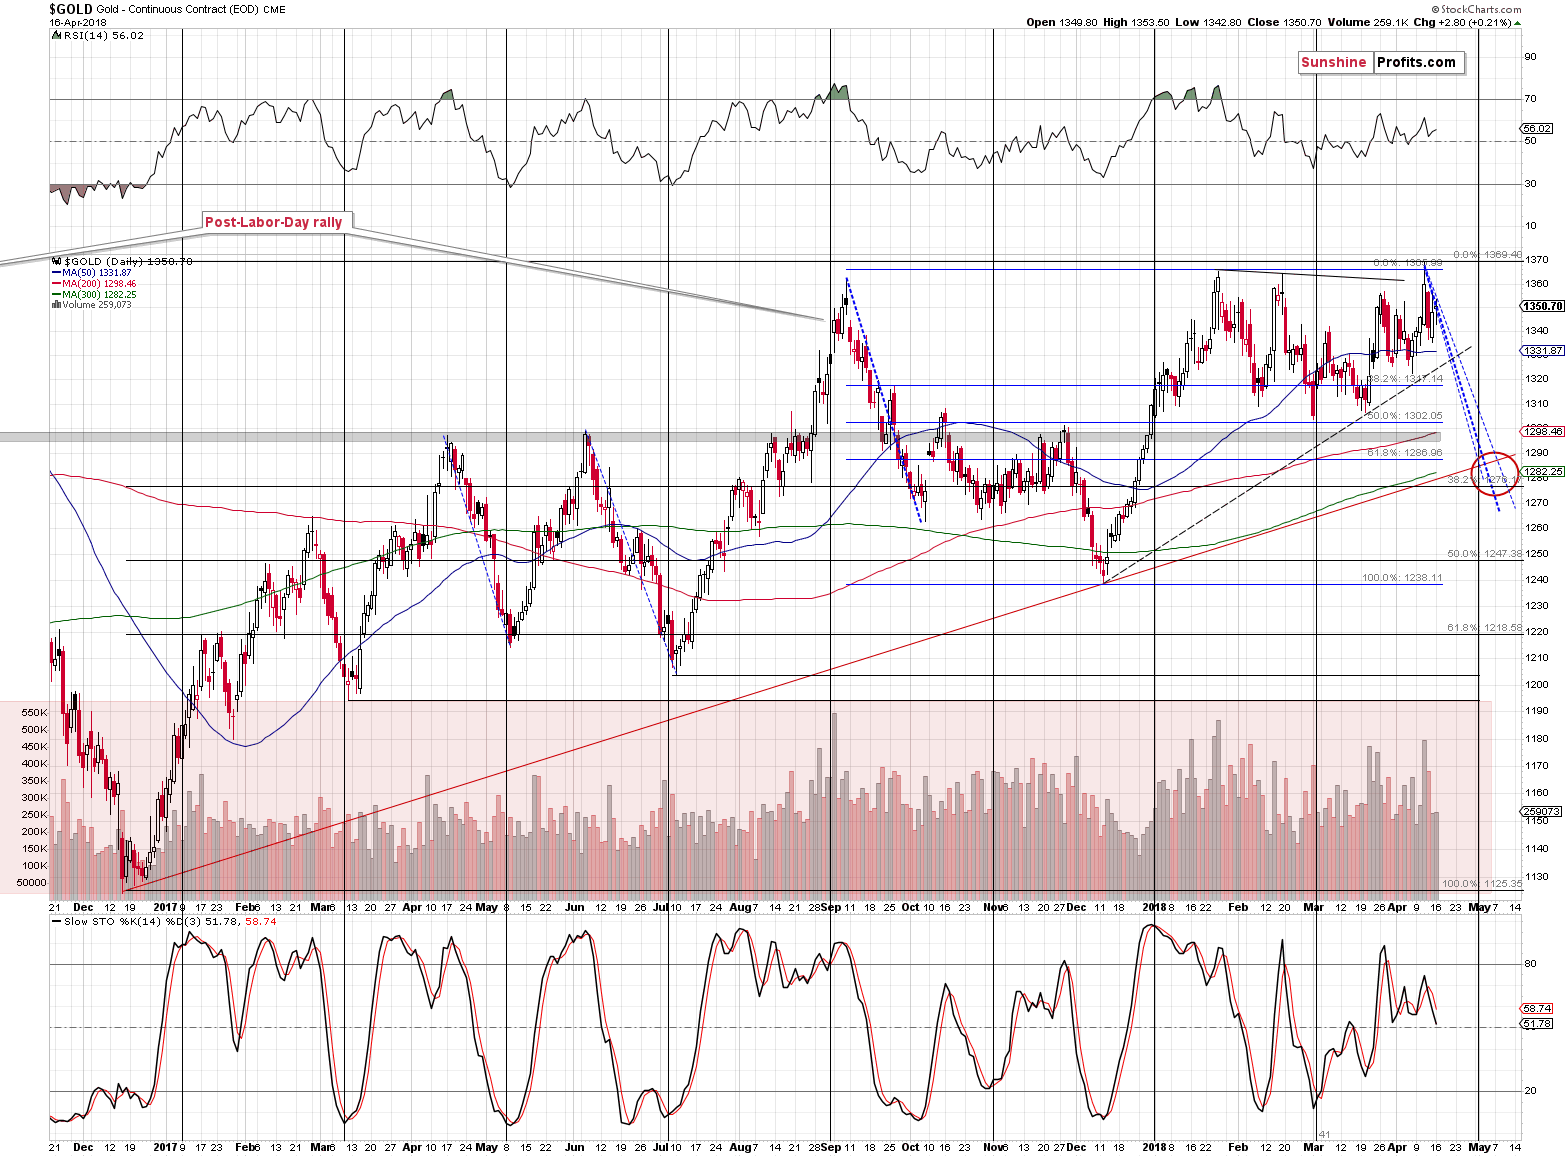
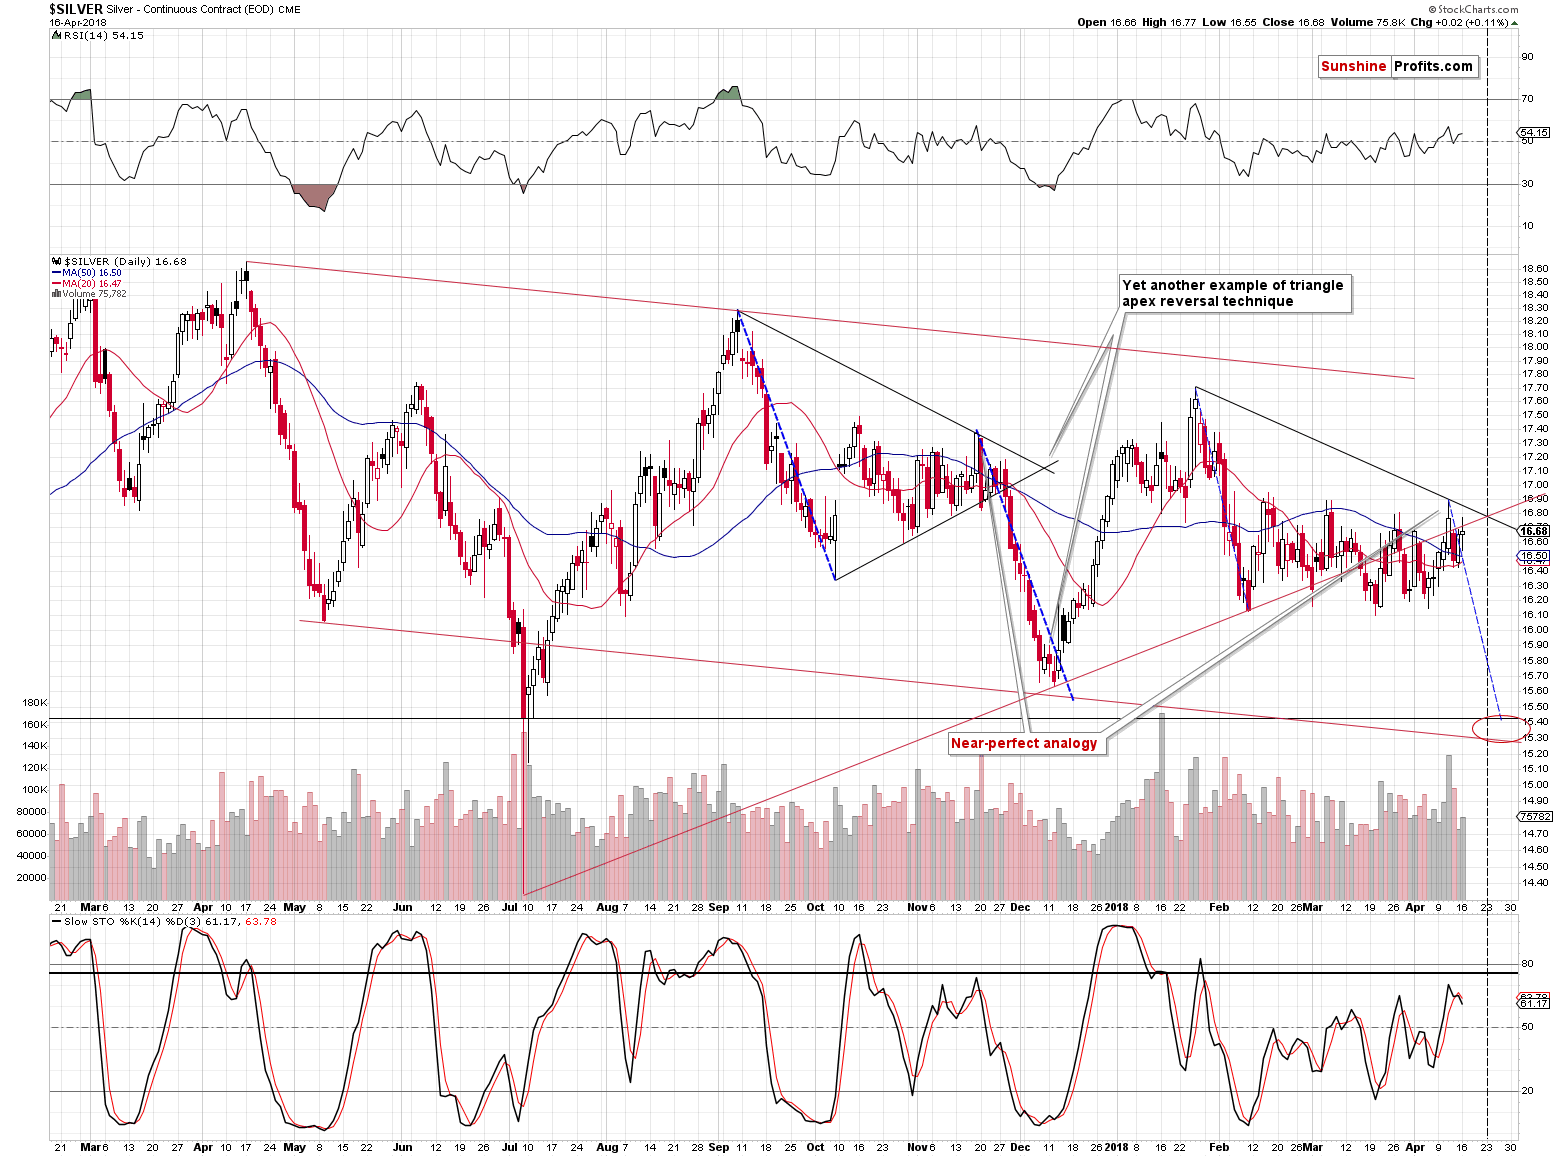
Both metals moved higher on Friday and in both cases the rally was quite in tune with what we can expect at this stage of a decline. Please note the declining blue lines, which represent the previous declines. In both cases, the price declines on average at the same or very similar pace.
The volume was relatively low in both metals and in the case of silver, it was the lowest volume that we had seen in almost a month. This suggests that the upswing is a small correction within a decline, not a start of something more meaningful.
Both markets point to the next reversal close to the end of the April, though silver may bottom sooner due to its self-similar pattern. Just as the white metal declined in a sharper manner in early December, it could get ahead of itself during this decline. It’s not a sure bet, but it shouldn’t surprise us.
All in all, the outlook for the metals remains bearish.
Mining Stocks’ Tiny Underperformance
In the past two alerts, we discussed the outperformance in mining stocks and we explained that it was nothing to call home about. The outperformance pattern has been in tune with what we saw previously.
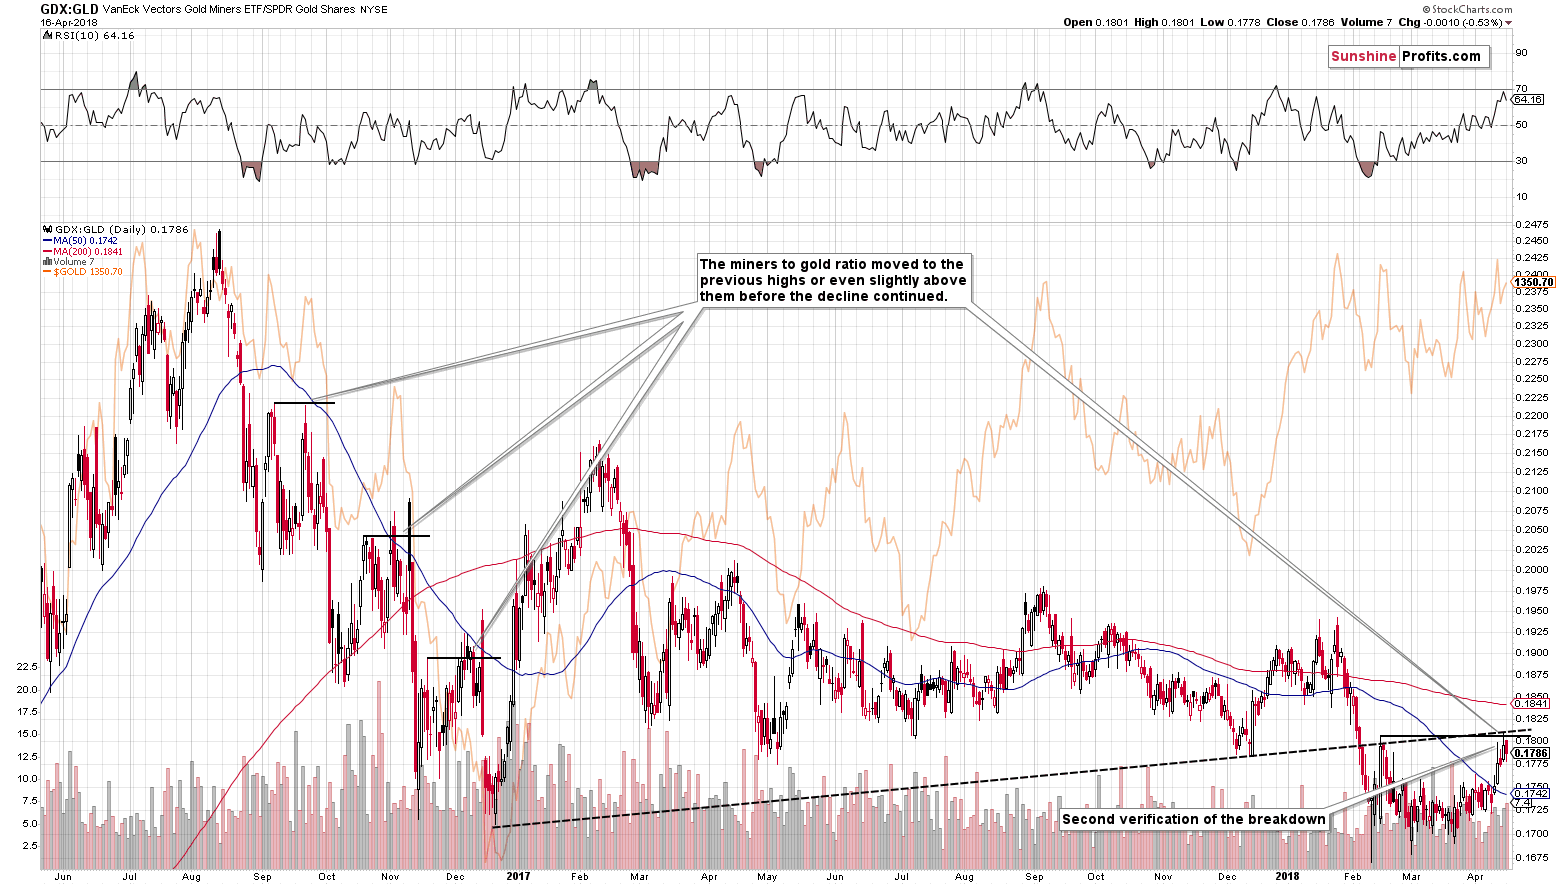
The GDX to gold ratio seems to have confirmed the breakdown below the rising support / resistance line. As we expected, the ratio moved lower after reaching the line once again.
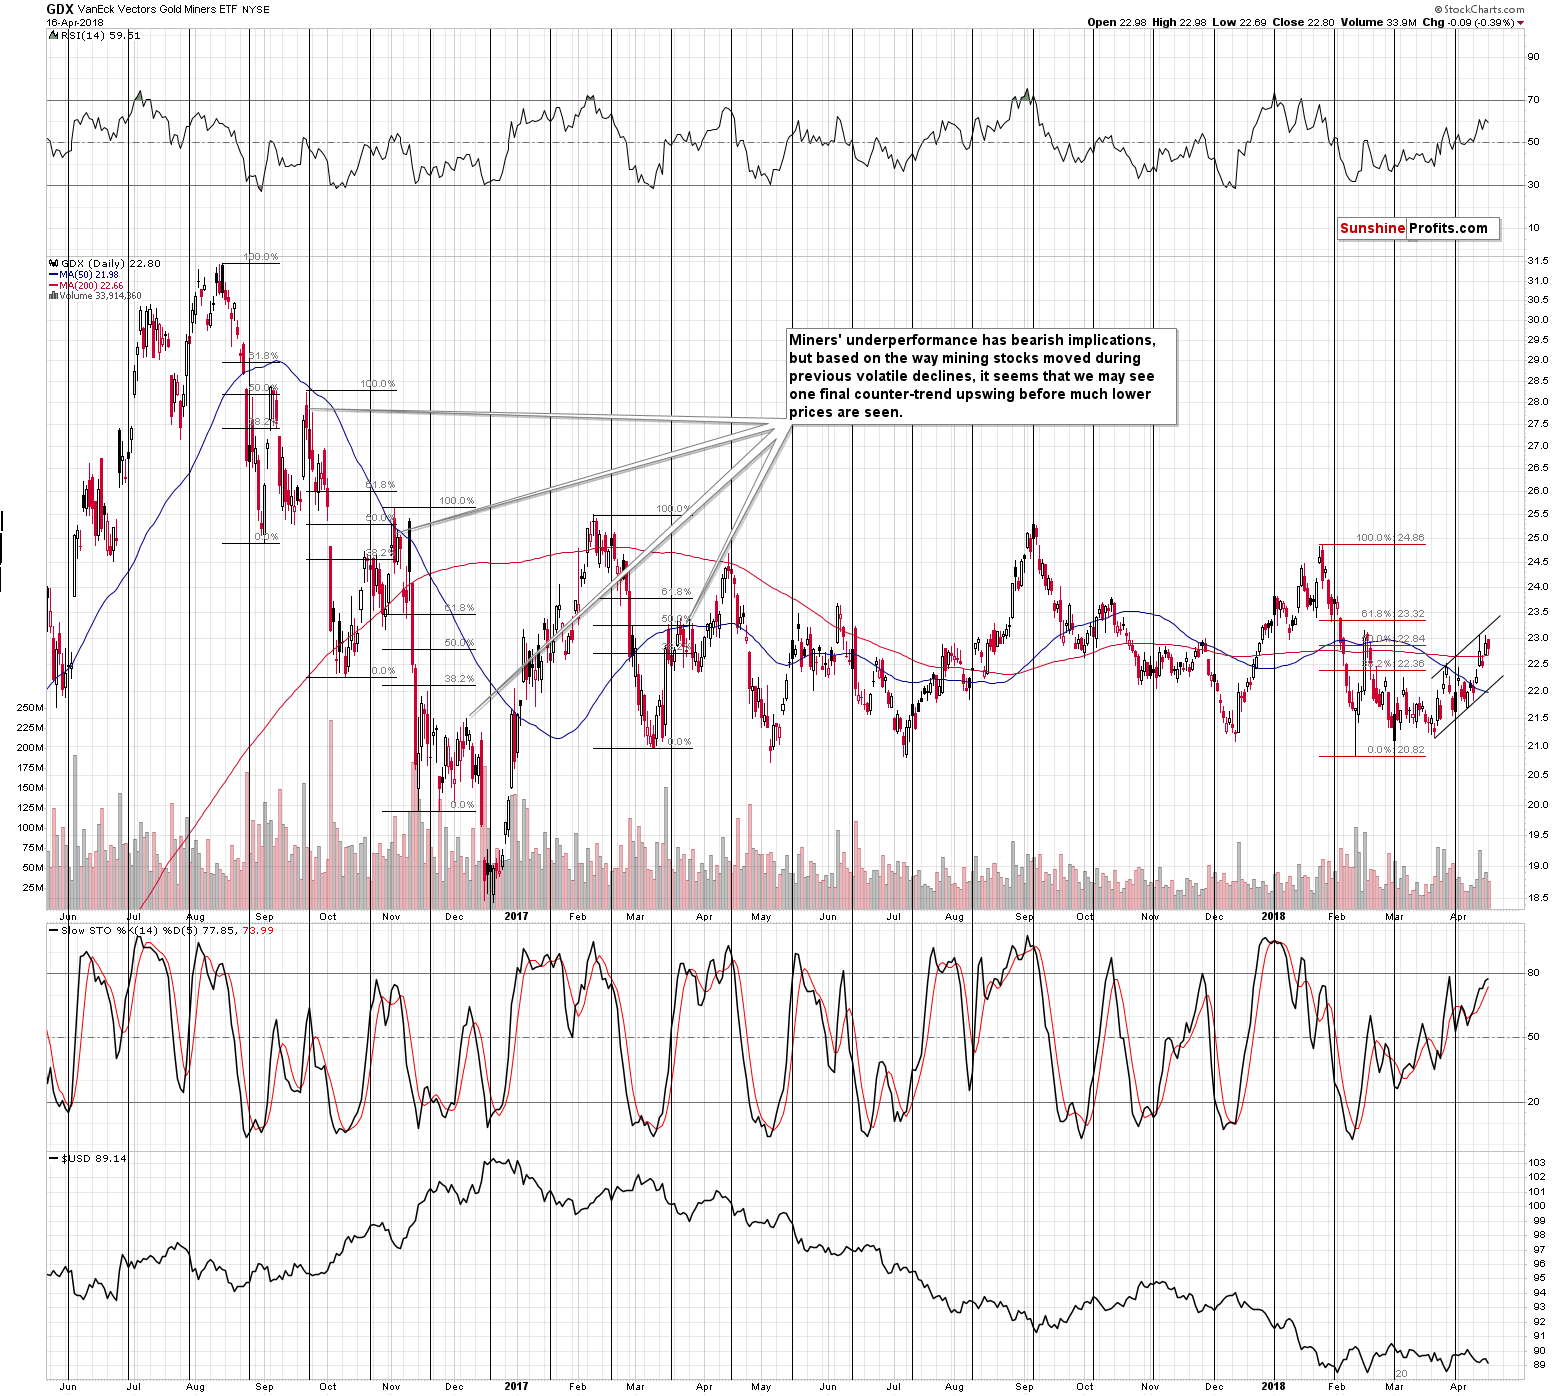
The decline in mining stocks was quite small, but in light of the fact that both gold and silver closed the session a bit higher it serves as a – weak, but still – bearish sign.
The volume was a bit smaller, but it was not small enough to have any implications.
The Forex Set-up
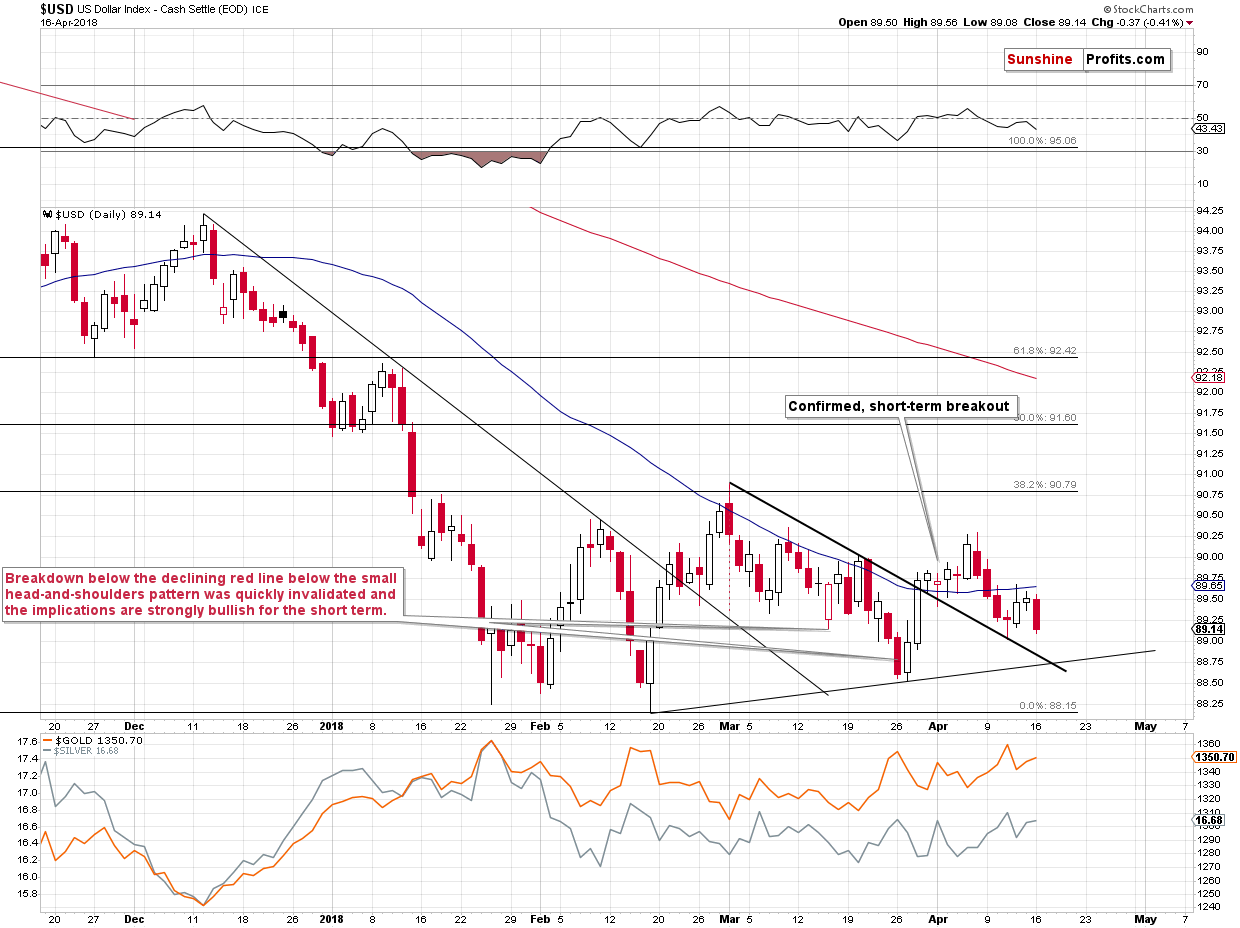
The USD Index moved lower, but not below the previously broken rising black support line, so technically nothing really changed. The thing that we would like to emphasize on the above chart is the short-term triangle and the proximity to its apex. The implication is that the USD Index is likely to reverse either today or tomorrow. The most recent short-term move was down, so the implications are bullish.
This has profound implications for the following weeks and months.
Weeks, because a bigger rally in the USD Index is likely to translate into at least a visible decline in the EUR/USD.
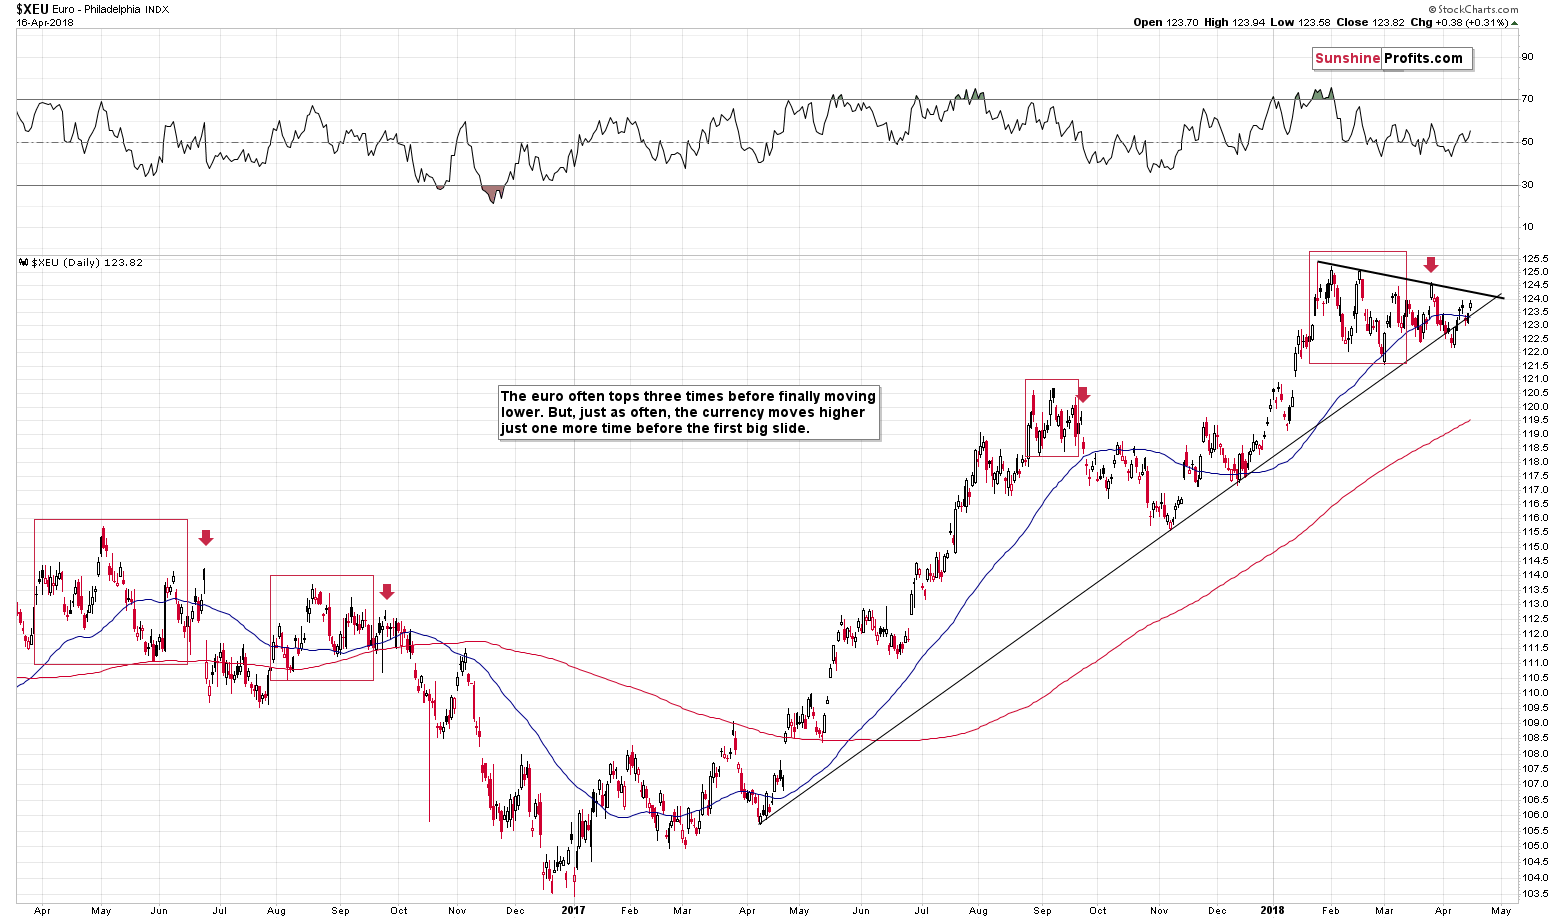
That’s important, because the euro is on the verge of a breakdown. Looking at the above chart alone it’s not clear if we’re going to see a breakout or breakdown, but keeping the USDX picture in mind, a breakdown is much more likely. A breakdown below the medium-term support line would be an important development, so the follow-up action would likely be significant. Especially that the euro has been consolidating for more than 2 months. The last time we saw something similar was between late August 2016 and early October 2016. The decline that followed was the biggest that we saw in recent history.
Before moving to the monthly implications of the USDX’s reversal, please note that the apex of the triangle in the euro is at the end of the month. That’s a perfect confirmation of the targets that we have for gold and silver based on the shapes of the previous declines, support lines, and gold’s cyclical turning point.
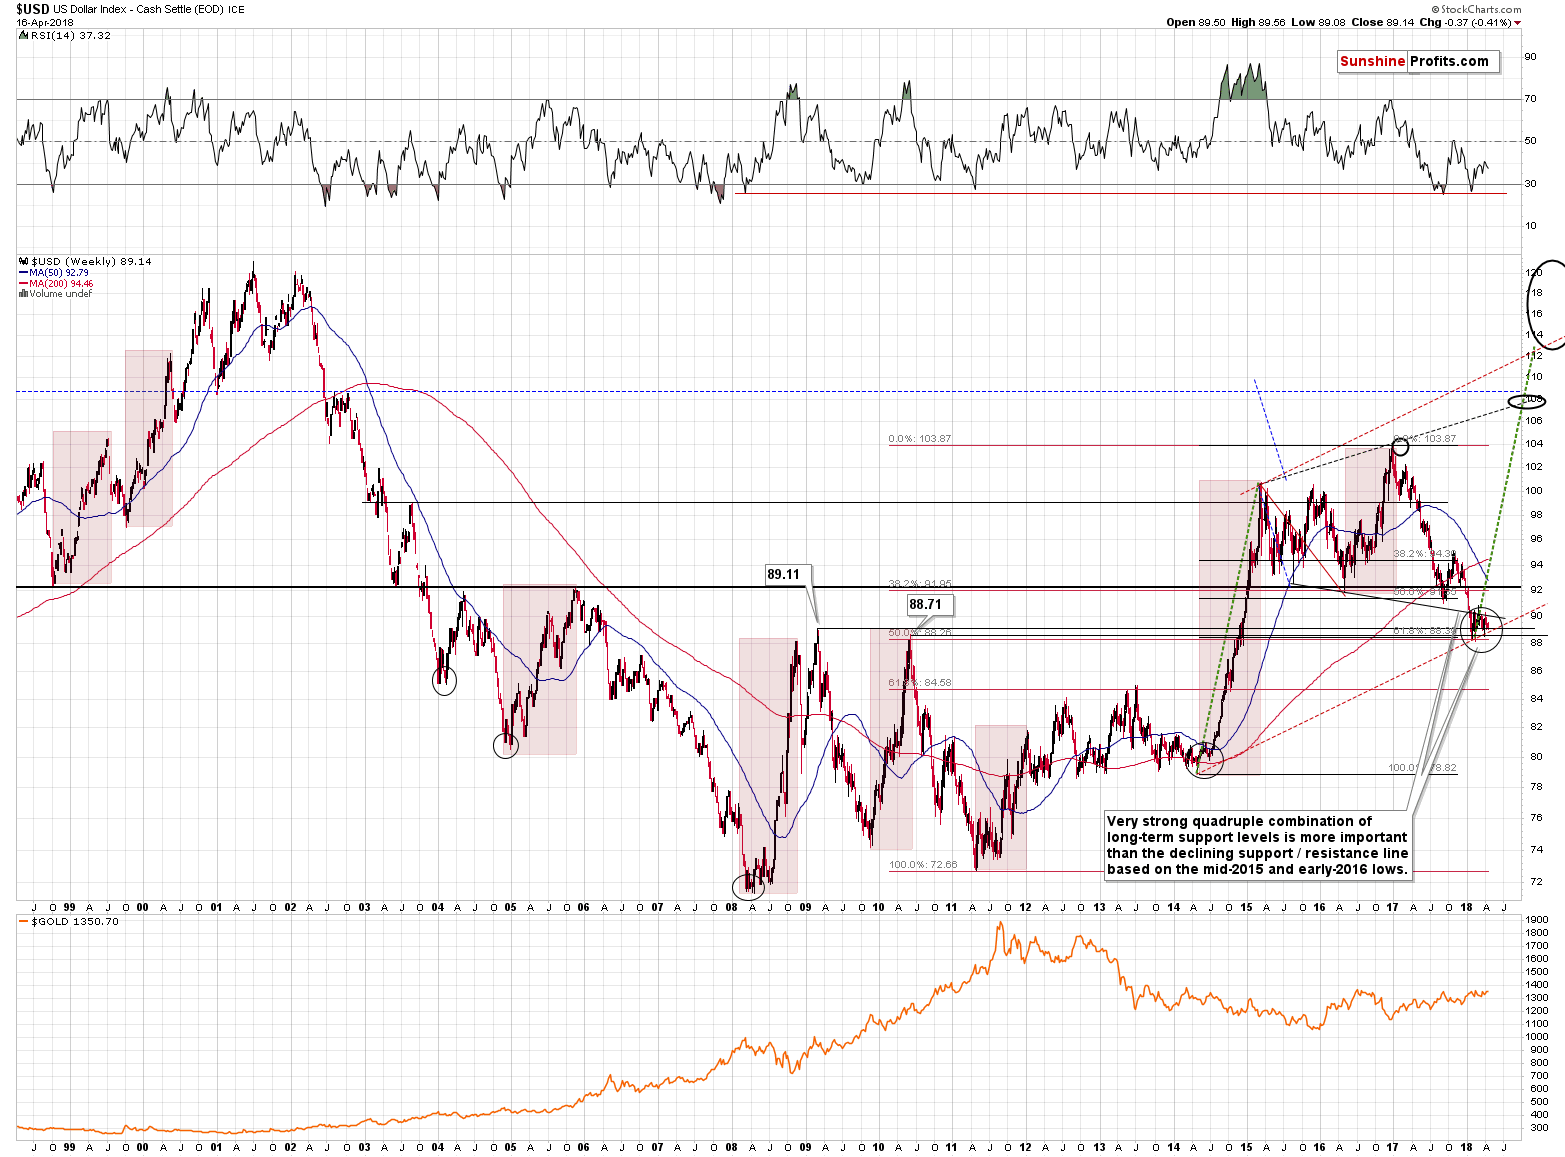
The monthly implication is that the short-term reversal could (and in fact, it’s likely to) be the start of a major upswing. Back in 2014, it took about 8 weeks for the USD Index to consolidate after the rally from the final bottom. The week that ended on Friday, was the 8th week after the mid-February bottom. The price shapes are similar in both cases, and if we see a rally in the USDX shortly (just as the short-term chart suggests), the similarity will be even bigger. This makes the follow-up action likely as well.
Interestingly, if the 2014 – 2015 rally is repeated at a similar pace, then the USD Index is likely to reach one of the upside target levels (about 108) in late September or early October. Based on several long-term factors, this seems to be the most likely timeframe for the major bottom in gold, so the above definitely fits such a scenario.
Before summarizing, we would like to address a question that we received about the price of palladium. The question is if it’s recent strong performance has any implications for the rest of the precious metals market. Our reply is that most likely it doesn’t. Russia is the biggest supplier of palladium (even bigger than South Africa, which leads in platinum production), so the moves higher in the price of this metal are probably a direct result of increased geopolitical tensions regarding Russia. As we explained many times before, the effects of geopolitical developments are usually only temporary.
Summary
Summing up, the fact that gold didn’t manage to rally despite airstrikes in Syria and a visible decline in the USD Index and the fact that gold is declining along with the USD today, before the open, are both strong bearish signs. The recent strength in mining stocks was significant only if we consider the short-term price moves only – the bigger picture reversals that it’s nothing to call home about and yesterday’s action serves as a confirmation. Based on the triangle apex reversal patterns, it seems that the USD Index is about to reverse, which will likely have profound implications for the following weeks and months – i.a. through a declining euro. The outlook for the precious metals sector remains bearish.
As always, we will keep you – our subscribers – informed.
To summarize:
Trading capital (supplementary part of the portfolio; our opinion): Full short positions (200% of the full position) in gold, silver and mining stocks are justified from the risk/reward perspective with the following stop-loss orders and initial target price levels:
- Gold: initial target price: $1,218; stop-loss: $1,382; initial target price for the DGLD ETN: $53.98; stop-loss for the DGLD ETN $37.68
- Silver: initial target price: $14.63; stop-loss: $17.33; initial target price for the DSLV ETN: $33.88; stop-loss for the DSLV ETN $21.48
- Mining stocks (price levels for the GDX ETF): initial target price: $19.22; stop-loss: $23.54; initial target price for the DUST ETF: $39.88; stop-loss for the DUST ETF $21.46
In case one wants to bet on junior mining stocks' prices (we do not suggest doing so – we think senior mining stocks are more predictable in the case of short-term trades – if one wants to do it anyway, we provide the details), here are the stop-loss details and initial target prices:
- GDXJ ETF: initial target price: $27.82; stop-loss: $36.14
- JDST ETF: initial target price: $94.88 stop-loss: $41.86
Long-term capital (core part of the portfolio; our opinion): No positions (in other words: cash)
Insurance capital (core part of the portfolio; our opinion): Full position
Important Details for New Subscribers
Whether you already subscribed or not, we encourage you to find out how to make the most of our alerts and read our replies to the most common alert-and-gold-trading-related-questions.
Please note that the in the trading section we describe the situation for the day that the alert is posted. In other words, it we are writing about a speculative position, it means that it is up-to-date on the day it was posted. We are also featuring the initial target prices, so that you can decide whether keeping a position on a given day is something that is in tune with your approach (some moves are too small for medium-term traders and some might appear too big for day-traders).
Plus, you might want to read why our stop-loss orders are usually relatively far from the current price.
Please note that a full position doesn’t mean using all of the capital for a given trade. You will find details on our thoughts on gold portfolio structuring in the Key Insights section on our website.
As a reminder – “initial target price” means exactly that – an “initial” one, it’s not a price level at which we suggest closing positions. If this becomes the case (like it did in the previous trade) we will refer to these levels as levels of exit orders (exactly as we’ve done previously). Stop-loss levels, however, are naturally not “initial”, but something that, in our opinion, might be entered as an order.
Since it is impossible to synchronize target prices and stop-loss levels for all the ETFs and ETNs with the main markets that we provide these levels for (gold, silver and mining stocks – the GDX ETF), the stop-loss levels and target prices for other ETNs and ETF (among other: UGLD, DGLD, USLV, DSLV, NUGT, DUST, JNUG, JDST) are provided as supplementary, and not as “final”. This means that if a stop-loss or a target level is reached for any of the “additional instruments” (DGLD for instance), but not for the “main instrument” (gold in this case), we will view positions in both gold and DGLD as still open and the stop-loss for DGLD would have to be moved lower. On the other hand, if gold moves to a stop-loss level but DGLD doesn’t, then we will view both positions (in gold and DGLD) as closed. In other words, since it’s not possible to be 100% certain that each related instrument moves to a given level when the underlying instrument does, we can’t provide levels that would be binding. The levels that we do provide are our best estimate of the levels that will correspond to the levels in the underlying assets, but it will be the underlying assets that one will need to focus on regarding the signs pointing to closing a given position or keeping it open. We might adjust the levels in the “additional instruments” without adjusting the levels in the “main instruments”, which will simply mean that we have improved our estimation of these levels, not that we changed our outlook on the markets. We are already working on a tool that would update these levels on a daily basis for the most popular ETFs, ETNs and individual mining stocks.
Our preferred ways to invest in and to trade gold along with the reasoning can be found in the how to buy gold section. Additionally, our preferred ETFs and ETNs can be found in our Gold & Silver ETF Ranking.
As a reminder, Gold & Silver Trading Alerts are posted before or on each trading day (we usually post them before the opening bell, but we don't promise doing that each day). If there's anything urgent, we will send you an additional small alert before posting the main one.
=====
Latest Free Trading Alerts:
Boom! The U.S. and its allies struck Syria in response to a suspected deadly chemical attack several days ago. Gold should be the safe haven in such situations, right? But the price of gold was practically unchanged on Monday. What happened?
=====
Hand-picked precious-metals-related links:
PRECIOUS-Gold dips as sharper risk appetite lifts equities
ETF Manager Renounces Emerging Markets to Pile Into Gold
=====
In other news:
U.S. Futures Advance as Focus Shifts to Earnings: Markets Wrap
U.S. Libor Replacement, Two Weeks After Debut, Has Some Issues
5 Common Misconceptions About Index Funds
China posts strong growth despite trade concerns
=====
Thank you.
Sincerely,
Przemyslaw Radomski, CFA
Founder, Editor-in-chief, Gold & Silver Fund Manager
Gold & Silver Trading Alerts
Forex Trading Alerts
Oil Investment Updates
Oil Trading Alerts

