
Amid global currency wars and terrorist plots the story that riveted and united the world this week was the miraculous rescue of the trapped miners in Chile. Two months, nine days, and eight hours after their ordeal began, all of the miners trapped in a hole half a mile underground were delivered to the earth's surface.
Their determination to survive and their country's resolve to extract them with a complex and expensive operation have inspired the world. This rescue, an inspiring feat of human will and ingenuity, is believed to be the deepest ever, and the survivors have been underground longer than anyone who has made it out alive.
Although most of the news stories did not mention it, we checked and the San Jose is a copper and gold mine.
Chinese miners can only look in envy at the Chile rescue operation and wonder if their country would have gone so far to rescue them. In 2009, 2,631 Chinese miners were killed in accidents, compared to 34 killed in the U.S that same year. China is the world's largest gold producer.
The Upcoming U.S. Mid-Term Election
The Mid term elections are upon us and we thought to consider what impact, if any, they may have on the stock market and precious metals.
These elections take place two years after the Presidential election and are scheduled to be held in early November for 435 House seats and for 37 of 100 Senate seats. Governors will be elected in 37 states.
Americans point to the troubled economy as their most burning issue this year when deciding how to vote, according to a nationwide CNN/Opinion Research Corp. poll.
This is hardly surprising.
The American people are frustrated and there is some reason to believe that voters will push the new Congress to the conservative side of the pendulum. With a few weeks left before the elections, the United States is mired in a grim "New Normal" that could last for years. At the current rate of job creation, the nation could need nine years to just recapture the lost jobs. And it could take well over a decade for housing prices to climb back to their peak.
Whether you call it a recession, or depression, or deflation, or recovery, for tens of millions of Americans, there's little difference.
So odds are that the Tea Party crowd might make the new Congress more conservative. What would that mean?
Generally, it is believed that a more conservative government might lean towards self-control in spending (yeah, right), restraint in Keynesian stimulus policies, which means moderating the quantitative easing.
In the short term that could be good for the dollar and a near-term risk for gold. As the inflation worries could cease for some time, which would help the dollar and at the same time it could cause gold's gleam to fade temporarily as some people would believe that the inflationary period is over.
And then there is the so-called Presidential Election Year Cycle to take into consideration. The theory is based on the powerful incentives presidents have to get the economy looking ship-shape at the time of the next election. In other words, immediately after assuming office, presidents take whatever tough economic measures are necessary in order to set the stage for the recovery and good times. The tendency is for the market to outperform in the 3rd year after the election of the president.
Historical data seems to provide strong support for this theory.
An article in The New York Times this week quoted Jeremy Grantham, the chief investment strategist at GMO, the Boston investment firm, as saying that in the near term, there is a good chance that the market will rally. (We wrote about Grantham in one of the previous Premium Updates.)
We are entering the sweet spot of the presidential election cycle. It's very hard to bet against it" he said.
Here are some relevant quotes from the article:
Since 1942, for example, the 200 days after a midterm election have produced "a remarkably consistent uptrend," regardless of who wins, said Eric C. Bjorgen, a senior research analyst at the Leuthold Group. In a recent report, he found that in all 17 instances, the Standard & Poor's 500-stock index had gains averaging more than 18 percent.
Ned Davis Research has averaged annualized returns for the Dow Jones industrial average from 1900 to 2009 for the different years of a presidential term. Here are the results:
For the first year after election there was 5.5 percent return; for year 2, there was 3.7 percent (which would be this year); but in the third year (next year) the average annualized returns were 12.6 percent; and 7.5 percent for Year 4.
Of course one could argue that the government's stimulus program last year in effect turned last year into the de facto equivalent of the third year of a president's term. What will happen next depends on how much longer and further the government will extend its stimulus. We believe that any quantitative easing and the printing of new dollars will only make gold a more attractive investment.
The Currency War
Last week we discussed the currency war and why it is good for the price of gold. We read an interesting article in the London Financial Times by Martin Wolf that explains why he believes America is going to "win" this particular war. We like his explanation, so here it is:
To put it crudely, the US wants to inflate the rest of the world, while the latter is trying to deflate the US. The US must win, since it has infinite ammunition: there is no limit to the dollars the Federal Reserve can create. What needs to be discussed is the terms of the world's surrender: the needed changes in nominal exchange rates and domestic policies around the world.
In short, what Wolf is saying is that US policymakers will do whatever necessary to avoid deflation. This will cause the prices of long-term assets to rise and encourage capital to flow into countries with less expansionary monetary policies, Switzerland for example, or higher returns such as the emerging economies. We believe it will also cause the price of gold to soar. We certainly agree here.
The US is going to win this war, one way or the other: it will either inflate the rest of the world or force their nominal exchange rates up against the dollar.
The leaders of the group of 20 are scheduled to meet this November in Seoul. It will be interesting to see if they manage to sign a peace treaty that will end the currency war.
And the Nobel Prize in Economics Goes to...
This week the Nobel Prize Committee announced M.I.T. economics Professor Peter Diamond as one of the three winners of the prize in economics. Ironically, Senate Republicans this summer held up Diamond's nomination to the Federal Reserve Board on the ground that he may not be qualified.
What makes this story even more ironic is that unemployment is one of the hot topics of the day and the question of whether the apparent shift in the Beveridge curve signals a rise in structural unemployment is Diamond's field of expertise. He wrote the seminal paper on the subject. There is room to suppose that Diamond's Congressional critics are embarrassed. As we wrote above, mid term elections are coming up.
Let's begin this week's technical part with the analysis of the USD Index. We will start with the long-term chart (charts courtesy by http://stockcharts.com.)
USD Index
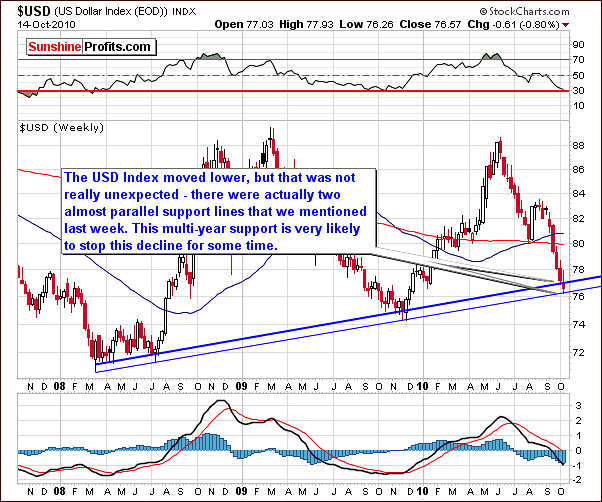
We begin this week's premium update with the USD Index chart and have decided not to include the Euro Index this time. It is our opinion that the trends seen recently and in coming days in the USD Index are of upmost importance with major influences to be seen in the general stock market as well as in gold, silver and mining stocks.
The very long-term support level is now in play at or close to the 77 level. Last week we mentioned that a move slightly lower, say to 76 is possible and it is quite likely that the local bottom will be seen close to these levels very, very soon. This is most likely what we have just seen and what the above chart illustrates. Due to the high negative correlation with precious metals, this will likely coincide with local tops for gold, silver and mining stocks.
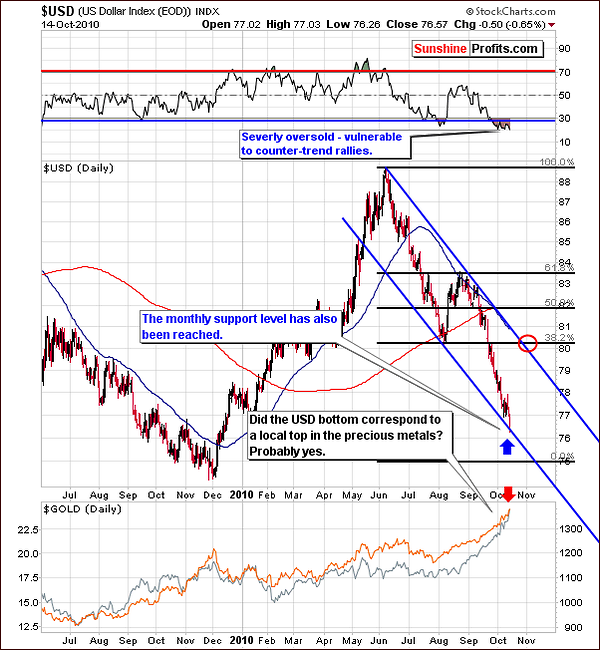
The week's short-term USD Index chart has several points worth noting. First, RSI levels indicate an oversold situation that has been prevalent for weeks, which makes USD vulnerable to counter-trend rallies.
Concerning the index level itself, both the very long-term (as seen on the previous chart) and medium-term support levels (declining blue line that has been reached on Thursday) are now in play. This is important because the trend of the USD Index is a major factor influencing gold, silver and mining stocks.
Summing up, the situation on the USD market is bearish, which is bullish for the precious metals sector.
General Stock Market
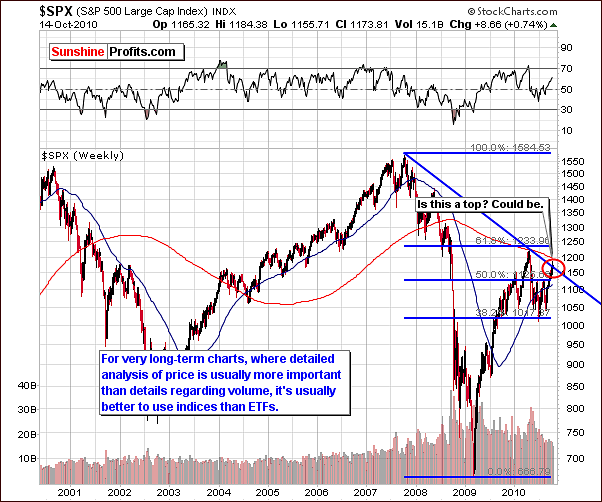
The S&P 500 Index very long-term chart shows stocks to be only slightly above the long-term declining resistance line. A slight move higher will approach the 200-week moving average, which has previously stopped rallies/declines several times - including the one that ended in April. This level provided support in the past and will likely cause at least a pause in the current rally. Indications are that there is a good chance of this happening in the coming week.
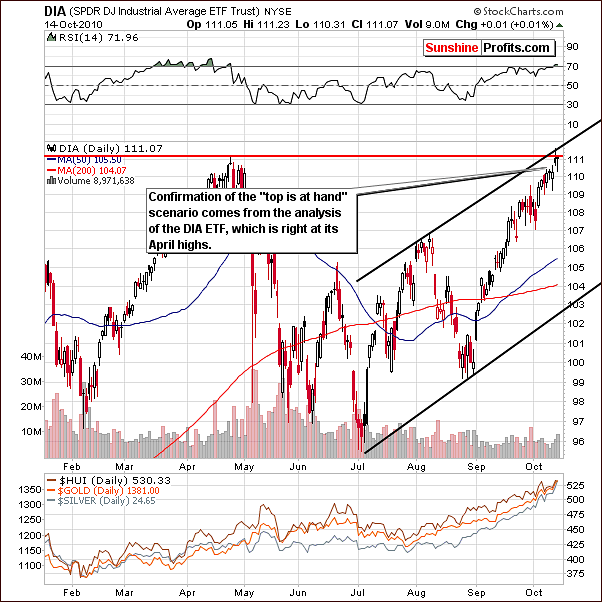
The DJIA Trust, DIA for short (a.k.a. Diamonds), has just reached the level of highs seen in April, which were also local tops. The situation is therefore a double resistance level. In addition to the April top, the upper border of the rising trend channel has also been reached. We would like to remind you about the Hindenburg Omen and its bearish implications - consistent with the abovementioned points.
Summing up, the implications here are that stocks will likely decline and with the USD Index at or near a local bottom, it seems quite probable that gold, silver and mining stocks will soon see local tops or that we have just seen them.
Correlation Matrix
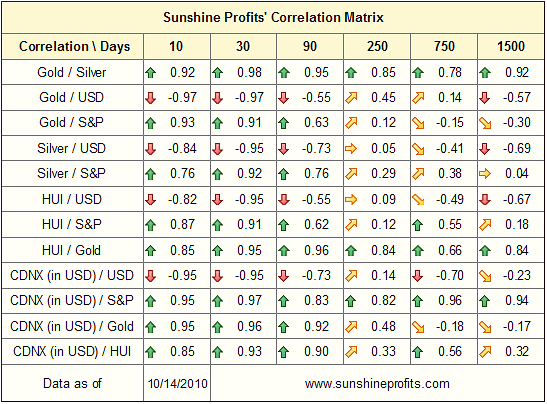
The Correlation Matrix this week shows no yellow arrows in 10-, 30-, and 90-columns, which is very unusual. This means that the correlation coefficients are strong and statistically relevant. When values are close to 1, a very strong correlation is indicated. Consequently, the cross-analysis of several markets is particularly important.
In the matrix this week, we see a strong negative correlation between precious metals and USD and a strong positive correlation between precious metals and the general stock market. It is therefore very likely that a USD Index bottom and a top in the general stock market will both be accompanied by local tops for gold, silver and mining stocks.
Gold
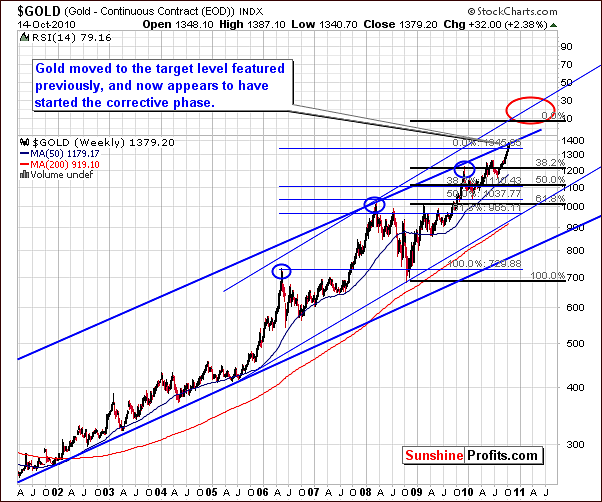
In the very long-term chart this week, we see similar trends to what has been the norm since early August, nearly ten weeks ago. In last week's Premium Update we stated that "we see that gold moved up to the upper border of the very long-term trading channel." Once again this week, this same trading channel has held and evidence continues to mount for a likely corrective phase to begin very soon. Gold appears unable to breakout above the resistance line and although its price did rise significantly in the past few weeks, there does not appear to be enough strength left in this rally to delay the inevitable correction much longer.
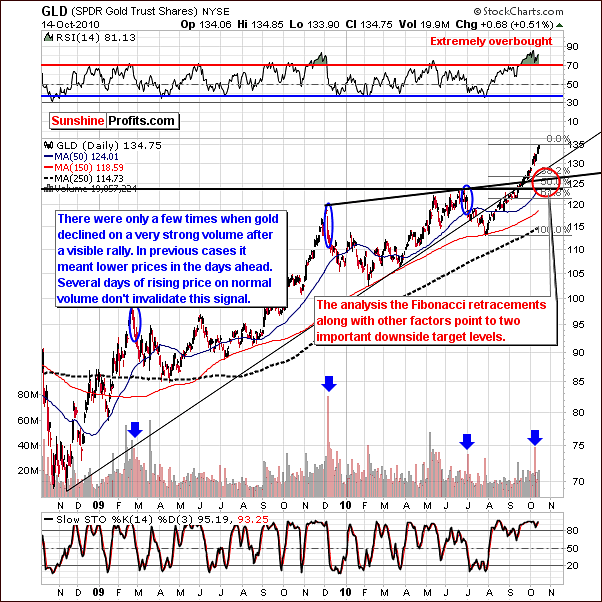
This week, the RSI for GLD SPDR is still showing a level corresponding to an "extremely overbought" status (conversely, the USD Index' RSI is extremely oversold.) The current rally has brought gold's price to a level, which is indeed two times higher than the prior move below the June local top. This is an important development for setting short-term targets for gold and it further supports the theory that a consolidation is likely to begin very soon.
The volume levels that accompanied recent daily upswings were much higher than the volume we've seen when metals declined heavily last week. This is a pattern, which has been seen in the past and is often followed by a period of consolidation and price correction.
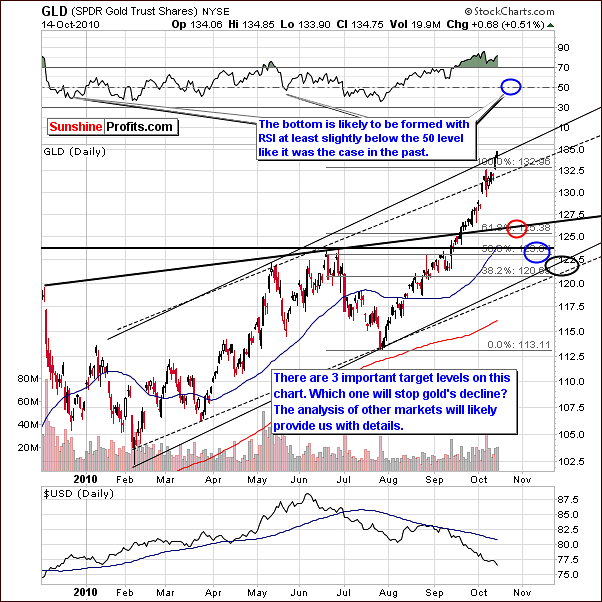
As gold continues to rally, the upper border of the solid line trading channel in this week's short-term chart has been reached. This resistance line is created from an extrapolation of daily extreme levels. Although the dotted line is a more commonly used channel border, having been formed by past local tops and bottoms, it is important to note that the daily extreme trading channels are noteworthy as well.
We continue to research past trends in order to determine how low spot gold's price will eventually fall. Once again, we have included three ellipses in our chart this week. They correspond to several support levels including the Fibonacci retracement levels and the rising trend channel, all of which have adjusted slightly since last week as they recalculate on a daily basis.
Note that the target levels range from approximately 121 to 125.5, a slightly narrower range than we defined last week as well as being a bit further out into the future. Once again, we continue to remind investors and traders to monitor gold and other markets for more specific details on which bottom target level will eventually be most accurate.
The RSI will likely fall to or slightly below the 50 level once prices correct and a local bottom is reached. This will likely provide an excellent entry point and short-term buying opportunity for our speculative investors. Sunshine Profits will continue to monitor this situation as the time draws near and keep our Subscribers informed as to the timing of this long-awaited opportunity.
Summing up, even though we have seen higher prices for gold in recent days, the bearish signs we have been pointing to for some time now are still quite prevalent. There do not appear to be enough bullish signals to invalidate the bearish influence of the USD and general stock market and we continue to believe that prices will soon correct and a consolidation period will likely follow for gold, silver, and mining stocks.
Silver
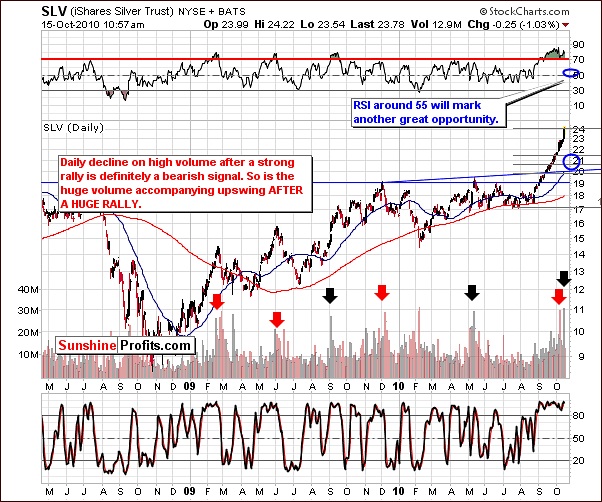
This week's long-term chart for silver shows that the recent daily price increase has been accompanied by huge volume (divergence between silver and gold). Note that in the past, when a spike was seen in daily trading volume above the 20M level, a price decline followed shortly thereafter in five of the six examples seen since the beginning of 2009. Such a volume level has been seen in recent days (marked with red and black arrows) and for this reason, a sharp decline in the coming days will not be very surprising and is, in fact, expected.
Based on past trends for similar length rallies, there is a good chance we will see a sharp decline in silver's price very soon given volume this big. A likely target level for this decline will be in the $20 to $21 range for the SLV ETF, slightly higher than we have stated last week.
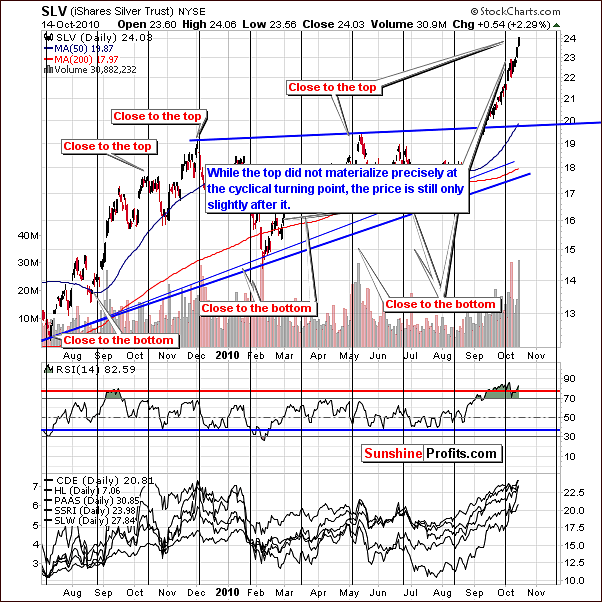
Silver's short-term chart this week shows that we have moved slightly past the vertical black lines which generally correspond to turning points. That is to say, it is quite likely that we are close to or at silver's local top. It seems likely that it will be seen well in advance of our next weekly update.
Summing up, there are few bullish signals at this time except for silver's price action itself. The bearish influences of the USD and the general stock market cannot be overlooked. As we stated in our pre-update message this week, "Silver is two days after its "close to the top" territory and slightly above the level created as target based on post-breakout-rallies. The deviations are not big enough for us to consider them as invalidating points made earlier."
Mining Stocks
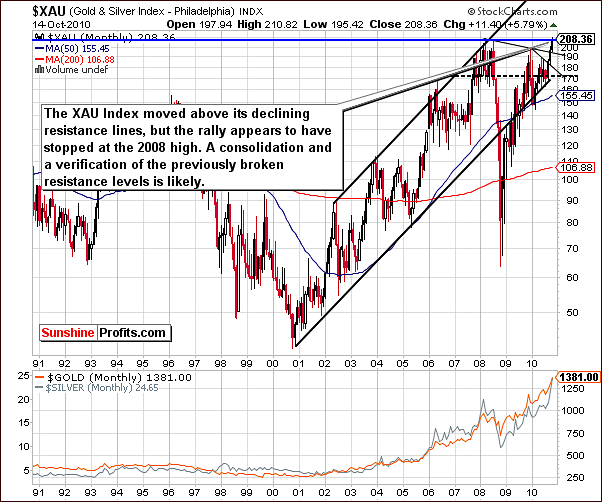
The XAU Index relates to gold and silver mining stocks and has many, many years of history. It is an important factor to consider because of its long-term resistance level - perfectly visible on the chart above. In recent days, the XAU Index approached its profound 2008 high. This is an important development especially in view of the rapid rise seen in mining stocks' prices recently (from the long-term point of view).
Two important declining resistance lines have been broken and will likely provide support in the not-too-distant future - they are marked with black thin lines on the chart above. Additionally, the lower border of the rising trend channel could coincide with one of the abovementioned resistance lines, close to the 170 level. It seems likely that a period of consolidation will be seen soon as the 2008 high level appears likely to provide strong resistance.
Indications from this chart have strong bearish implications in short term, even considered apart from other signals.
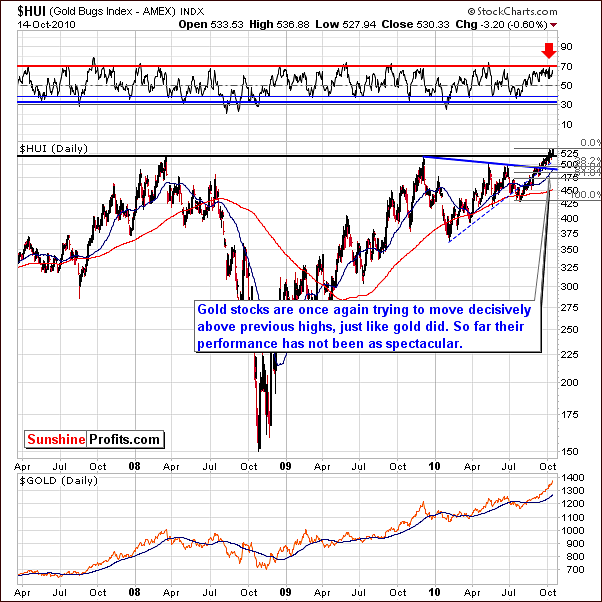
The past week saw gold mining stocks surpass their 2008 high but they did not get much above this level and thus this breakout is not really significant yet. The performance of gold itself was much stronger and on Thursday the mining stocks actually declined on a day when gold prices moved higher. Anomalies such as this are often seen around local tops and this is yet another sign supporting the likelihood that gold's rally may be coming to a close.
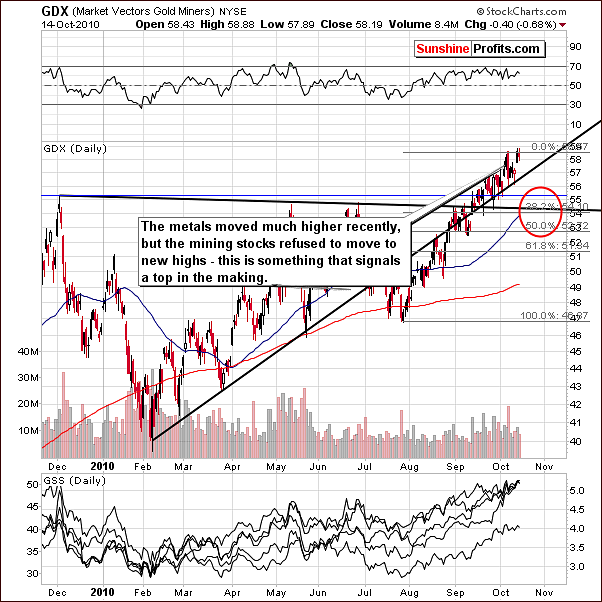
The GDX ETF, another proxy for the mining stocks, points to a local top likely being attained very soon. The metals themselves have moved higher but the mining stocks have been unable to move to new highs. In general, the stocks of precious metals are now the least predictable group of all as far as the coming bottom is concerned, just like we said last week. A likely target level for the eventual decline for the GDX ETF is in the 53 to 56 range which would be as much as 10% below current levels.
Summing up, due to uncertainty and downside possibilities, mining stocks are not an area in which to speculate at this time, although they may become such if we see increased volatility during the early days of the coming decline.
All signs point to a consolidation period in the near-term for mining stocks. This is consistent with expectations in the gold and silver markets and of course - main stocks indices and the USD Index. themselves but as is the case there, the consolidation period is expected to be minimal before we are likely to again see an upswing and additional rally in the precious metals sector.
Stock Options Expirations
This week, we have included some of our new charts, which have been developed as we have delved into the area of stock options expirations. With October 15 options now expiring, we felt this would be a good time to preview some of our charts prior to release of the whole package (we are still fine-tuning this tool and adding interactive features). With options expiring on the 3rd Friday each month, Subscribers focused on daily trades can greatly benefit from these charts - they provide an approximate roadmap for trades around the stock options expiration days.
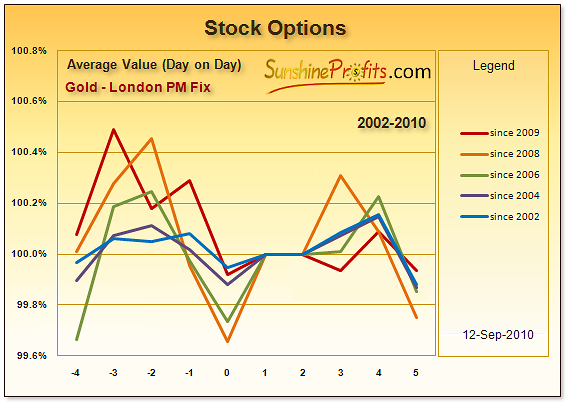
The chart for gold's performance prior to option expiration has been developed from averages from 2002 to 2010. It means that the line based on the 2009 - 2010 data (marked with red line) is reflecting the most current trends in this phenomenon (other colors are used to let you know how this tendency used to change over the years). The obvious pattern seems to be that gold's price tends to rise from Monday (day -4) to Tuesday (day -3) - Friday is marked with "0". This is generally followed by a decline and then a leveling out period with subsequent increases remaining below the levels seen prior to stock option expiration. This appears to hold true even when the long-term trend is bullish. The options appear to have influences for the short-run driving prices higher before the expiration date. Perhaps stock options are, in part at least, the cause of such increases.
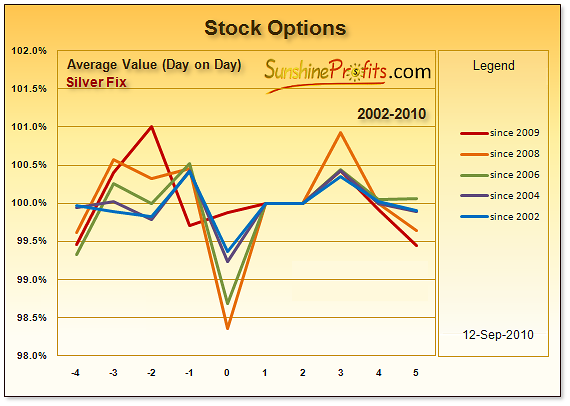
The options chart for silver appears to show an even greater stock options expiration influence on its price. Price increases just before stock options expirations are visibly higher here and a sharp decline is seen soon thereafter. It does appear, however, that this is but a temporary affect and price levels soon return to pre-option expiration date levels. In short, long-term investors should not be overly concerned with silver's price volatility following options expirations.
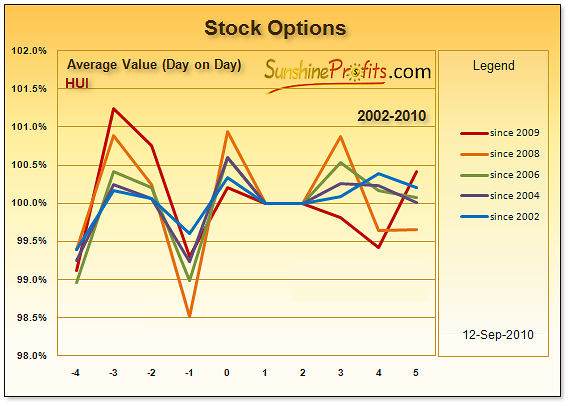
Since the HUI Index consists of mining stocks, it seems likely that pre-stock option expiration date price movement would be really important here. At the beginning of the week, that is four to three days before expiration, prices appear to rise. The pattern then seems to be price decreases for the following two days, usually in the range of 2%.
For long-term investors, this price action is not a huge influence. It is however important for Day Traders and short-term Momentum Players. For this reason, it is advised that stock options expiration dates be noted and watched closely for people falling into these categories.
Again - the above is something that we are still working on, so stay tuned for increased efficiency and more interactive form of presentation.
Letters from Subscribers
Answering questions we are receiving on daily basis has become a regular part of our updates so we decided to transform the usual "Other Information" section into "Letters from Subscribers". Anyway, let's start with a question about charts, patterns and algorithms that we are using that could have evolved along with the change in the underlying economic context. This could imply these tools are no longer applicable. Generally, our reply is somewhat to what we've already discussed in the September 3rd Premium Update, but still we would like to remind how and why it works. Charts can discount large amount of information, such as business and presidential cycles and so on, but the only thing that could invalidate their usefulness at all would be the change in human psychology and that is something is not going to change from one year to the next, or from one president to the next. After all - there are even 50-year and longer charts that provide relevant information that they definitely take many economic environments into account. Please refer to abovementioned Premium Update for in-depth analysis of this subject.
Second part of this question was about managing to increase one's portfolio with several predictions being off the target. This something that we often strive to emphasize. What one can lose or earn depends on good balance between speculation and investment parts of one's portfolio. Assuming that one is utilizing small part of capital to execute speculative position with options, it will be usually enough to win at least one out of several couple of trades. If the probable gain is bigger than the maximum loss (100% here) then betting on a given move can be profitable even if the odds of that move taking place are lower than 50%.
Here's an example: imagine that we are in situation when we can win one out of every three trades we make (33% chance of winning ) but when we lose, we lose only the amount that we used for this bet. However let's assume that winning will produce 20-fold gain (2000%) of our initial investment. Isn't it worth the risk of being wrong (there is 67% probability that one is wrong here)? Certainly it is and that is what we call a favorable risk-reward ratio. But how much should one put in that trade? Simply use our Position Size Calculator to obtain the answer (type 33 as short-term probability and 2000 as short-term profits - you will see that using more than 29.6% of your speculative capital for such a trade is not the most profitable way to approach this trade).
We have also received questions regarding the junior ranking and what to do with stocks that did not perform well as of late. Well, while it might appear surprising - it may not really matter because when stocks start to go down, owning big senior stocks will be much preferable to the ownership of juniors - meaning that one should get out of this sector with most of the holdings. Once things settle down a big on the general stock market, we will once again focus on providing you with best stocks to buy. So, the big question remains what will happen on the general stock market. If we get a confirmation that lower prices are very likely in the following weeks, or months, then we will suggest selling juniors. Please keep in mind the long-term Hindenburg Omen, which has very bearish implications in the long run. This is also what we have discussed in August 27th Premium Update.
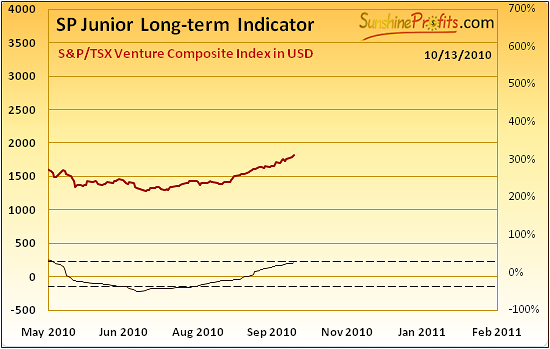
By the way, while the SP Junior Long-term Indicator did not flash a "switch from juniors to seniors" signal yet, it is very close to doing so - once it gets above the dashed line and starts to decline, we will have the long-term sell signal. Please take a look below for details:
Summary
Points made in last week's update and in the recent message are still current and up-to-date.
This week's signals are quite similar to what was seen last week. Although we did not see declines as we anticipated in the past five days, we do expect these to materialize in the coming week. The probability of these declines has not decreased and the signals are still in place and pointing in this direction - especially given bearish situation in stocks and short-term very bullish picture for the USD Index.
Daily price declines and small volume price increases with a price decline on the following day are the telltale signs that will foretell that the decline has likely begun. Sunshine Profits will continue to monitor all markets and inform our Subscribers as warranted.
This completes this week's Premium Update.
Thank you for using the Premium Service. Have a great weekend and profitable week!
Sincerely,
Przemyslaw Radomski

