

Yesterday I had the pleasure of Przemek Radomski, the Founder and Editor-in-Chief of Sunshine Profits, introducing me to you as the new author of the Stock Trading Alerts. It’s a thrill to be here, and I’ll be bringing these Alerts to you daily from Monday to Thursday, with the occasional publication on Fridays dealing with subjects like trading psychology. I also invite you to check out my full bio.
So, let’s roll with today’s topic – smart grids.
Do you have exposure to smart grids in your portfolio? Many savvy investors are looking at clean energy and smart grids - and with good reason.
After the passage of the $1.9 Trillion Covid relief bill, the attention of Wall Street turned to President Biden’s $2 Trillion (with a capital T!) infrastructure plan. This massive spending plan is a partial catalyst to a potential industrial beneficiary of this plan, Electric Grid Improvements.
Smart energy and smart grids have taken on a theme in many investors’ portfolios lately. One below the radar index is the NASDAQ OMX Clean Edge Smart Grid Infrastructure Index. There is an ETF on this index (GRID), and that is our focus of analysis today. GRID targets companies involved with upgrading America’s electricity grid with new technologies and transforming the electric system into a more efficient machine. At the time of this writing, the top 5 holdings in this ETF are ABB Ltd. (SWX:ABBN), Johnson Controls International plc (NYSE:JCI), Eaton Corp. Plc (NYSE: ETN), Schneider Electric SE (EPA: SU), and Aptiv PLC (NYSE: APTV). You can take a look at the other top holdings and key data on GRID in the ETF Database.
Although this ETF does not have a ton of volume like SPY or IWM, it does have ample liquidity with an average trading volume of around 60,000 shares each day. It can provide investors with some exposure to this area, which falls under the “Quality of Life at Home” part of the infrastructure plan agenda - featuring $650 Billion of proposed investment. GRID has an 8.27% YTD return as of the time of this writing.
Now that we have a basic overview of what the GRID ETF is all about, let’s turn our attention to the technicals.
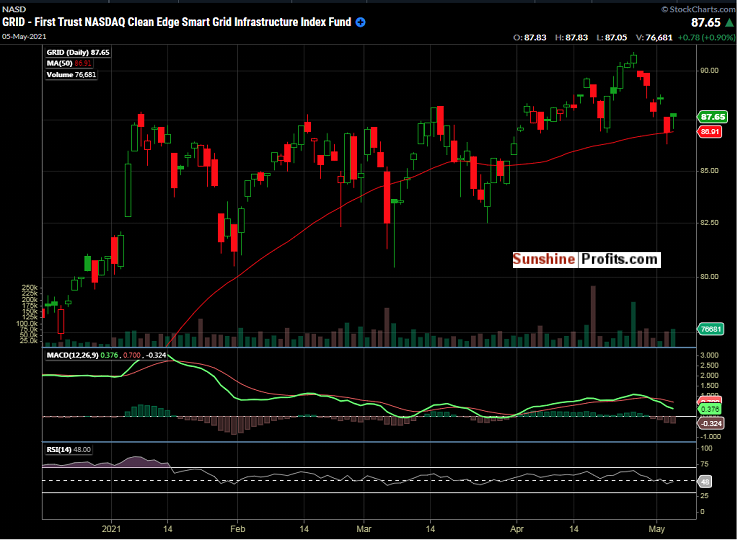 Figure 1 -First Trust NASDAQ Clean Edge Smart Grid Infrastructure Index Fund (GRID) Daily Candles December 16, 2020 - May 5, 2021. Source stockcharts.com
Larger Chart: https://stockcharts.com/acp/?s=GRID
As we can see from our chart, GRID has been chugging along steadily higher after a price consolidation period from January to the end of March. It recently broke out above the higher end of this consolidation range and traded up to $90.96 on April 27, 2021. Since putting in this 52-week high (and all-time high), it has traded back down to; and below its previous consolidation high ($88.17). The last trade on May 5, 2021, was $87.65. GRID tested its 50-day moving average on May 4, 2021 (which was $86.85 on this day) and closed just above it, ending the session at $86.87. This indicates to me that some eyeballs were on this ETF towards the market close on May 4, 2021. Let’s take a closer look at the intraday action that formed this closing value just above the key 50-day moving average on that day.
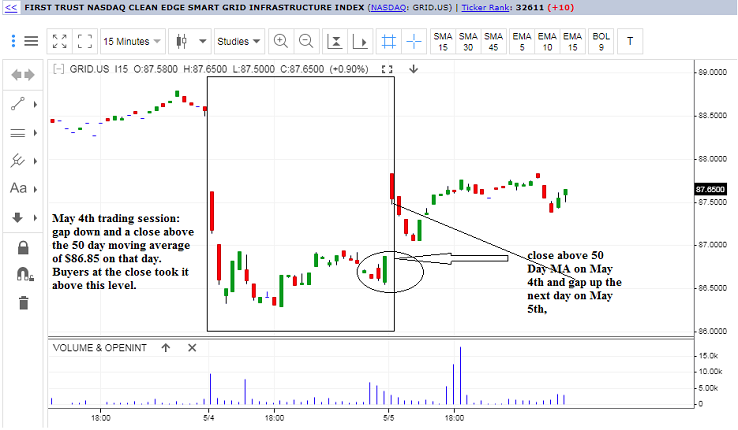
Figure 2 -First Trust NASDAQ Clean Edge Smart Grid Infrastructure Index Fund (GRID) 15 Minute Candles May 3, 2021 - May 5, 2021. Source stooq.com
Larger Chart: Here
Drilling down to the intraday 15-minute candles, we can see more clearly that there was indeed some buying during the last hour of trade on May 4, 2021, pushing the price over this 50-day moving average. When I see something like that, it tells me a picture story - it paints a technically bullish picture in the story of this ETF.
Next, I consider the previous consolidation high level of $88.17. At the time of this writing and based on May 4, 2021, close, we are currently below this level. Let’s see what the market does in the morning. Seeing how the 50-day moving average held up so well on a soft broader market session on May 4, 2021, combined with the gap up on May 5, 2021, the picture story seems to be unfolding favorably for GRID bulls.
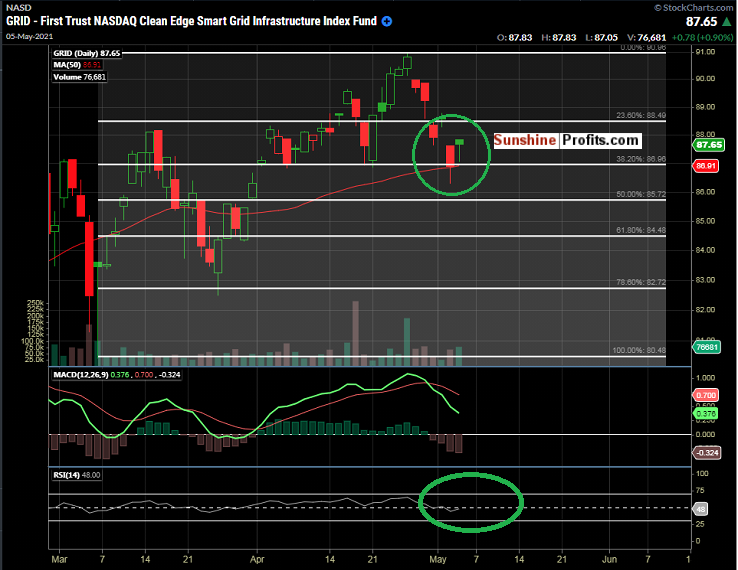
Figure 3 -First Trust NASDAQ Clean Edge Smart Grid Infrastructure Index Fund (GRID) Daily Candles December 16, 2020 - May 5, 2021. Source stockcharts.com
Larger Chart: https://stockcharts.com/acp/?s=GRID
Notice that the RSI(14) is looking to cross the 50 line to the upside. This is a bullish clue after the recent selloff. Also, notice how the 50-day moving average coincided with the 38.2% Fibonacci retracement level from the low put in on March 5, 2021, to the high of 90.96 on April 27, 2021. Combining this with the 50-day moving average test holding up successfully, this is what I like to call a “confluence of indicators.”
Given the consolidation in GRID during Q1 of 2021, the recent trading above this range, and the 50-day moving average holding up well on this last test, and other technical indicators mentioned above, GRID seems like it wants to grind its way higher. On top of this, we have the massive infrastructure plan in the US in the works. The fundamental and technical story is intriguing. Therefore, the levels that come to mind create a buy range to consider between the 50-day moving average of $86.91 and the old consolidation high of $88.17. Ideally, if the broader markets open lower on May 6th, 2021, a favorable buy fill opportunity could exist. I always suggest using sense when entering orders, like waiting for an intraday pullback for a good entry. In my opinion, for traders looking to swing trade or hold for longer than a few days, the current levels are attractive.
To sum up the current viewpoint and opinion:
I have a BUY call for:
- First Trust NASDAQ Clean Edge Smart Grid Infrastructure Index Fund (GRID) between $86.91 and $88.17. This could be a long-term holding for those that want to have exposure to the US Infrastructure story as it develops. Short-term traders can look at the 52-week high of $90.96 and high $90.00s to the psychological $100.00 level as take profit level ideas. Always use a stop loss level that caters to your individual risk tolerance.
- S&P 500 (SPX): but ONLY on a pullback to; or below the 50-day moving average (currently 4014) making the suggested range for entry 3990 - 4014. A close below the 50-day moving average on a given day is a suggested stop loss level. Adjust stop level for your individual risk tolerance.
Good trades to you all!
Thank you.
Rafael Zorabedian
Trading Strategist

