

Trading position (short-term; our opinion): Long positions (100% of the regular size), with stop-loss level at 3170 and the initial target price at 3400
Regardless of Tuesday's ominously-looking candle, stocks powered to new 2020 highs yesterday. Again, and in spite of the uncertainties out there. That's what bull markets do - they keep climbing a wall of worry. In light of today's premarket move lower, let's do a check on our market assessment.
We'll start with examination of yesterday's upswing on the daily chart (charts courtesy of http://stockcharts.com).
Let's recall our yesterday's observations as they're still valid today:
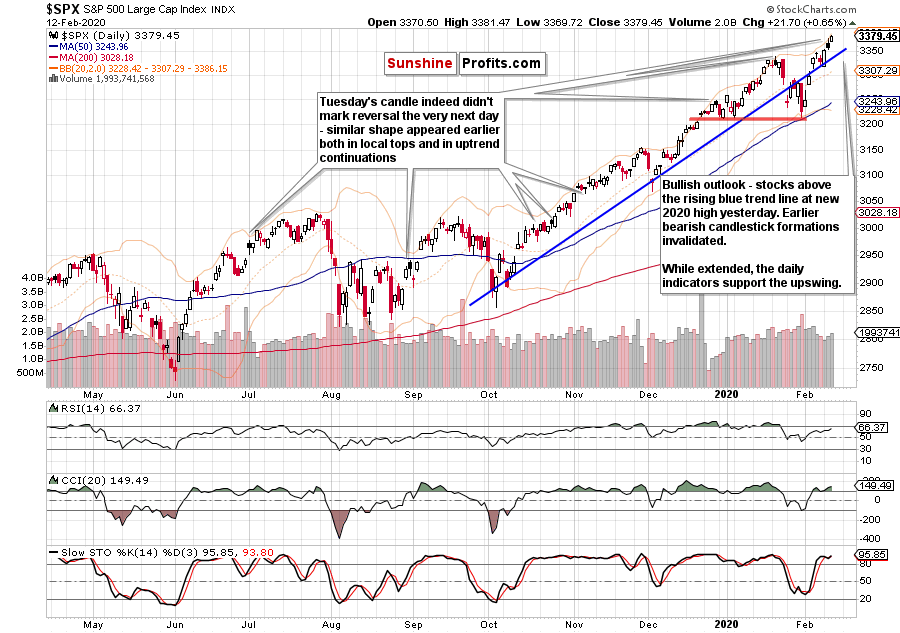
(...) Bearish gap and the abandoned baby formation are history, and stocks trade comfortably above the rising blue trend line. What's more, the weekly outlook discussed on Monday also supports the bulls. What about the daily indicators? Check, as they continue supporting the bulls. Just don't take Stochastics' sell signal at face value - it was flashed in the overbought territory, and signals there frequently lead to whipsaws.
And Stochastics has indeed invalidated its earlier sell signal. Stocks reached a new 2020 high yesterday, hinting that Tuesday's candle marks uptrend continuation after all. Just take a look at the above chart again - it shows how many times were similar candles followed by renewed push higher.
Let's take a closer look at the breadth of yesterday's advance. Does it confirm the upswing?
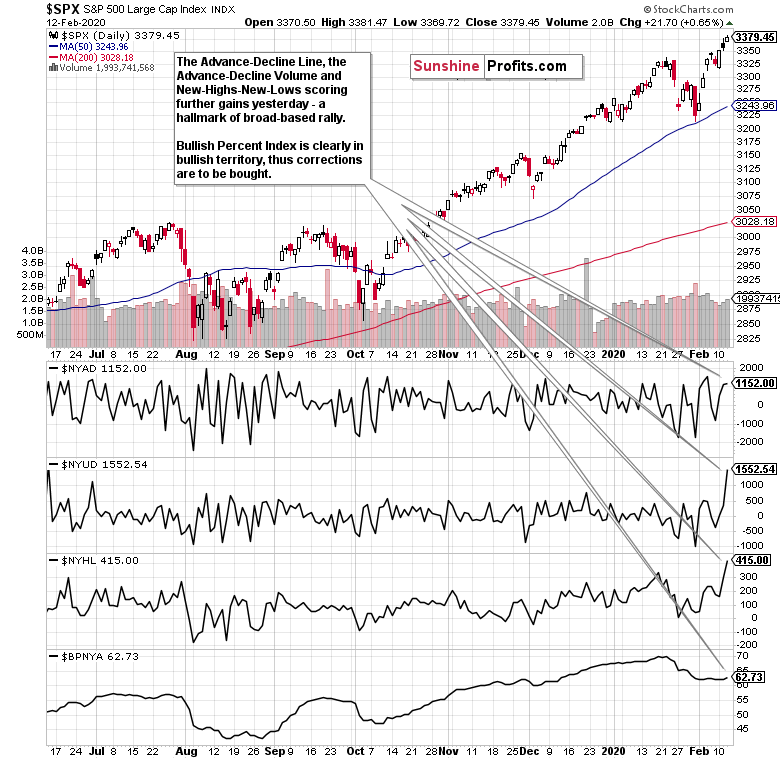
Both the advance-decline volume, and new highs minus new lows moved sharply higher yesterday, confirming the broadly-based advance even more than they did yesterday. The advance-decline line also remains in solidly bullish territory. Finally, the bullish percent index is not only above 50%, but also curling higher. That shows increasing buying interest - in other words, upswing confirmation and continuation within the context of a bull market.
In today's premarket trading, stocks dipped to trade at around 3360 currently. Is that a reason to be concerned? It doesn't appear to be so, as stocks are still above the rising blue trend line and the posture of daily and weekly indicators is unchanged.
Regardless of the uptrend's strength, we're bound to get a correction every now and then. The bigger risk is actually missing the strongest part of the uptrend that doesn't really offer corrections. That's because when you get one, it can come at a much higher level, and when the uptrend has already lost some of its breath.
And what was the likely catalyst of today's premarket selling? Could it be the update to China's coronavirus spread tracking that in effect hikes the official numbers? It would be interesting to take a look at the situation in mainland China - how exactly is their stock market doing. Does the chart below look like the world is ending?
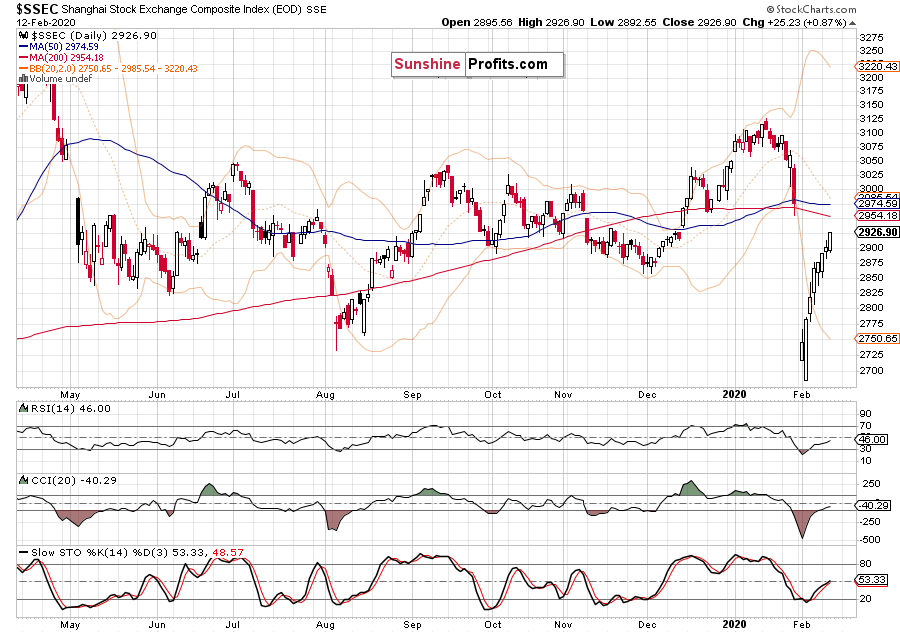
Shanghai Composite is China's equivalent of S&P 500. Since it reopened after the New Year celebrations, stocks have been climbing higher, and have already almost closed the 8% early-February gap. That's quite a feat, showing the market welcomed the new liquidity's backstop with open arms.
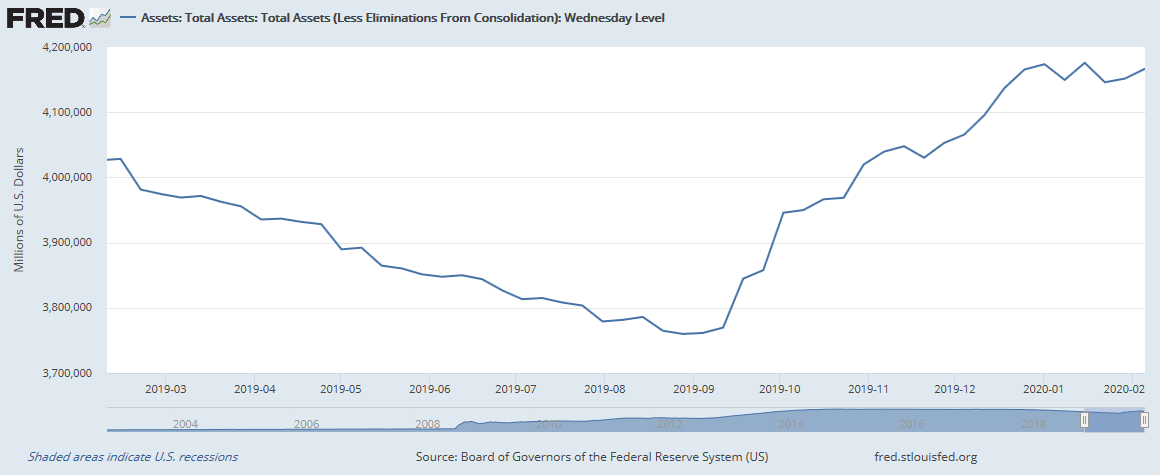
And what about the Fed? Let's take a quick look at its most recent balance sheet developments. The freshly published data series (chart courtesy of St. Louis Fed) ends at Feb 05, 2020, revealing return to balance sheet expansion after a steady January. Since Q3 2019, the repo liquidity operations started - this is what's also known under the term non-QE4. Finally, look no further than the just concluded Powell's Congressional testimony with all the forward guidance and quantitative easing hints.
Bottom line, central banks stand ready to support the markets. Last but not least, remember Trump's tweets and the way stock market advances are presented, cherished, and owned. It clearly sends a message that the President wouldn't be too happy to see them tank and jeopardize the 2020 election prospects...
As you have seen, both technically and fundamentally, the long position remains justified. The chart examination reveals a strongly bullish outlook, and the fundamental backdrop presented supports higher prices ahead as well.
Summing up, the S&P 500 outlook remains bright. Price examination, weekly and daily indicators are supported by the breadth indicators, and continue to paint a bullish picture. As the index keeps making and challenging new 2020 highs practically on a daily basis, any imaginable correction isn't likely to stretch below 3200 in our opinion. The currently open long position remains justified, and our aim is to let the many bullish factors in this stock bull market keep working in our favor.
Trading position (short-term; our opinion): Long positions (100% of the regular size), with stop-loss level at 3170 and the initial target price at 3400
Thank you.
Monica Kingsley
Stock Trading Strategist
Sunshine Profits - Effective Investments through Diligence and Care

