

Trading position (short-term; our opinion): Long positions (100% of the regular size) at market, with stop-loss level at 3170 and the initial target price at 3400
Stocks opened yesterday with a bullish gap, reached for new highs only to reverse down and close near the daily lows. The black body of the candle looks ominous. But should it make us concerned that the upswing is over, this minute?
Let's put yesterday's session within the context of the daily chart (chart courtesy of http://stockcharts.com).
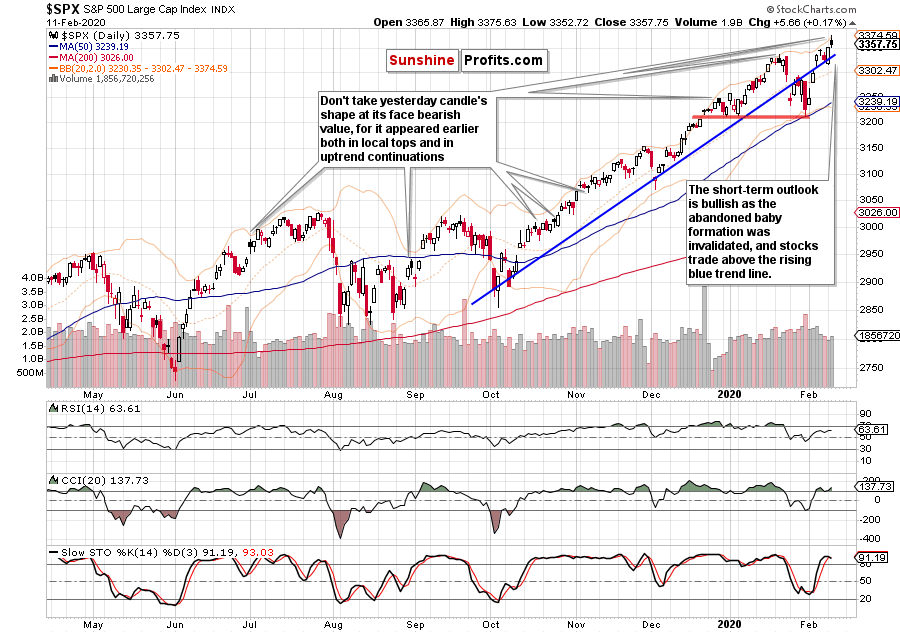
Bearish gap and the abandoned baby formation are history, and stocks trade comfortably above the rising blue trend line. What's more, the weekly outlook discussed on Monday also supports the bulls. What about the daily indicators? Check, as they continue supporting the bulls. Just don't take Stochastics' sell signal at face value - it was flashed in the overbought territory, and signals there frequently lead to whipsaws.
But what about the shape of yesterday's candle? How meaningful is its reversal lower?
As you can see on the above chart, there have been quite a few instances of a higher opening followed by downside close within uptrends. Not too many marked a local top though. Quite often, another push higher followed - and sooner rather than later. That explains why seeing the futures bobbing around 3370 right now isn't out of the blue.
With yesterday's breadth analysis, we examined whether the advance from late-January lows has been as strong as it seems. We noted that:
(...) Breadth indicators send an important message, as they either confirm or flash a divergence with prices. Currently, neither the advance-decline line, nor the advance-decline volume confirm this reversal. New highs minus new lows also has a serious catching up to do.
That's the very short-term view. Over time, these breadth indicators either move to new highs, thus confirming the price advance, or the S&P 500 moves lower because the bulls aren't as strong as it seems by looking at prices only.
Let's check the reflections of yesterday's session on the stock rally internals.
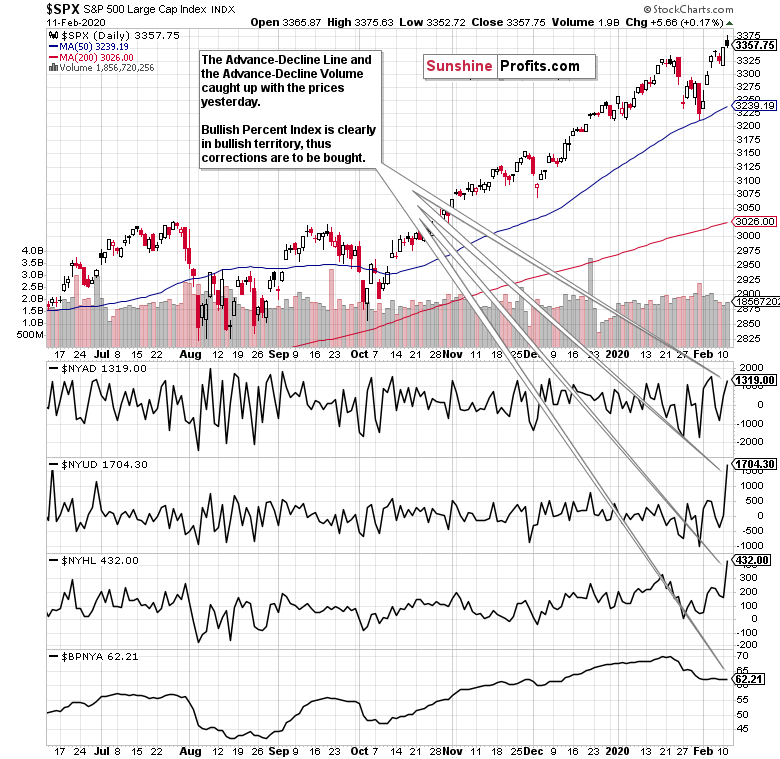
What a difference a day makes, right? Despite the very short daily timeframe, it's indeed the case. Both the advance-decline volume, and new highs minus new lows confirm this advance now. The advance-decline line has also moved into a strongly supportive territory. The bullish percent index over 50% shows we're in another bullish phase.
This chart shows that the breath indicators have caught up with the price advance, seriously downgrading the likelihood of a sizable downswing being imminently favored by the indicators.
So, what does a bull that's not participating in last week's reversal do now? Throw in the towel and just press the buy button?
Pullbacks are part of every healthy uptrend, and they can come with a catalyst of without. Coronavirus raising its uglier head than so far could be one of them. The Fed moderating the pace of balance sheet expansion could be another. Yield curve reinversion or not so many green shoots in the industrial recovery could be another.
But they may come when the index is at higher levels, thus missing part of the prior rally. Look how little the coronavirus scare has been able to accomplish in terms of a pullback. Whatever consolidation we get, isn't in our opinion likely to stretch below 3200, thus it makes sense to open long position (100% of the regular size) at market (3375 currently), with S/L at 3170 and letting the many and strengthening bullish market forces work in our favor.
Summing up, the S&P 500 outlook didn't darken with the shape of yesterday's candle. Actually, the breadth indicators point to an even brighter outlook now than was the case on Monday. The weekly and daily indicators also support the upswing. As the index is making new 2020 highs practically on a daily basis, it's reasonable to expect predominantly shallow consolidation of gained ground. It can take shape of higher highs and higher lows (that would be a running correction), sideways trading, or an occasional bearish push lower. In our opinion, any correction isn't likely to stretch below 3200, thus it makes sense from the risk-reward perspective to open long positions and let the existing bullish factors work in our favor. Stocks are in a bull market that's climbing a wall of worry. In other words, it's alive and well.
Trading position (short-term; our opinion): Long positions (100% of the regular size) at market, with stop-loss level at 3170 and the initial target price at 3400
Thank you.
Monica Kingsley
Stock Trading Strategist
Sunshine Profits - Effective Investments through Diligence and Care

