

Trading position (short-term; our opinion): short positions with stop-loss at 3050 and the initial downside target at 2200 are justified from the risk/reward perspective. It's a big-picture trade if you will, which means that the trade parameters are relatively distant price points. Remember that you can adjust your own position sizing so that the risk per trade meets your very personal preferences. We'll manage the open position flexibly and in line with the incoming signals supporting/refuting the projections, but the above price points are the big picture layout.
Today's extensive Alert will evaluate the week that just passed, and examine the health of the S&P 500 advance. We'll look both at various credit market metrics, and at the key S&P 500 sectors and ratios. Putting the pieces of the puzzle together will enable us to make profitable trading decisions as the bullish fever is rising. Just how much is that sentiment justified?
Let's start with the S&P 500 itself, and check the weekly and daily perspectives (charts courtesy of http://stockcharts.com ).
S&P 500 in the Medium- and Short-Run
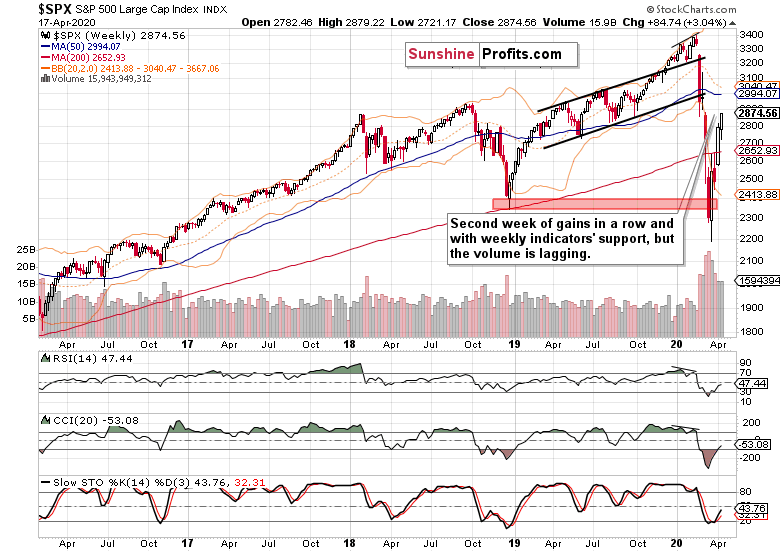
The weekly chart shows how far the rally has reached. The breakdown below the red support zone marking the Dec 2018 lows has been invalidated, and the subsequent bears' push lower has failed. Last two weeks brought us higher prices, but the upside momentum decreased in last week as the bears reemerged.
Were the volume behind the upswing larger, it would make the price recovery more credible. It's true that the weekly indicators are by and large on their buy signals, but how much can they be trusted?
Let's check the detailed daily chart to find out.
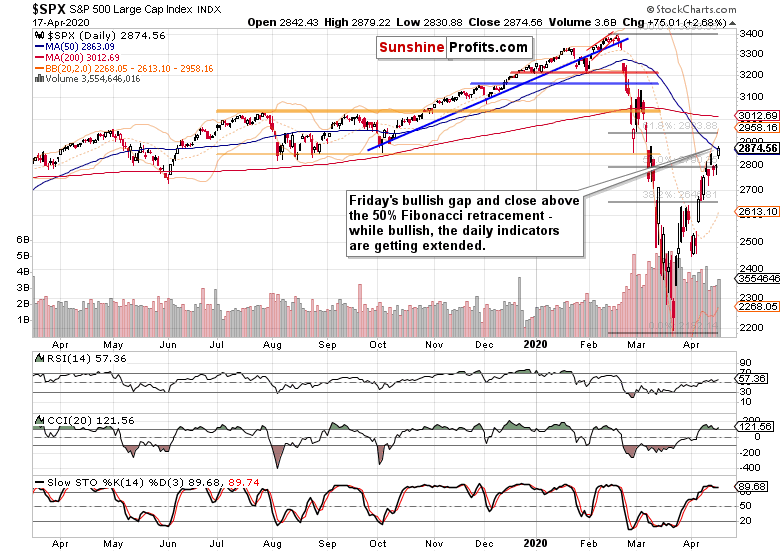
Friday's session opened with a bullish gap well above the 50% Fibonacci retracement, and while the sellers took price action back to its proximity, the buyers staged a strong comeback in the session's final hour. Failing that, many of the below bullish-leaning points couldn't have been made.
Encouragingly, it happened on higher volume than what characterized the last two down days. While the volume was slightly higher than that of Tuesday's push higher, it was lower than last Friday's one (that was the day when the 50% Fibonacci retracement was first tested). This raises some doubts about the bulls' ability to extend their gains considerably higher in the coming days.
The daily indicators are getting increasingly extended, with both CCI and RSI struggling to keep from rolling over. Stochastics' overbought readings will arguably take longer than it is the case with CCI to flash its upcoming sell signal. These increase the likelihood of the S&P 500 taking a breather shortly.
Just like we've seen quite a few bullish gaps in the recent days and early April, bears may respond with some of their own making (and today may be first such day as the S&P 500 futures trade at around 2825 as we speak). Remember, many of those declining days in March were characterized by sudden bursts of buying within the final hour - this pattern is not exclusive to the up days since the Mar 23 low.
Not only have prices reached the 50-day moving average that's serving as resistance, but also the lower border of the sizable early March bearish gap, which is reinforced by the 61.8% Fibonacci retracement at its upper end.
As we move to the credit markets assessment, let's bring up our Thursday's intraday commentary as it remains valid also today - and given the S&P 500 closing prices, even more so:
(...) the credit market metric of high yield corporate bonds to short-term Treasuries keeps trading down. That serves to confirm thin air as the S&P 500 challenges 2800, and actually points to a disconnect between the two markets. And it's the bond guys who usually get it right, which is one more reason apart from the fundamental coronavirus fallout, why we expect renewed selling in stocks.
The Credit Markets' Point of View
So, what about corporate bonds to Treasuries? While the investment-grade corporate bonds (LQD ETF) keep trading in a tight range much closer to their recent highs than the high-yield ones (HYG ETF), it's the riskier ones that should be leading higher in a risk-on rally. Otherwise, it would represent flight to quality along the lines of Treasuries' outperformance (SHY and IEI ETFs). In other words, we would still be in a risk-off environment.
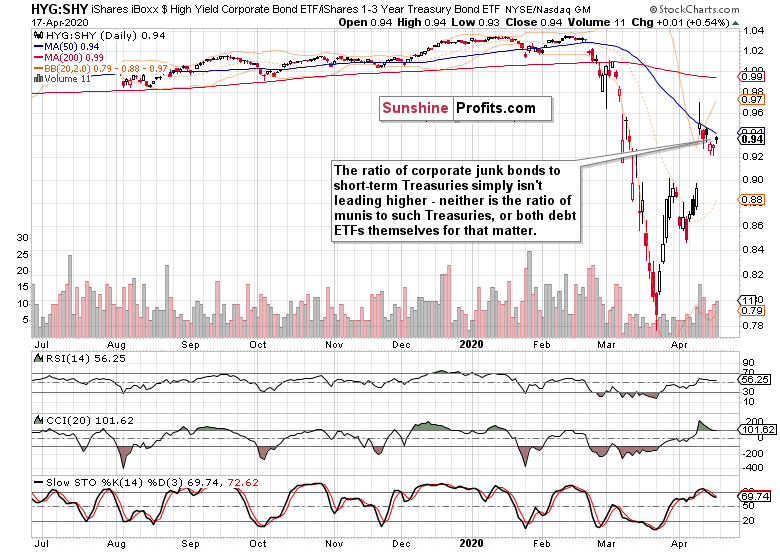
The ratio of corporate junk bonds to short-term Treasuries didn't start leading higher on Friday either. It's still trading well below the Fed $2.3T bombshell highs, pointing to the defensive nature of the S&P 500 rally.
Talking short-dated Treasuries, let's see with what kind of veracity they moved lower as the S&P 500 moved above the 50% Fibonacci retracement.
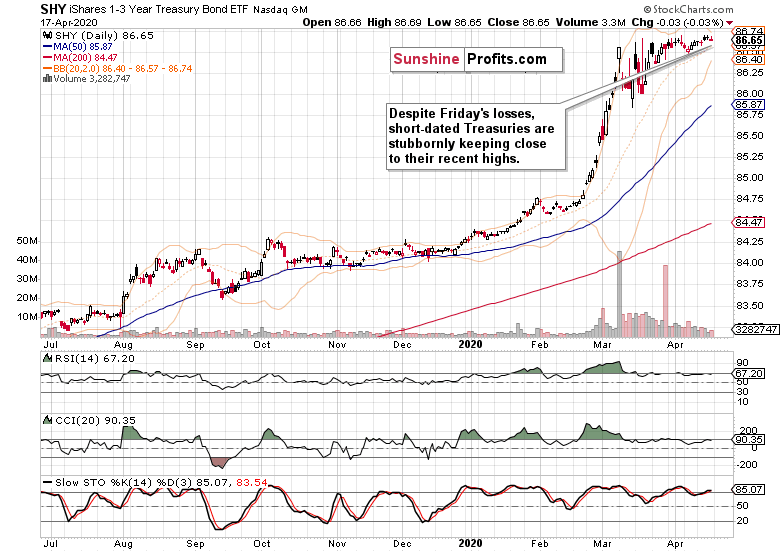
That's not what we would call a turning point or downside break exactly. Such action supports the notion of risk aversion.
Examination of the S&P 500 performance by various key sectors and their ratios should help us refine the picture.
S&P 500 Sectors' Analysis
We'll start with the leading metric of risk-taking: the ratio of financials to utilities.
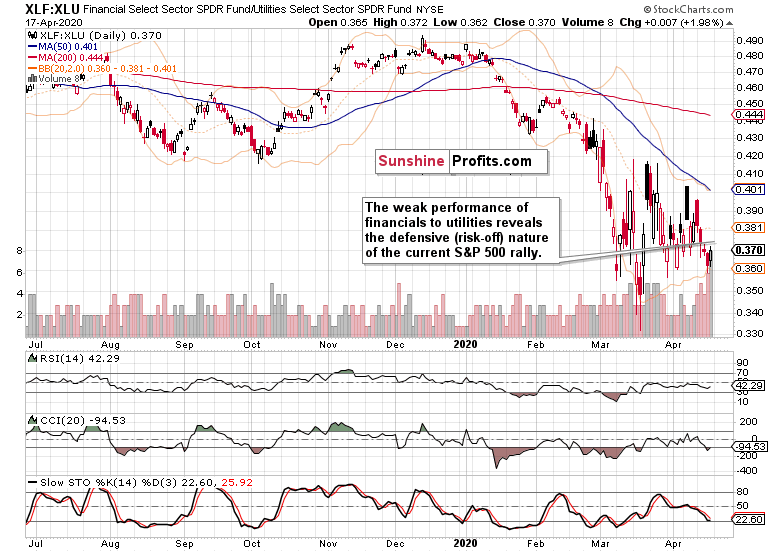
As the ratio appears ready to beat late-March lows and take on the March panic bottom next, it shows that financials as the risk-on asset class are declining relative to the defensive utilities sector.
Are utilities (XLU ETF) really as strong here - just as Treasuries would imply? What are the other bright spots in the S&P 500 rally? And what about financials (XLF ETF)? Let's check all three.
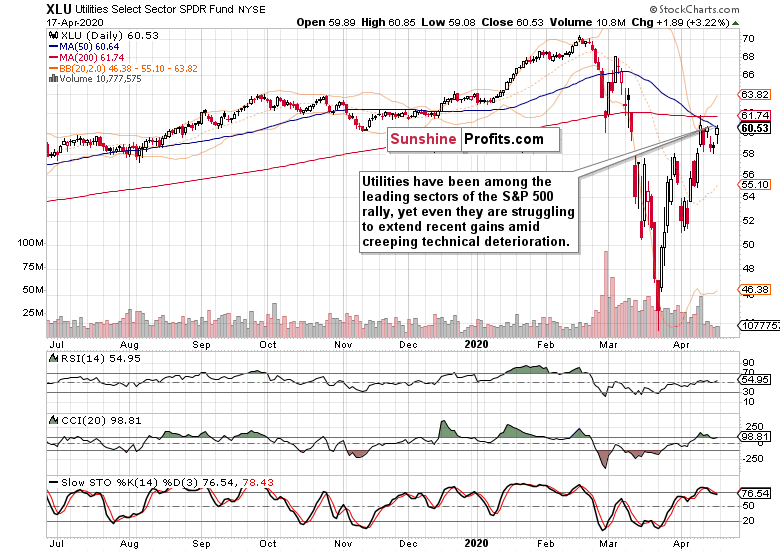
Utilities are clearly among the best-performing S&P 500 sectors. As they're consolidating their post-Fed announcement gains, they haven't performed as well as the short-term Treasuries (SHY ETF) or investment-grade corporate bonds (LQD ETF), but still have outperformed the credit markets (HYG and HYD ETFs).
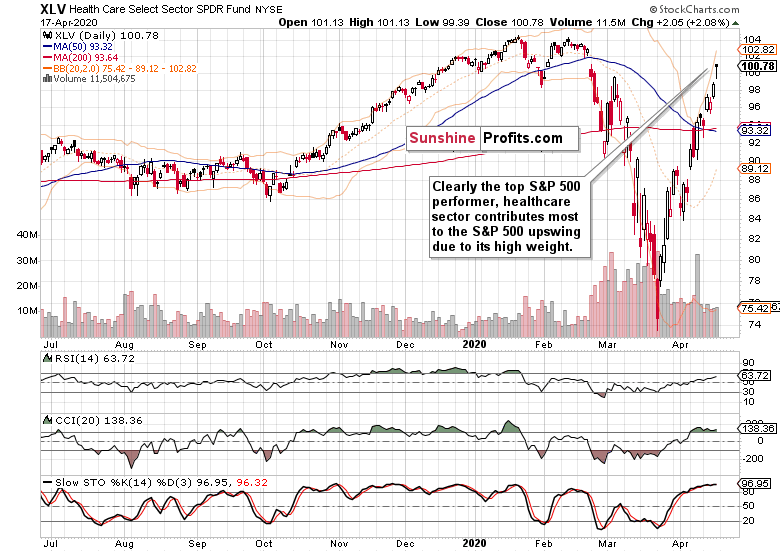
Healthcare is a star performer among the S&P 500 sectors, closing higher than any day in March. While the daily indicators are extended, the volume doesn't warn of an impending reversal.
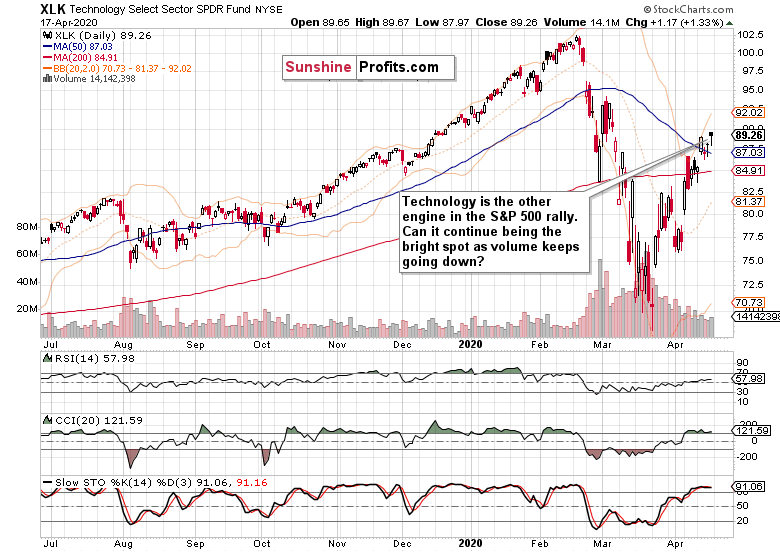
Having repelled the selling pressure to close the opening gap (just like S&P 500) in the final hour of trading, technology shares are another sector leading the S&P 500 higher. Apart from the extended daily indicators, the key watchout is the volume that's trending down since the second half of March. This shows that the bulls aren't as strong as they appear to be. Remember, tops form when there's no one left to buy. Just how close are we to this point?
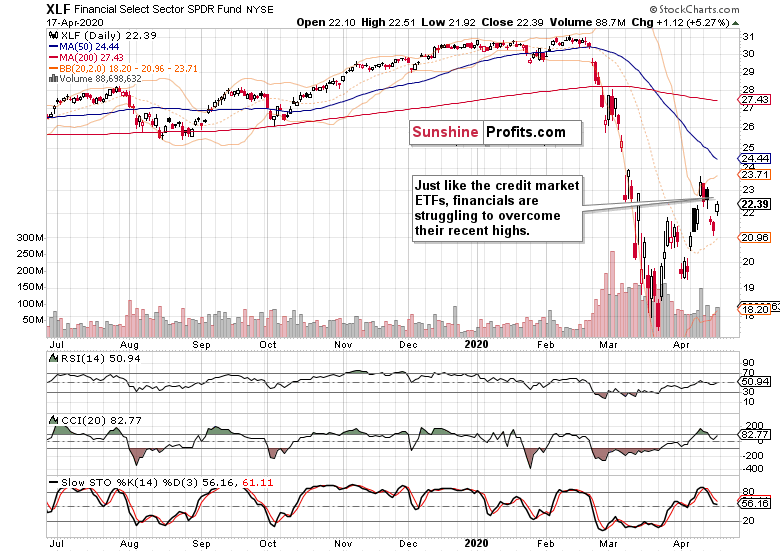
Financials are clearly lagging behind. Similarly to the leaves that fall off a tree one-by-one as autumn progresses, a stock market rally stalls and rolls over as more and more sectors refuse to move higher. In other words, a rising number of troops don't follow the generals uphill.
Even if the S&P 500 rally goes on a bit longer in the short-term, this constellation doesn't bode well for its prospects. Neither does the weak performance of the energy sector shown below.
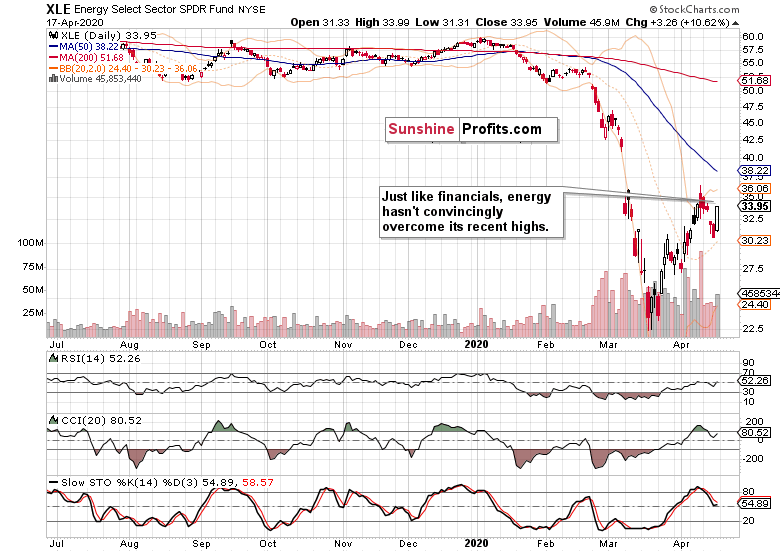
They're the laggards, and over at Oil Trading Alerts, we're making a killing shorting oil as you can see in its most recent Alert. Such a weak performance is a bad omen for stocks, despite the low weight of the energy sector in the index.
Kicking off with the financials-to-utilities ratio, we've have already covered the three top-share S&P 500 sectors (technology, healthcare and financials). But there is one more highly informative ratio to look at. It's the consumer discretionaries to consumer staples.
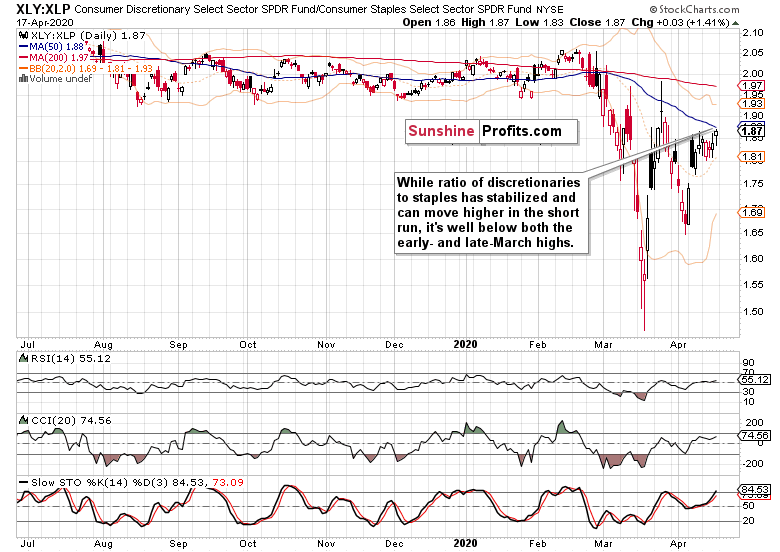
The caption says it all. The ratio isn't yet trending up, and reveals the badly-shaken consumer. It reflects the stunning drop of Wednesday's retail sales data (changed consumer attitudes and outlook), and doesn't really point to its turnaround in May. That's similar to what we see in the financial sector - banks are raising the loan losses provisions as the pain is slowly but surely cascading through the system. The current earnings projections are also overly optimistic, which goes to show that should stocks keep trading at these levels, they'll become relatively more expensive than in the recent past as the P/E ratio would show. Coming back to the discretionaries to staples, it shows no return of the consumer just yet and highlights caution.
The Fundamental S&P 500 Outlook
It's totally appropriate to quote our Friday's lengthy analysis:
(...) how come stocks are showing such strength amid the divergencies and faced with grim fundamental data?
Just as we've seen late last week flattening of the coronavirus curve in some of the hotspots such as NYC, yesterday's unemployment claims (as unprecedented as the figure is) have come below the 6000K+ mark of two prior weeks. Is it a satisfactory flattening of the labor market curve? The bleeding is there, sizable and without an end in sight really. More layoffs are coming as the cascading through the real economy proceeds. Even the Fed's Beige Book dating to April 15 is saying so.
Talking flattening of the coronavirus curve, the news on the ground doesn't fully support the optimism. Tuesday and Wednesday brought us the record number of coronavirus casualties, with 2,364 and 2,371 dead respectively. If that's the new normal, it shows that we've reached no US-wide plateau yet, despite the lockdown in hardest-hit NYC going into effect on Mar 22. That's quite a few weeks already and that's the case for the overwhelming majority of other states too.
In fact, the lockdown contribution to halting the exponential spread might be exaggerated, as Mark Twain would himself say regarding reports of his death. Take a look at the comparisons to Sweden, where no lockdown has been instituted, and the country remains open for business. The country is faring reasonably well on a per capita basis.
Trump understands the need to reopen the economy, and has earlier in March called for it to happen by Easter. While that hasn't been the case, the idea has gained traction also within Democratic strongholds on the East and West Coasts. While the governors may disagree on timing, they're moving in the same direction.
This brings us to the catalyst of yesterday's aftermarket upswing in the S&P 500. It has been known already on Wednesday that the President plans to unveil federal guidelines to reopen America for business. And the moment of glory came late yesterday Eastern Time.
But where is the beef, as the memorable Wendy's ad says?
The offered guidelines are about letting some US states and employers to do away with most social distancing measures within several weeks. Discussing preconditions and stages of relaxation, the document is exactly what it's called - a guideline. In other words, it's a federal outline.
Please remember that it's the States' Governors that are responsible for the action on the ground. All the lockdowns have been initiated by Governors, and sometimes even Mayors. None originated at the federal level. While the Trump guidelines are sending an important message, its impact lies in the PR arena as it steals the spotlight while nothing groundbreaking has just yet happened statewide.
While the S&P 500 futures like it and are clinging to most of the overnight gains (trading around 2865 currently), it's far from a safe bet that the courage to start returning life to normal won't backfire, and that the US won't experience another sharp increase in new infections. Look no further than to Singapore for a second wave of the outbreak. The situation in Spain is again worsening after allowing the estimated 300K workers to resume their roles.
Coming back to the Opening Up America Again guidelines, do they mean that the consumer is coming back in a big way?
We're doubtful, and had this to say about the recovery prospects:
(...) In short, the V-shaped recovery is a fantasy. We've discussed the disruptions in our Sunday's special Stock Trading Alert, and encourage you to read it if you hadn't done so already.
Take a look at China - overnight, they've reported the quarterly GDP figures. The drop of -6.8% is unprecedented, and their fixed asset investment and retail sales still keep falling like a hard rock on a year-on-year basis. We fully expect a similar dynamic to play out in the US as well.
These points remain valid, and we've seen resurgence of cases in Japan as the Land of the Rising Sun declares national emergency and the UK extends lockdown for at least another three weeks. Meanwhile in the US, ramped up coronavirus testing on a per capita basis would sharpen the picture...
Many governors seek more test kits and testing so as to move forward with reopening the economies. Getting past the peak doesn't mean that new infections and deaths would plummet to zero just like that. The public is waking up to the economic damage, and we've seen certain protests already. These go to show that the return to status quo ante will be a long process where pressing a button doesn't translate into the economy springing back to life overnight. It's not only in the US - the uncertainties regarding reopening for business persist globally.
We're in the earnings season, with heavy reporting and guidance this week, and even more so the coming one. Market's optimistic assessment will meet the on-the-ground reality of dealing with the economic disruptions, apart from the expect bunch of incoming data.
Still within Friday's Alert, we went on to explore the weekly and daily message copper is sending. The metal with PhD. in economics closed up on the day, supporting the S&P 500 upswing. While extended, the red metal can still move higher in the short run. But is it out of the woods, pointing to a continuing recovery in the S&P 500?
Let's check another metric of the risk-on/risk-off - the copper to gold ratio.
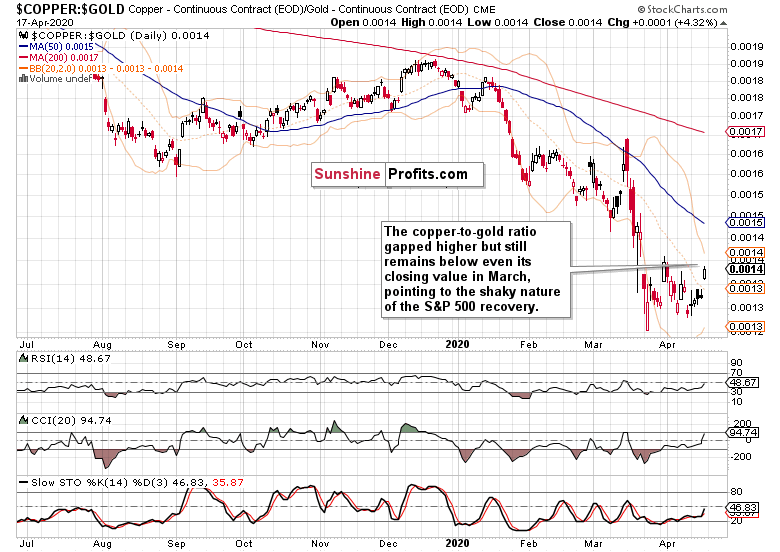
While the ratio gapped higher and can clearly add to its gains in the short-term, it just illustrates the deep fall off the cliff, supporting the conclusion that stocks are still far from sounding the all-clear.
From the Readers' Mailbag
Q: I am reading about trouble in the European Bond market (negative rates have destroyed it), and the possible imposition of a digital currency there. Germany and the Netherlands might be forced to shoulder the debt. Do you follow this and factor it in in some way? Along with this is the Repo market and the Fed's juggling act to balance it. So there are many macro-economic forces at play here.
A: The coronavirus crisis is putting strains on the European debt market, and Italian debt market is actually among the biggest ones in the world. The rise in Italian yields brings back the memories of PIIGS crisis with the familiar fault line between the Club Med countries and the richer North. We've seen it in the failed coronabonds negotiations. We're certainly paying attention also to the gentle nudges towards cashless society - these are all being discounted in the market action on an ongoing basis. Similarly to the Repo crisis and pre-corona strains in some of the incoming US data, there are many moving parts in this saga. As the market decides what to listen to and how to interpret it, you can count on us to bring the truly breaking news and their impact to your attention.
Q: ... it would be helpful to discuss the impending impact of financial crises.
A: As there are parallels between the 2008 and current situation, let's take a look at the Great Recession and stock market performance back then. There have been many false dawns and great volatility, especially in the months of October and November. In the Hope and Change sentiment of the day, stocks scored many sharp rallies in the short run as bad economic news kept coming in. But early in March 2009, they've stopped reacting to poor data that kept pouring in long after the March 09 bottom.
And we expect it to be the case regarding the coronavirus crisis as well. Again, the stock market will reach the bottom earlier than the real economy does. Leaving aside the question whether we have reached the bottom on March 23 or not (we actually might), the risk of a downswing remains high. Markets don't just come off all-time highs without developing some kind of a trading range next.
Summing up, the S&P 500 added to opening gap's gains in the final hour of trading, which certainly helped in brightening the short-term outlook for the bulls. The breakout above the 50% Fibonacci retracement stands a chance as the 50-day moving average and the lower border of the sizable early March bearish gap (reinforced by the 61.8% Fibonacci retracement at its upper end) are being tested. As the credit markets continue to underperform, the S&P 500 rally is being led by defensive sectors and technology. The financials-to-utilities and discretionaries-to-staples ratios don't paint a picture of lasting price recovery. Neither does the copper-to-gold ratio. While we expect stocks to roll over to the downside as the coronavirus fallout gets worse before getting better, that needn't happen tomorrow or the day after. The drive to reopen the economy may come back to bite the decision-makers as the flattened coronavirus curve still appears elusive. Sideways trading followed by renewed selling pressure taking on the March lows, is the optimistic scenario here.
Trading position (short-term; our opinion): short positions with stop-loss at 3050 and the initial downside target at 2200 are justified from the risk/reward perspective. It's a big-picture trade if you will, which means that the trade parameters are relatively distant price points. Remember that you can adjust your own position sizing so that the risk per trade meets your very personal preferences. We'll manage the open position flexibly and in line with the incoming signals supporting/refuting the projections, but the above price points are the big picture layout.
Thank you.
Monica Kingsley
Stock Trading Strategist
Sunshine Profits - Effective Investments through Diligence and Care

