
-
The Bullish Case for Stocks Isn't Over Yet
July 29, 2020, 9:19 AMThe bulls didn't seize upon Monday's stock upswing, and prices declined in what might look as a good-bye kiss to the horizontal line connecting the early June highs. Are stocks about to roll over to the downside? Despite yesterday's deterioration in the credit markets, I think it's too early to jump to such a conclusion.
Technology is holding up, semiconductors aren't weakening relatively to the sector, and the rotation into healthcare, materials, and industrials is very much on. The defensives (utilities and consumer staples) are also improving their posture. Consumer discretionaries are firm, and financials are getting better relative to the index.
Yes, going into today's Fed and especially into Thursday's aftermarket with earnings from selected tech behemoths, the market is likely to move higher if yesterday's AMD results are any indication.
But let's assess where we stand after yesterday's closing bell.
S&P 500 in the Short-Run
I'll start with the daily chart perspective (charts courtesy of http://stockcharts.com ):
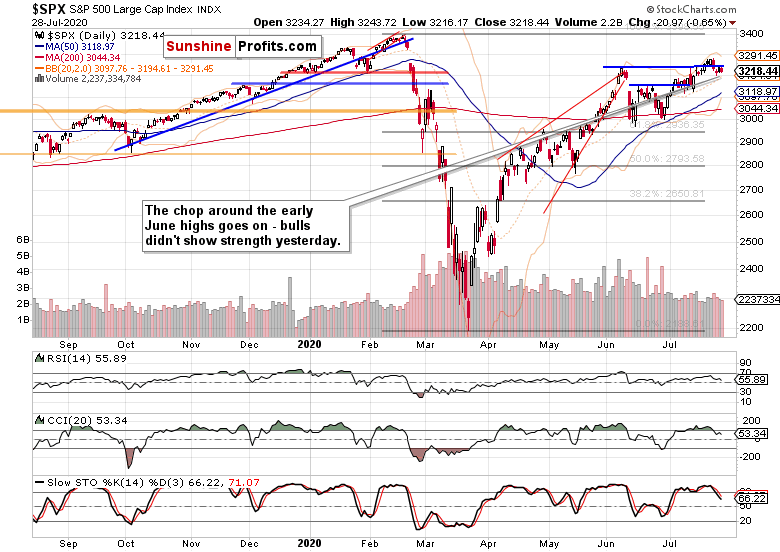
Stocks didn't really improve their short-term posture yesterday. On the other hand, the renewed decline below the early June highs happened on mediocre volume, which means that it lacked broad participation by the bears. If they are serious about taking advantage of the daily indicators' sell signals, they better show up fast.
Could the Fed be the catalyst of such a move? Hawkish policy surprises are out of the question, so would a cautious tone on the recovery perils do the trick, and send markets plunging? Regardless of the real action in precious metals (canary in the coal mine), the Fed would err on the side of not fighting inflation too soon. And thus far fighting the deflationary corona effects, the stimulus is winning and being embraced with open arms by stocks.
So, I think that the bears would be getting ahead of themselves expecting a lasting downturn right now - I treat the consolidation as one with a higher likelihood of a bullish resolution than a bearish one.
Let's see the opinion of the credit markets.
The Credit Markets' Point of View
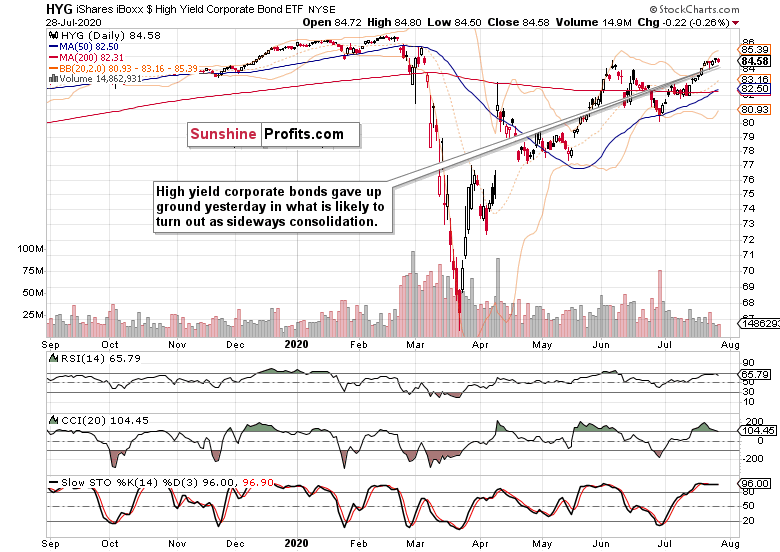
High yield corporate bonds (HYG ETF) lost ground yesterday, but again, the volume didn't dazzle. Thanks to the expectations from the Fed, the sideways consolidation is more likely to resolve with an upswing than not.
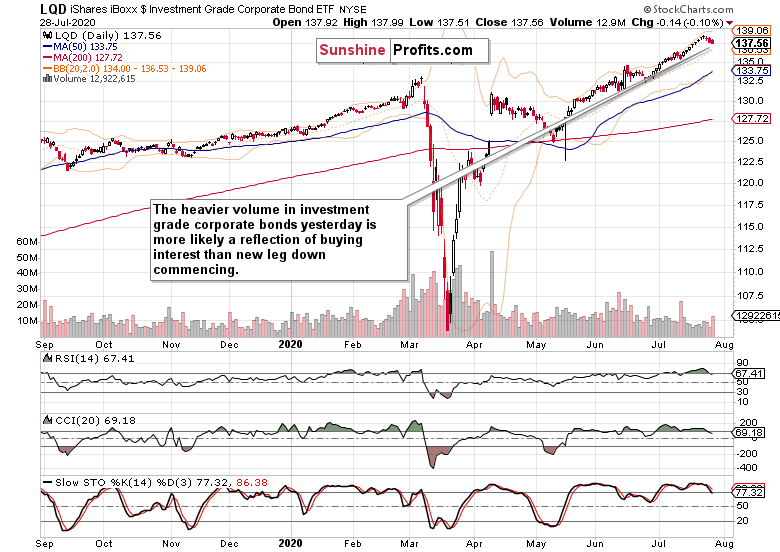
The investment grade corporate bonds (LQD ETF) also declined yesterday, but the limited price move attracted significantly more in terms of daily volume increase than was the case with HYG ETF. That smacks of accumulation to me, and could point to a move higher being not that far off.
These are the indications during the current soft patch in both debt instruments. Now, it's about those clues manifesting in their respective price actions.
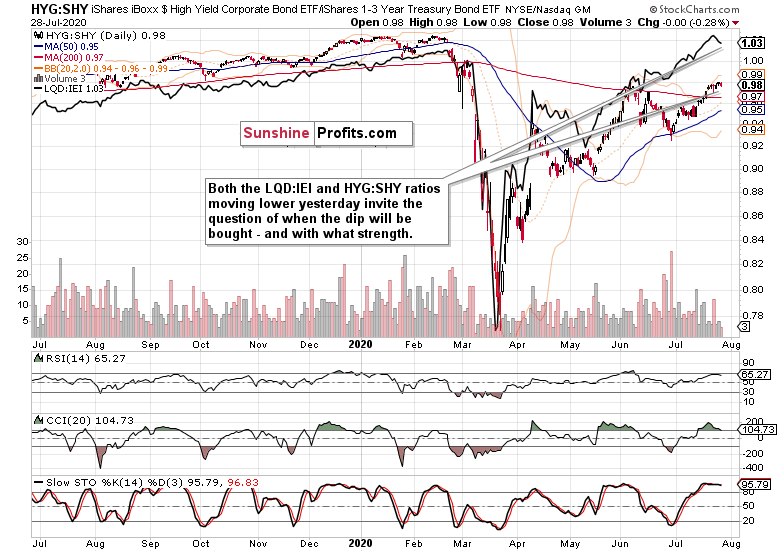
Both the leading credit market ratios - high yield corporate bonds to short-term Treasuries (HYG:SHY) and investment grade corporate bonds to longer-dated Treasuries (LQD:IEI) - finetune the short-term picture of weakness. No market goes up or down in a straight line, and the ratios' swing structure is still favoring another advance, which is more apparent from the following chart.
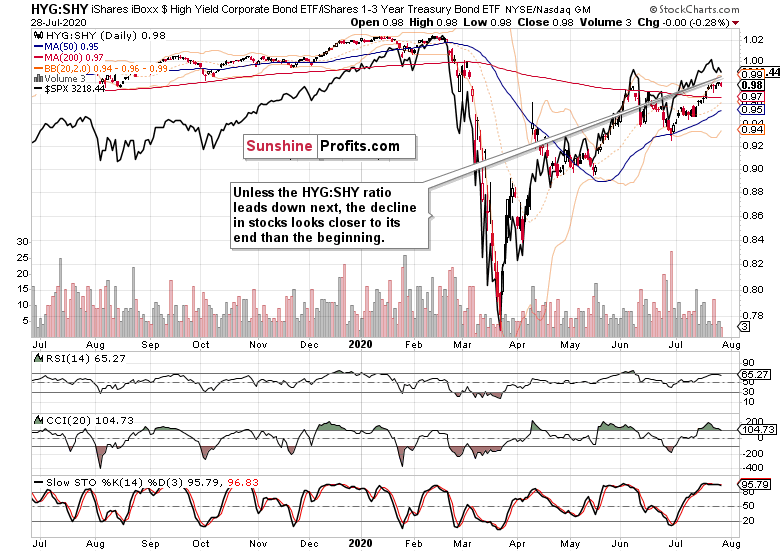
The overlaid S&P 500 closing prices (black line) against the HYG:SHY chart captures the momentary dynamics. Monday's upswing rejected, yet Tuesday's decline can't take prices below Friday's lows. Another rebound attempt in stocks is likely - just take a look at the early July chop, and what followed next.
Smallcaps, Emerging Markets and S&P 500 Market Breadth
Neither the Russell 2000 (IWM ETF), nor the emerging markets (EEM ETF) have sent any clear signals yesterday. IWM ETF mirrored the S&P 500 perfectly yesterday, and EEM ETF keeps consolidating in its bid to outperform the U.S. index.
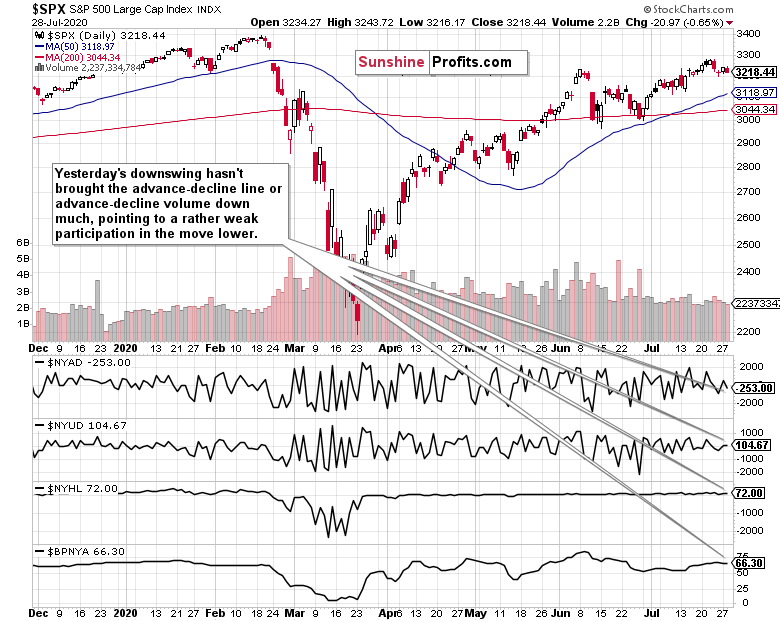
That's as bullish as it gets. Another indication - this time that yesterday's downswing didn't gain much traction, as most stocks refused to participate. With such a protracted consolidation, the ball is in the bulls' court now. How far will they run with it?
Summary
Summing up, the S&P 500 downswing appears to have the nature of wear you out rather than scare you out. With credit markets not sending a clear-cut message, one has to rely on the healthy rotation and technology not leading to the downside. With current corona cases being a non-event to stocks, it's renewed lockdowns (dialed back reopenings), real flare-ups in the U.S. - China tensions, or policy missteps sapping the fragile recovery, that can hurt the stock bull. Tomorrow's tech heavyweights' earnings will be THE bellwether, and it pays going into that moment with one's guard up. Judged today, a renewed stock upswing is still the more likely scenario.
Thank you for reading today's free analysis. If you would like to receive daily premium follow-ups, I encourage you to sign up for my Stock Trading Alerts to also benefit from the trading action described - the moment it happens. The full analysis includes more details about current positions and levels to watch before deciding to open any new ones or where to close existing ones.
Thank you.
Monica Kingsley
Stock Trading Strategist
Sunshine Profits: Analysis. Care. Profits. -
Making Sense of the Short-Term S&P 500 Chop
July 28, 2020, 9:29 AMEven after yesterday's rebound, the S&P keeps trading merely at the early June highs. Is this just a reflexive rebound before the stock upswing rolls over to the downside? I don't think so, and in today's analysis will make the case why another leg higher is still more likely than seeing stocks plunge.
Yes, stocks are taking their time to make the next move. Little wonder given the recent technology trading - rotation can't carry the S&P 500 upswing on its own. But the stock with the greatest weight in the index, Microsoft (MSFT), stood steady again yesterday. Part and parcel of base building in tech before the talk of a bubble arrived in earnest. That's the best the stock bulls can hope for - and based on the semiconductors (XSD ETF) performance, they can indeed more than hope so.
Hope is a double-edged and potentially very dangerous word both in the markets and in life. It's best to see the situation for what it is, free from rose-tinted or black-tinted glasses - which is exactly the way it should be.
Let's take corona deaths as an example. Given the hair-raising headlines, would you expect to find such a daily fatalities chart (courtesy of Lew Rockwell, Vasko Kohlmayer and the worldometers website)?
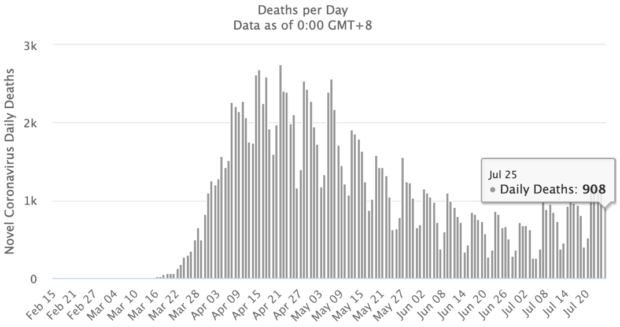
I don't think so. Objective minds and reality still rule, thankfully.
On Thursday, I've laid out the market's sensitivities this way:
(...) as strange as it might sound, the stock market isn't about the real economy struggles these weeks. All eyes are on the stimulus and vaccine hopes (whatever one imagines under the latter term), not on the corona case panic and hyped death charts.
Such were my yesterday's thoughts on the policy measures dynamics:
(...) Stimulus is coming, and regardless of its final shape and size, markets are going to cheer it. The Fed is no longer in a wait-and-see weekly mode. Stocks expect a policy move, and are still positioned to benefit before inflation or economic realities (thornier road ahead than many an alphabet soup recovery projection implies) strike.
S&P 500 in the Short-Run
I'll start with the daily chart perspective (charts courtesy of http://stockcharts.com ):
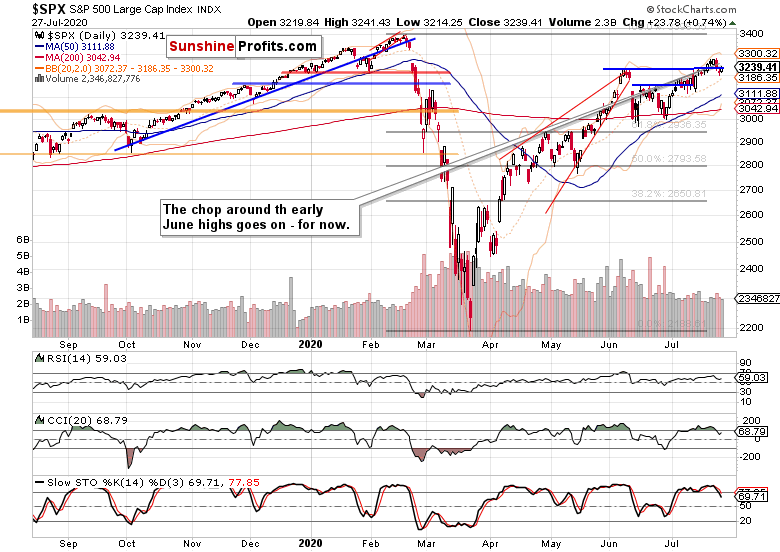
Stocks keep moving around the line connecting the early June highs, and the daily chart is seemingly providing little clarity as to the upcoming move. I understand the price action as a prolonged base building, and look for stocks to make another move to the upside despite the weakening daily indicators.
Their sell signals would imply a downside move, but the price moves aren't mirroring that, and neither the volume supports a reversal hypothesis currently. The lack of a true plunge thus makes the consolidation followed by more upside scenario, the more likely one.
It's also the credit markets that are painting a far from equivocal picture.
The Credit Markets' Point of View
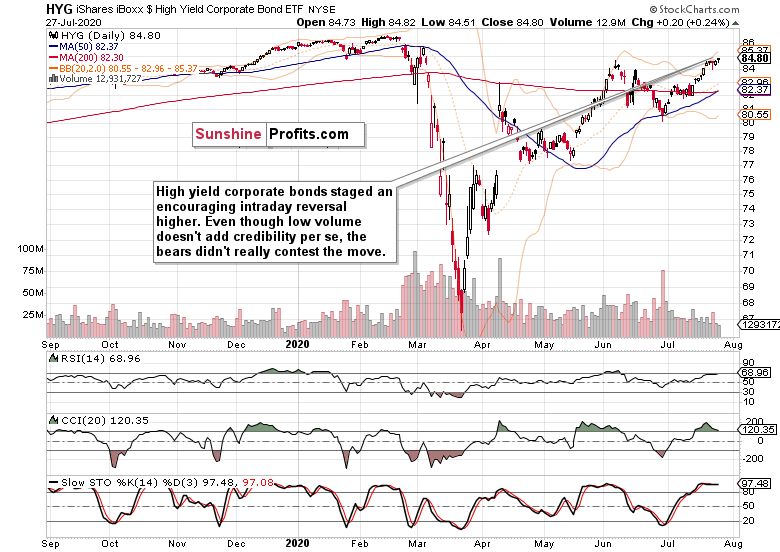
High yield corporate bonds (HYG ETF) recovered from the intraday downswing, and closed at its new July highs. Positive price action in itself, but the move lacked convincing volume. A mixed bag calling for caution, with the bulls getting the benefit of the doubt.
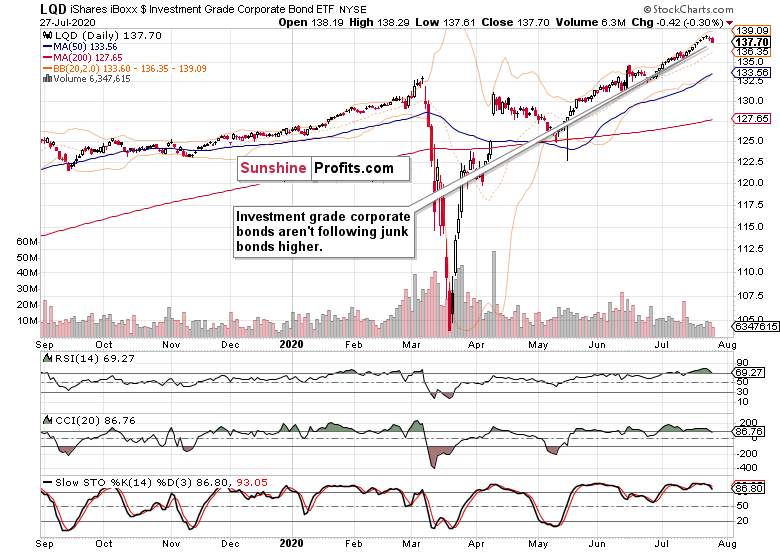
The investment grade corporate bonds (LQD ETF) declined, and that's a short-term warning. While solidly trending higher, their current soft patch merits keeping a close eye on, as it doesn't confirm the HYG ETF upswing.
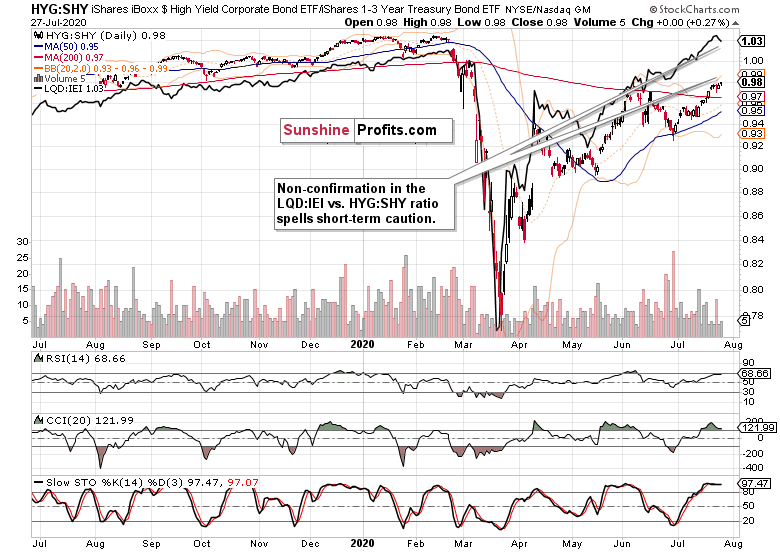
The ratios finetune the picture. Both the leading credit market ratios - high yield corporate bonds to short-term Treasuries (HYG:SHY) and investment grade corporate bonds to longer-dated Treasuries (LQD:IEI) aren't in tune with each other for a second trading day running. This hesitation has the potential to spill over into upcoming sessions.
In perspective, the longer-dated Treasuries also lost ground, with both TLT ETF and TLH ETF declining. Could we be looking at a rotation into riskier plays?
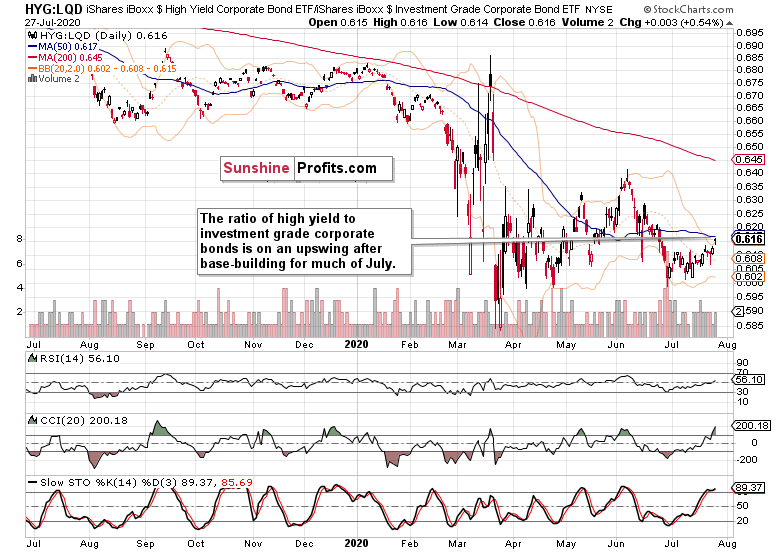
The comparison of both corporate bonds' varieties (HYG:LQD ratio) confirms that. The credit markets are indeed enjoying a relatively increased appetite for junk corporate bonds.
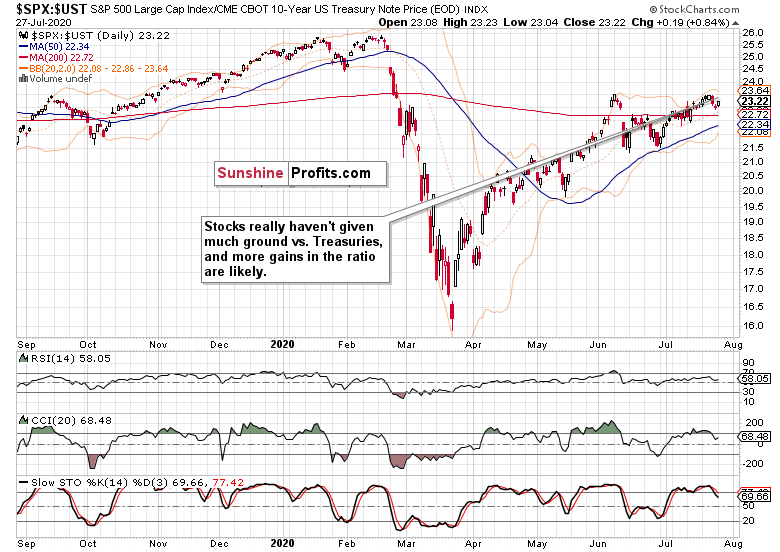
The ratio of stocks to all Treasuries ($SPX:$UST) certainly shows that stocks aren't falling out of favor here. To the contrary, I see the ratio as likely to challenge its July highs, and move upwards. Given the new stimulus on the horizon, it's not out of the unexpected to see quality debt instruments gyrate on a short-term basis. Once the details are in, the dust settles, and new moves commence - that's what I am keenly looking out for.
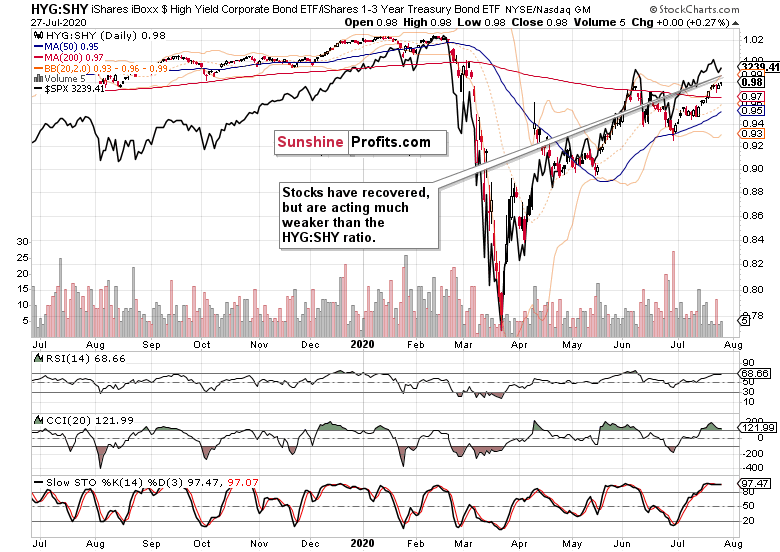
The overlaid S&P 500 closing prices (black line) against the HYG:SHY chart captures the momentary tensions. After a period of stocks outperforming the ratio starting in late June, the S&P 500 is taking a breather these days.
Smallcaps and Emerging Markets
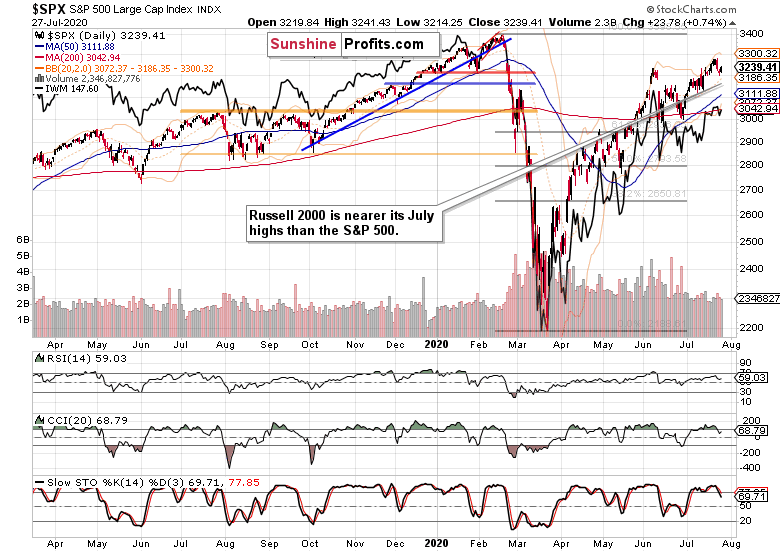
The Russell 2000 (IWM ETF) is acting constructively on a short-term basis - it's much closer to its July highs than the 500-strong index is.
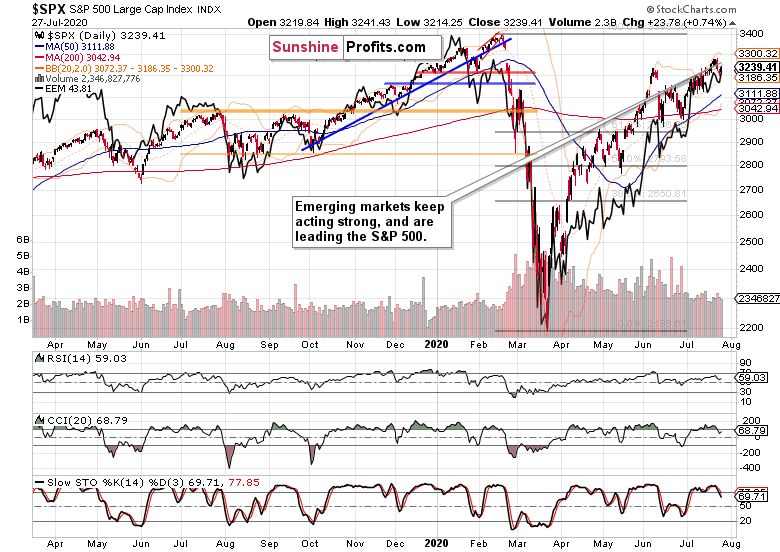
Emerging markets (EEM ETF) are another cup of tea - they're strong not only in the very short-term, but also on the medium-term basis. That's a positive cue for U.S. stocks as well.
Summary
Summing up, the S&P 500 rose yesterday, but the credit markets aren't unilaterally supporting the upswing. Such a short-term non-confirmation of theirs can (and likely will) be resolved within the nearest sessions. Rotation into former laggards is underway, technology is not crashing through supports, market breadth keeps being healthy, and volatility is far from trending higher. Despite the stock upswing taking more than its fair share of time to unfold, more signs favor the upcoming upswing than not.
Thank you for reading today's free analysis. If you would like to receive daily premium follow-ups, I encourage you to sign up for my Stock Trading Alerts to also benefit from the trading action described - the moment it happens. The full analysis includes more details about current positions and levels to watch before deciding to open any new ones or where to close existing ones.
Thank you.
Monica Kingsley
Stock Trading Strategist
Sunshine Profits: Analysis. Care. Profits. -
Technology is Holding the Key to the Next S&P 500 Move
July 27, 2020, 7:54 AMGoing into Friday, I was still sticking to the bullish S&P 500 outlook. As the index declined, are the prospects of higher prices gone? Not at all, and today's analysis will examine the signs that still lean bullish despite the precarious technology position.
Despite the S&P 500 closing below the line connecting the early June highs, continued unemployment claims rising on the state level (don't forget about those rising ones under the federal pandemic programs either), the fate of the $600 weekly addition to unemployment benefits expiring at the end of July, or the U.S. - China confrontations.
On Thursday, I've laid out the market's sensitivities this way:
(...) as strange as it might sound, the stock market isn't about the real economy struggles these weeks. All eyes are on the stimulus and vaccine hopes (whatever one imagines under the latter term), not on the corona case panic and hyped death charts.
Stimulus is coming, and regardless of its final shape and size, markets are going to cheer it. The Fed is no longer in a wait-and-see weekly mode. Stocks expect a policy move, and are still positioned to benefit before inflation or economic realities (thornier road ahead than many an alphabet soup recovery projection implies) strike.
Talking economic realities, what about the societal and interpersonal ones? Sobering snippets of overnight U.S. corona fear transformations courtesy of Big League Politics:
- 75 percent believe that things will never return to normal
- 59 percent are too afraid to go back to their workplace with others
- 75 percent feel that handshakes will no longer be customary
- 38 percent want physical offices permanently removed and replaced with remote work
- 53 percent are nostalgic for the good old days when people weren't forcibly masked while the rest have seemingly become accustomed to the "new normal".
Such shifts underscore why some sectors have it way tougher than others.
S&P 500 in the Medium- and Short-Run
I'll start today's flagship Stock Trading Alert with the weekly chart perspective (charts courtesy of http://stockcharts.com ):
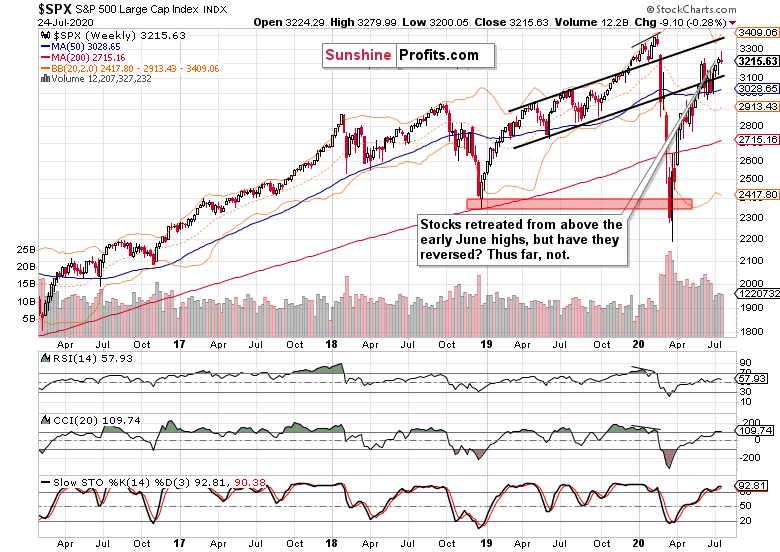
The weekly candlestick bears shape of a reversal, but is it a credible one? Weekly volume didn't pick up, weakening the case for a trend change. The preceding week brought us a hanging man, and that didn't bring the bears out of their caves either.
The weekly chart is thus rather neutral in its implications, but given the non-refusal (by and large) of the move above the early June highs, I still interpret the chart as bullish rather than bearish.
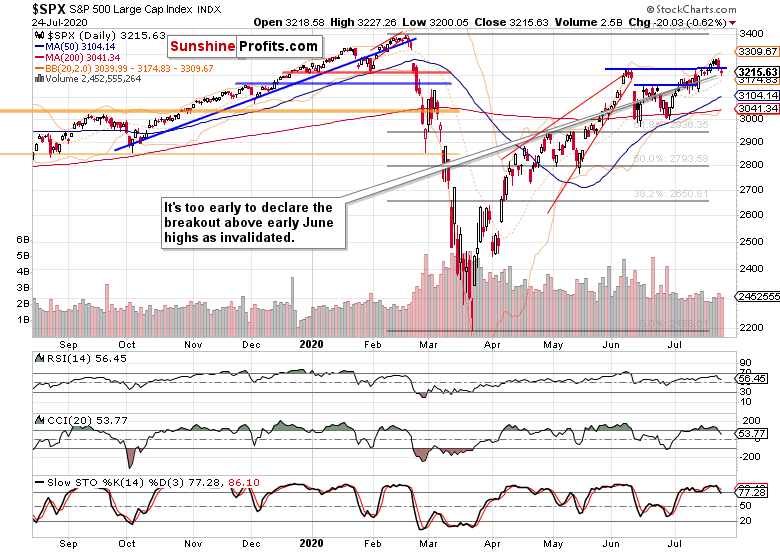
One close below the line connecting the early June highs, doesn't make a breakout invalidation yet. It lack rising volume, and the noticeable lower knot also makes it suspicious.
As the bulls nibble at the late-Feb bearish gap, I expect them to overcome it eventually. Especially since all eyes are on the stimulus to counter the harsh economic realities of many real economy sectors.
Such were my Friday's words regarding the days finishing in the red:
(...) Earlier in July, we have also experienced an odd bearish day that brought out the bears from their caves, without really changing the situation on the ground materially.
I expect the same dynamics to play out this time as well, regardless of the headlines touting more stimulus details only next week, or Trump discussing the China phase one trade deal value.
Meanwhile, the credit market signals are still pointing largely one way.
The Credit Markets' Point of View
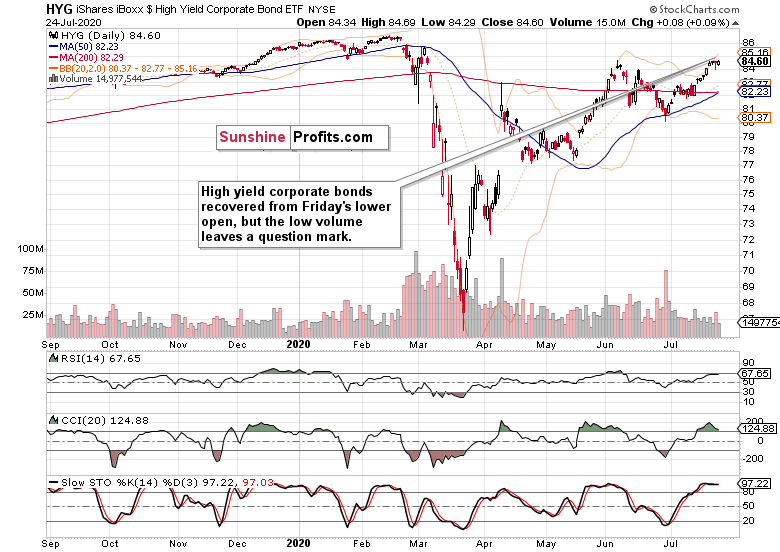
High yield corporate bonds (HYG ETF) reversed their opening weakness, and closed near the upper border of its recent range. Encouraging in itself, the move though lacked convincing volume, which makes the implications less bullish than when viewed with only price action in mind.
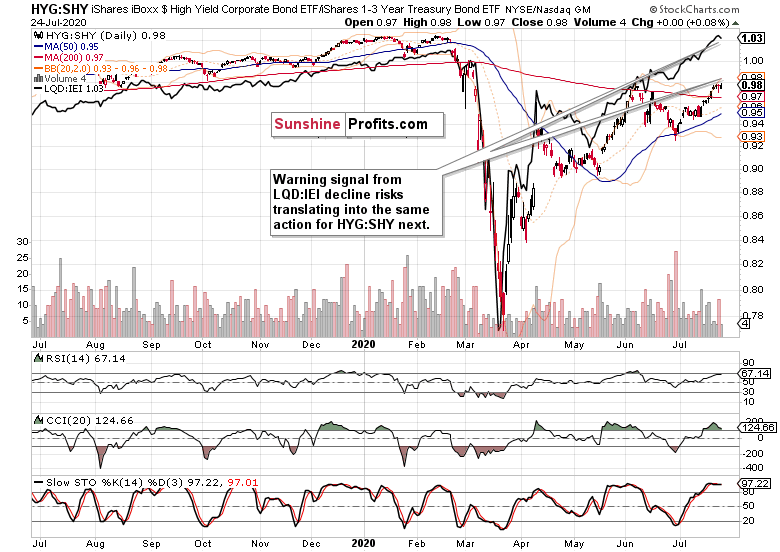
The ratios finetune the picture. Both the leading credit market ratios - high yield corporate bonds to short-term Treasuries (HYG:SHY) and investment grade corporate bonds to longer-dated Treasuries (LQD:IEI) paused - with the latter declining. This one-day hesitation has the potential to spill over into upcoming sessions' trading.
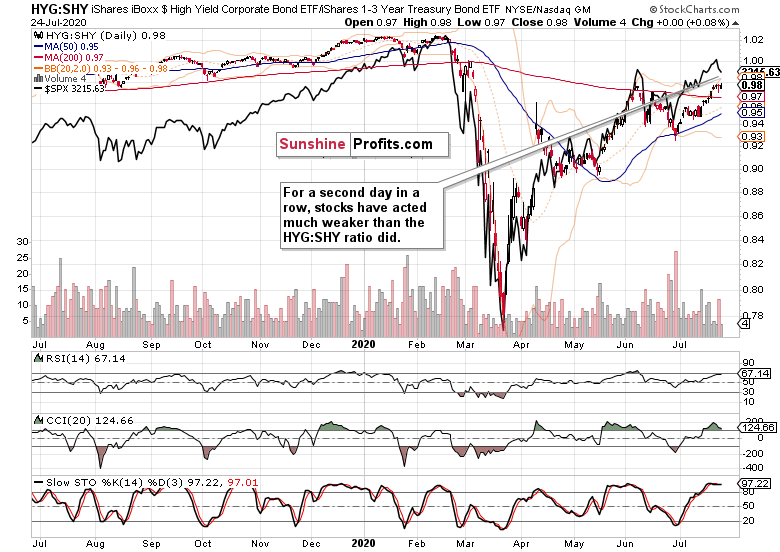
The overlaid S&P 500 closing prices (black line) against the HYG:SHY chart shows just that the pace of stocks' fall, has moderated. With more air out of their relative outperformance seen since late June, the judgmental scope for further declines becomes more limited. Unless the ratio plunges, that is - which is what I don't expect it to do right now.
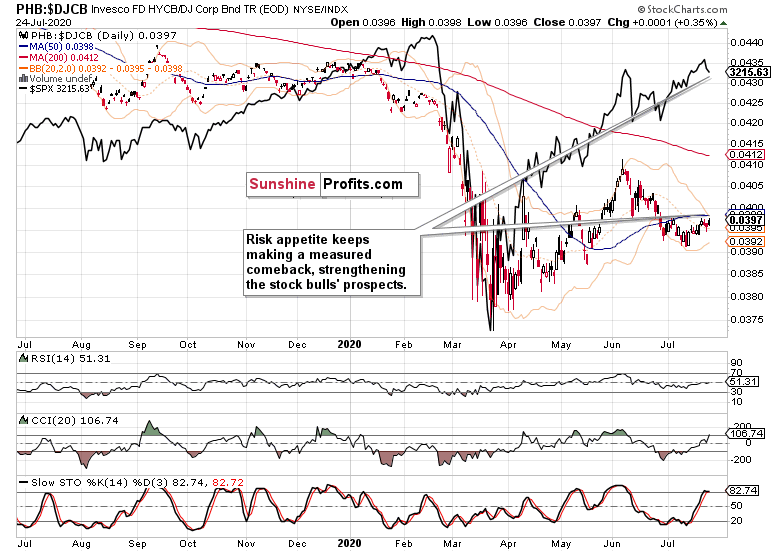
The recovering ratio of high yield corporate bonds to all corporate bonds (PHB:$DJCB) supports the notion of the stock bull having further to run. The sectoral rotation theme stands to benefit from such a dynamic.
Smallcaps, Emerging Markets and the S&P 500 Internals
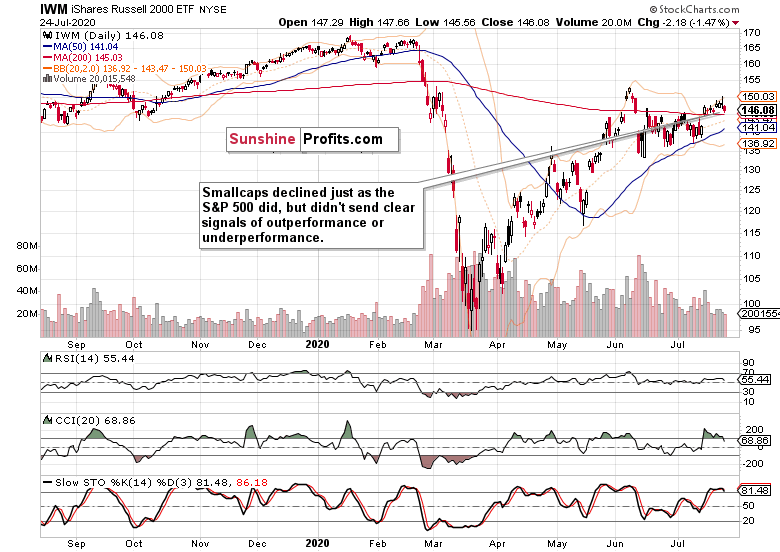
The Russell 2000 (IWM ETF) also fell on Friday, but the daily volume left quite something to be desired. For the bears, that is. As a result, Friday's candle appears to be merely a daily setback.
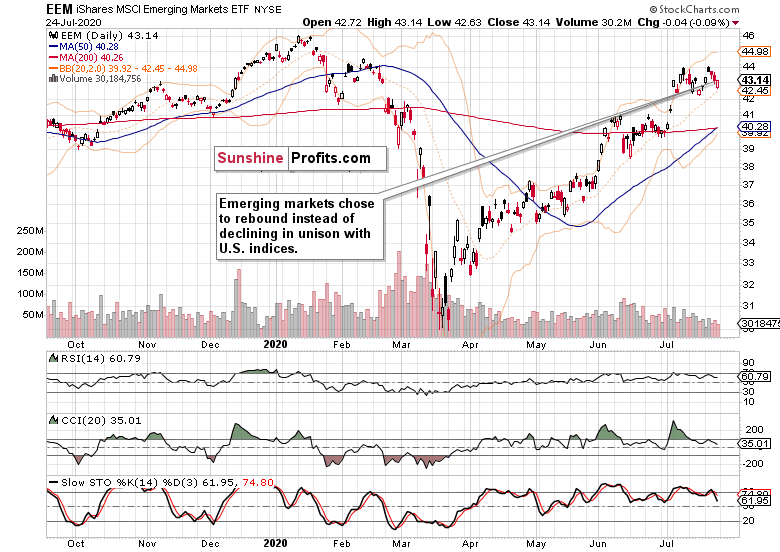
Emerging markets (EEM ETF) proved stronger on Friday, and erased their opening losses almost in full. That's positive for stocks back in the States too - it's a starting point, and obviously more has to follow.
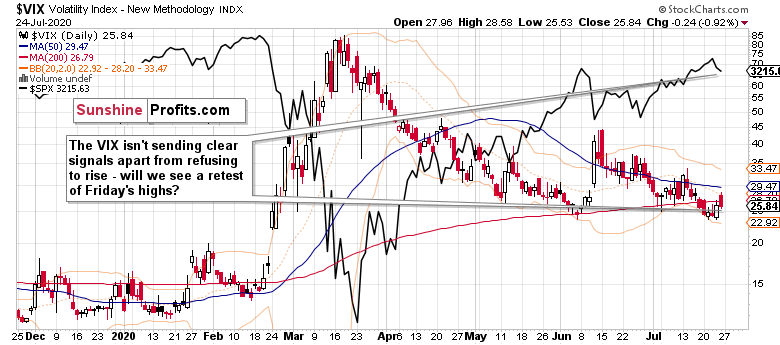
Volatility ($VIX) made an intraday reversal on Friday, though a retest of its opening highs wouldn't be out of the unexpected. This upside bump appears to have a little more to run on the upside, but judging by this chart alone, the stock bull run isn't in danger yet.
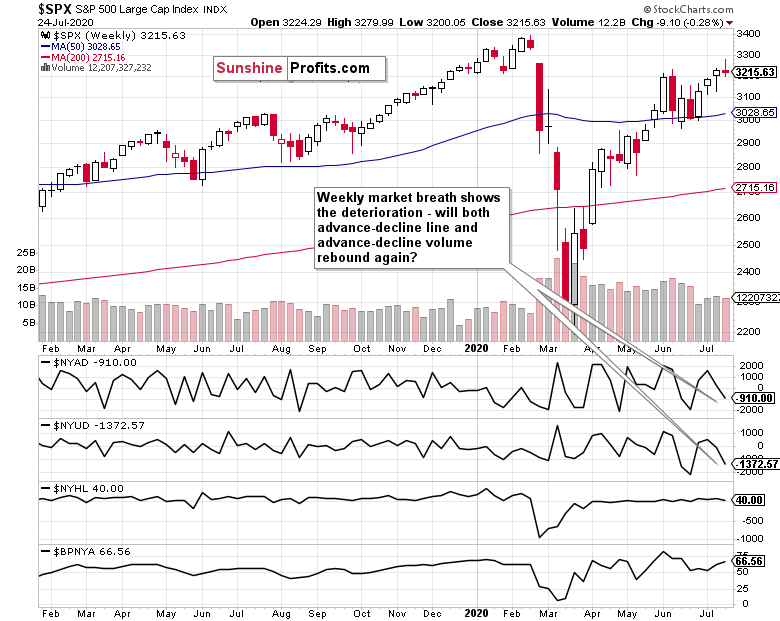
Zooming out, the weekly market breadth provides us with a broader perspective. Please note both the advance-decline line and advance-decline volume having descended into solidly negative values - but the bullish percent index solidly in bull market territory makes a case for an upcoming stock price rebound (perhaps preceded by a bit more base-building).
S&P 500 Sectors in Focus
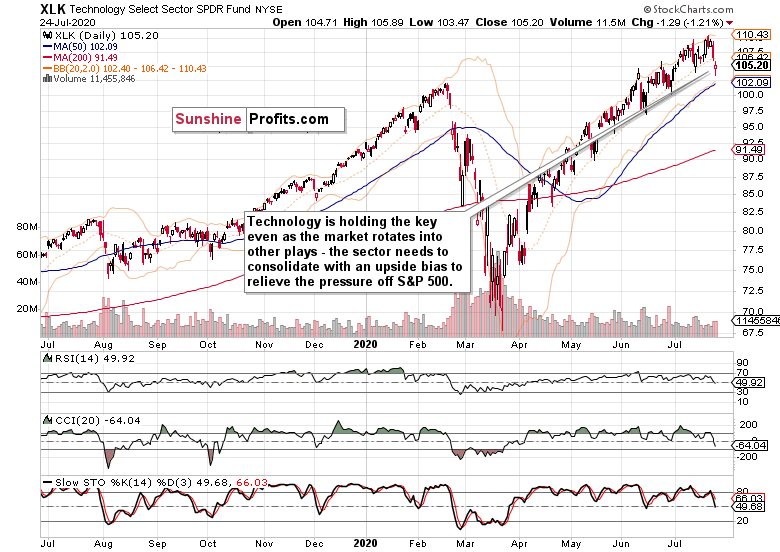
Technology (XLK ETF) holds the key, and not merely in the short-term. On a positive note, it has reversed intraday, closing slightly above its opening values. The rising volume indicates accumulation to me, lending more credibility to the bullish interpretation.
The defining moment though can't be understated. This sector's consolidation with an upside flavor would be very constructive for the S&P 500, as the ongoing rotation into former laggards can't win the day due to weighting.
But the rotational stock bull signs of health are undoubtedly in. I would highlight materials (XLB ETF), healthcare (XLV ETF) and industrials (XLI ETF) as the best of the crowd, followed by the defensive utilities and consumer staples (XLU ETF, XLP ETF respectively). Consumer discretionaries (XLY ETF) are also fighting tooth and nail to keep among the leadership sectors, which is where the heavyweight financials (XLF) are slowly but surely moving too.
Once technology joins in again (or stops standing in the way as a minimum), the stock bull run can go on and leave this soft patch with bullish undertones behind.
Summary
Summing up, Friday's S&P 500 setback hasn't materially changed the optimistic stock outlook, and the balance of signals from related markets still keeps more than slightly favoring the bulls. Technology is the joker, the wild card that would decide the S&P 500 direction in the short run, and either prolong this two-day decline, or let stocks slowly but surely regain their footing, which they seem bound to do still.
Thank you for reading today's free analysis. If you would like to receive daily premium follow-ups, I encourage you to sign up for my Stock Trading Alerts to also benefit from the trading action described - the moment it happens. The full analysis includes more details about current positions and levels to watch before deciding to open any new ones or where to close existing ones.
Thank you.
Monica Kingsley
Stock Trading Strategist
Sunshine Profits: Analysis. Care. Profits.
Free Gold &
Stock Market Newsletter
with details not available
to 99% investors
+ 7 days of Gold Alerts
Gold Alerts
More-
Status
New 2024 Lows in Miners, New Highs in The USD Index
January 17, 2024, 12:19 PM -
Status
Soaring USD is SO Unsurprising – And SO Full of Implications
January 16, 2024, 8:40 AM -
Status
Rare Opportunity in Rare Earth Minerals?
January 15, 2024, 2:06 PM


